fbpx
Learn to build large language model applications: vector databases, langchain, fine tuning and prompt engineering. Learn more

Data Science

Data Science Dojo
Data Science Dojo
| December 27

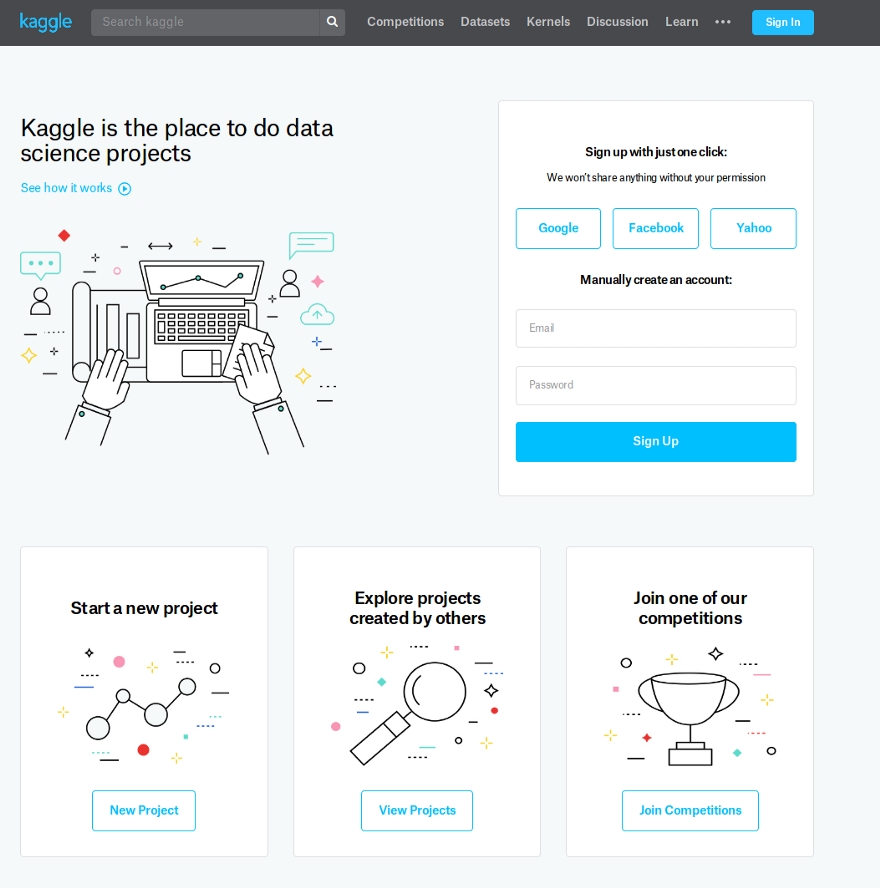
Kaggle is a website where people who are interested in data science and machine learning can compete with each other, learn, and share their work. It’s kind of like a big playground for data nerds! Here are some of the main things you can do on Kaggle:

Kaggle

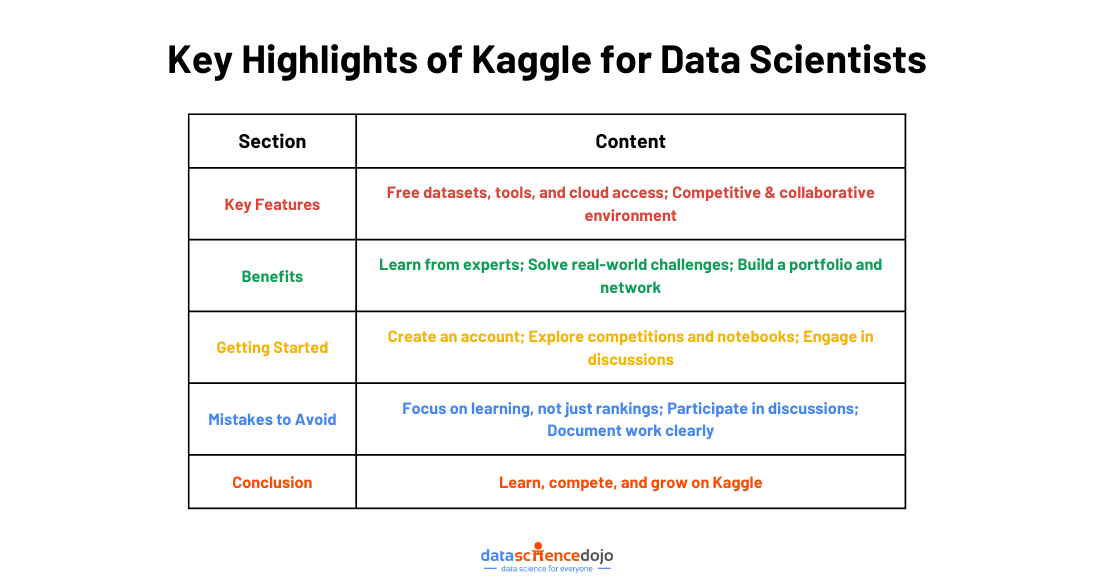
  1. Join competitions: Companies and organizations post challenges on Kaggle, and you can use your data skills to try to solve them. The winners often get prizes or recognition, so it’s a great way to test your skills and see how you stack up against other data scientists.
  2. Learn new skills: Kaggle has a lot of free courses and tutorials that can teach you about data science, machine learning, and other related topics. It’s a great way to learn new things and stay up-to-date on the latest trends.
  3. Find and use datasets: Kaggle has a huge collection of public datasets that you can use for your own projects. This is a great way to get your hands on real-world data and practice your data analysis skills.
  4. Connect with other data scientists: Kaggle has a large community of data scientists from all over the world. You can connect with other members, ask questions, and share your work. This is a great way to learn from others and build your network.


Learn to build LLM applications


Growing community of Kaggle


Kaggle is a platform for data scientists to share their work, compete in challenges, and learn from each other. In recent years, there has been a growing trend of data scientists joining Kaggle. This is due to a number of factors, including the following:


The increasing availability of data

The amount of data available to businesses and individuals is growing exponentially. This data can be used to improve decision-making, develop new products and services, and gain a competitive advantage. Data scientists are needed to help businesses make sense of this data and use it to their advantage. 


Learn more about Kaggle competitions


Growing demand for data-driven solutions

Businesses are increasingly looking for data-driven solutions to their problems. This is because data can provide insights that would otherwise be unavailable. Data scientists are needed to help businesses develop and implement data-driven solutions. 

The growing popularity of Kaggle. Kaggle has become a popular platform for data scientists to share their work, compete in challenges, and learn from each other. This has made Kaggle a valuable resource for data scientists and has helped to attract more data scientists to the platform. 


Benefits of using Kaggle for data scientists

There are a number of benefits to data scientists joining Kaggle. These benefits include the following:   

1. Opportunity to share their work

Kaggle provides a platform for data scientists to share their work with other data scientists and with the wider community. This can help data scientists get feedback on their work, build a reputation, and find new opportunities. 

2. Opportunity to compete in challenges

Kaggle hosts a number of challenges that data scientists can participate in. These challenges can help data scientists improve their skills, learn new techniques, and win prizes. 

3. Opportunity to learn from others

Kaggle is a great place to learn from other data scientists. There are a number of resources available on Kaggle, such as forums, discussions, and blogs. These resources can help data scientists learn new techniques, stay up-to-date on the latest trends, and network with other data scientists. 

If you are a data scientist, I encourage you to join Kaggle. Kaggle is a valuable resource for data scientists, and it can help you improve your skills, to learn new techniques, and build your career. 

 
Why data scientists must use Kaggle

In addition to the benefits listed above, there are a few other reasons why data scientists might join Kaggle. These reasons include:

1. To gain exposure to new data sets

Kaggle hosts a wide variety of data sets, many of which are not available elsewhere. This can be a great way for data scientists to gain exposure to new data sets and learn new ways of working with data. 

2. To collaborate with other data scientists

Kaggle is a great place to collaborate with other data scientists. This can be a great way to learn from others, to share ideas, and to work on challenging problems. 

3. To stay up-to-date on the latest trends

Kaggle is a great place to stay up-to-date on the latest trends in data science. This can be helpful for data scientists who want to stay ahead of the curve and who want to be able to offer their clients the latest and greatest services. 

If you are a data scientist, I encourage you to consider joining Kaggle. Kaggle is a great place to learn, to collaborate, and to grow your career. 

Data Science Dojo
Ayesha Saleem
| November 10

With the advent of language models like ChatGPT, improving your data science skills has never been easier. 

Data science has become an increasingly important field in recent years, as the amount of data generated by businesses, organizations, and individuals has grown exponentially.

With the help of artificial intelligence (AI) and machine learning (ML), data scientists are able to extract valuable insights from this data to inform decision-making and drive business success.

However, becoming a skilled data scientist requires a lot of time and effort, as well as a deep understanding of statistics, programming, and data analysis techniques. 

ChatGPT is a large language model that has been trained on a massive amount of text data, making it an incredibly powerful tool for natural language processing (NLP).


Uses of generative AI for data scientists

Generative AI can help data scientists with their projects in a number of ways.

Test your knowledge of generative AI


Data cleaning and preparation

Generative AI can be used to clean and prepare data by identifying and correcting errors, filling in missing values, and deduplicating data. This can free up data scientists to focus on more complex tasks.

Example: A data scientist working on a project to predict customer churn could use generative AI to identify and correct errors in customer data, such as misspelled names or incorrect email addresses. This would ensure that the model is trained on accurate data, which would improve its performance.

Large language model bootcamp

Feature engineering

Generative AI can be used to create new features from existing data. This can help data scientists to improve the performance of their models.

Example: A data scientist working on a project to predict fraud could use generative AI to create a new feature that represents the similarity between a transaction and known fraudulent transactions. This feature could then be used to train a model to predict whether a new transaction is fraudulent.

Read more about feature engineering

Model development

Generative AI can be used to develop new models or improve existing models. For example, generative AI can be used to generate synthetic data to train models on, or to develop new model architectures.

Example: A data scientist working on a project to develop a new model for image classification could use generative AI to generate synthetic images of different objects. This synthetic data could then be used to train the model, even if there is not a lot of real-world data available.

Learn to build LLM applications


Model evaluation

Generative AI can be used to evaluate the performance of models on data that is not used to train the model. This can help data scientists to identify and address any overfitting in the model.

Example: A data scientist working on a project to develop a model for predicting customer churn could use generative AI to generate synthetic data of customers who have churned and customers who have not churned.

This synthetic data could then be used to evaluate the model’s performance on unseen data.

Master ChatGPT plugins

Communication and explanation

Generative AI can be used to communicate and explain the results of data science projects to non-technical audiences. For example, generative AI can be used to generate text or images that explain the predictions of a model.

Example: A data scientist working on a project to predict customer churn could use generative AI to generate a report that explains the factors that are most likely to lead to customer churn. This report could then be shared with the company’s sales and marketing teams to help them to develop strategies to reduce customer churn.


How to use ChatGPT for Data Science projects

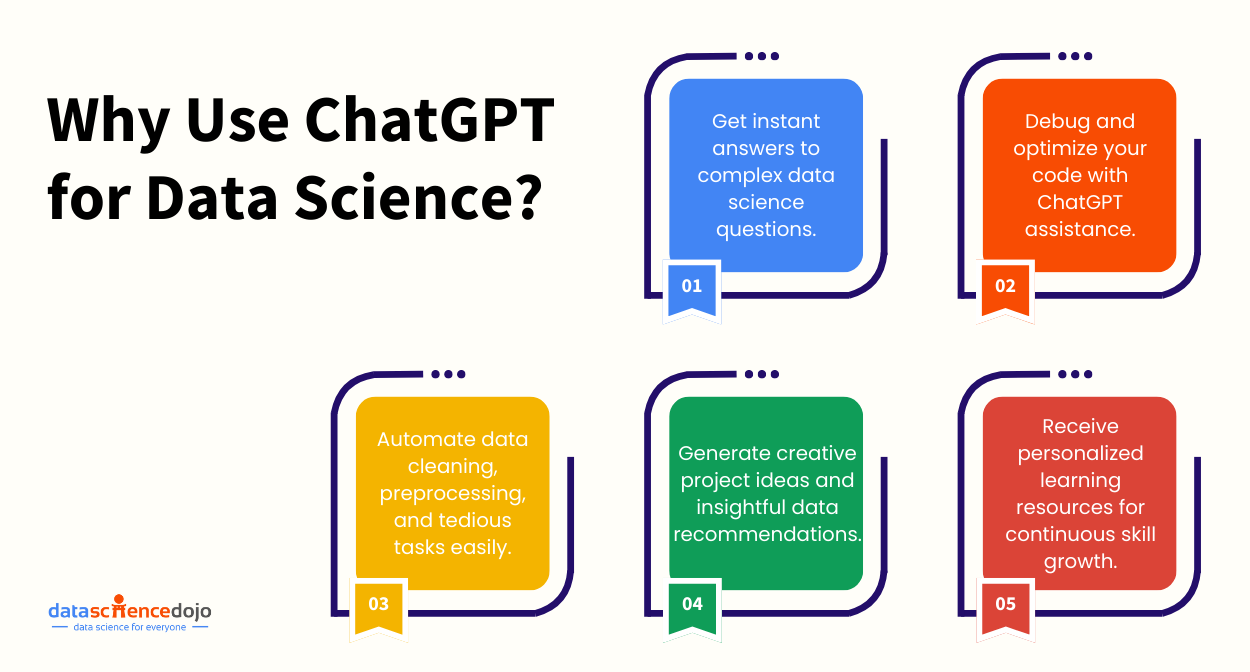
With its ability to understand and respond to natural language queries, ChatGPT can be used to help you improve your data science skills in a number of ways. Here are just a few examples: 


data-science-projects
Data science projects to build your portfolio – Data Science Dojo

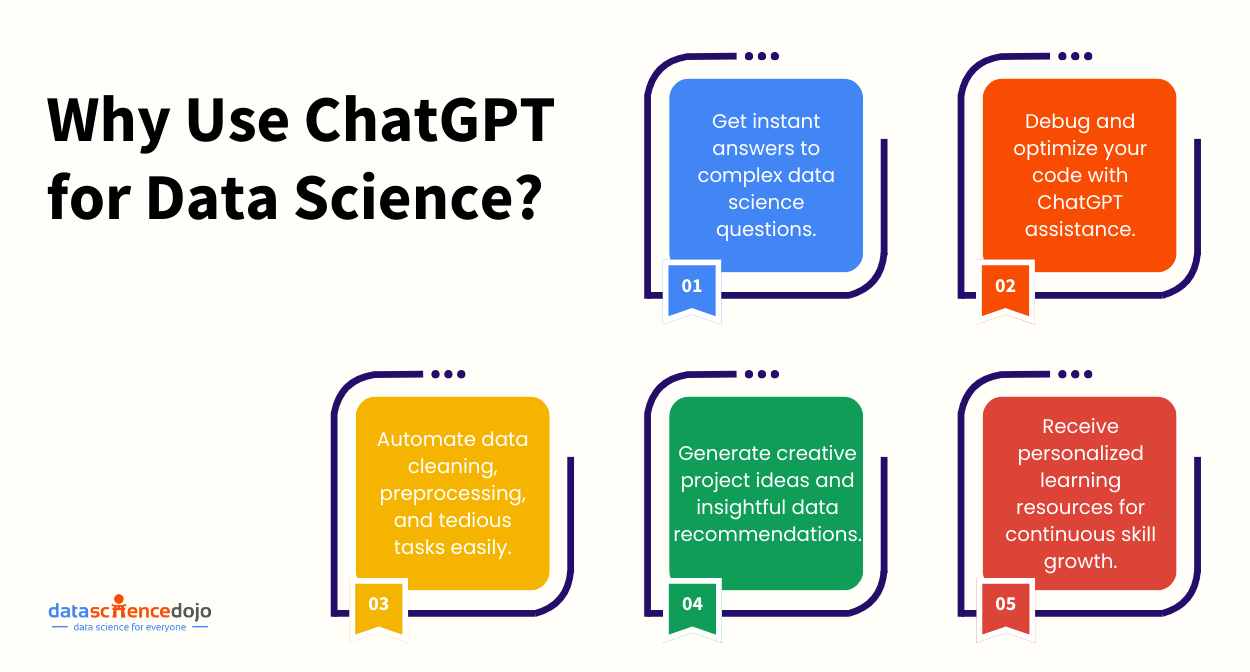
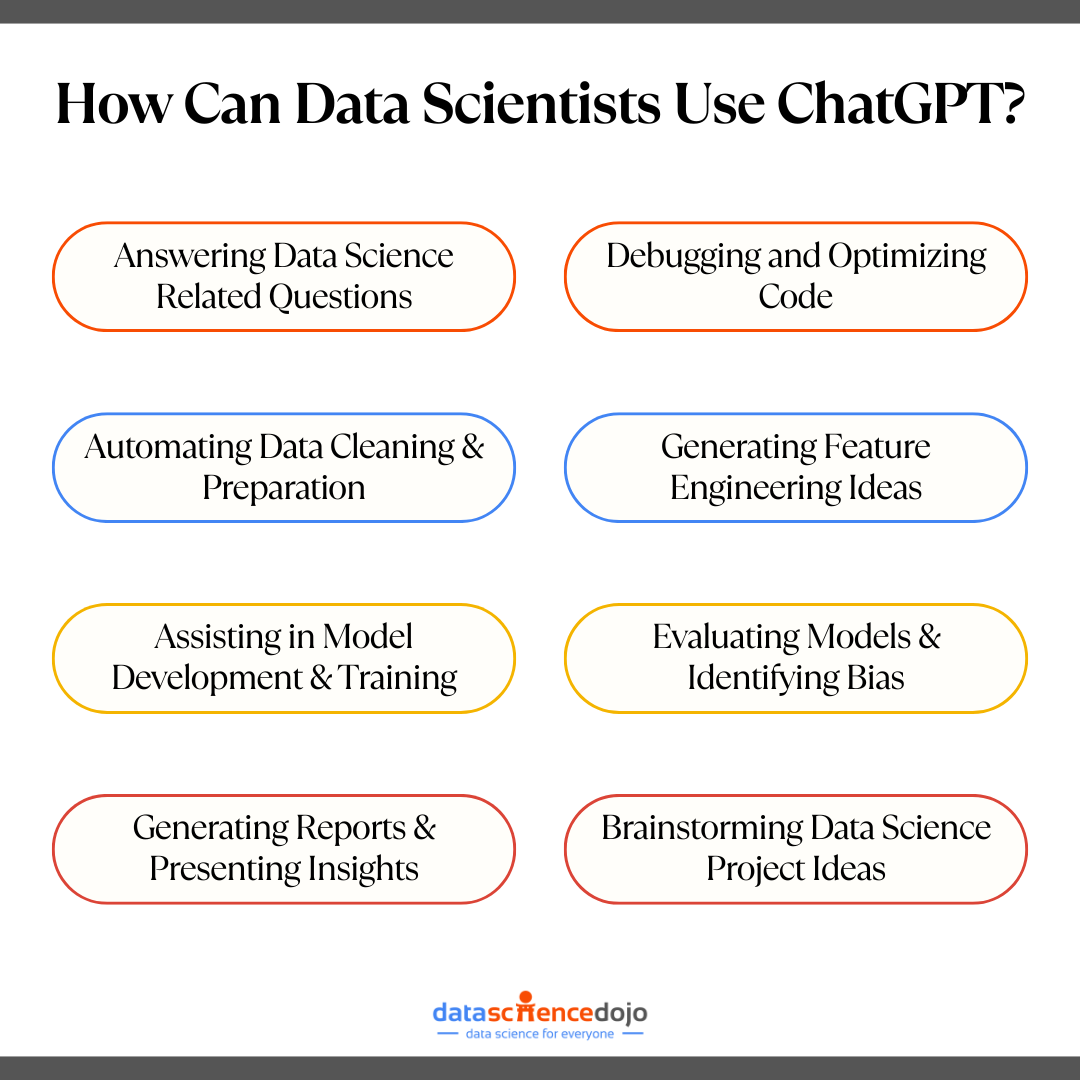
Answering data science-related questions 

One of the most obvious ways in which ChatGPT can help you improve your data science skills is by answering your data science-related questions.

Whether you’re struggling to understand a particular statistical concept, looking for guidance on a programming problem, or trying to figure out how to implement a specific ML algorithm, ChatGPT can provide you with clear and concise answers that will help you deepen your understanding of the subject. 


Providing personalized learning resources 

In addition to answering your questions, ChatGPT can also provide you with personalized learning resources based on your specific interests and skill level.


Read more about ChatGPT plugins


For example, if you’re just starting out in data science, ChatGPT can recommend introductory courses or tutorials to help you build a strong foundation. If you’re more advanced, ChatGPT can recommend more specialized resources or research papers to help you deepen your knowledge in a particular area. 


Offering real-time feedback 

Another way in which ChatGPT can help you improve your data science skills is by offering real-time feedback on your work.

For example, if you’re working on a programming project and you’re not sure if your code is correct, you can ask ChatGPT to review your code and provide feedback on any errors or issues it finds. This can help you catch mistakes early on and improve your coding skills over time. 


Generating data science projects and ideas 

Finally, ChatGPT can also help you generate data science projects and ideas to work on. By analyzing your interests, skill level, and current knowledge, ChatGPT can suggest project ideas that will challenge you and help you build new skills.

Additionally, if you’re stuck on a project and need inspiration, ChatGPT can provide you with creative ideas or alternative approaches that you may not have considered. 


Improve your data science skills with generative AI

In conclusion, ChatGPT is an incredibly powerful tool for improving your data science skills. Whether you’re just starting out or you’re a seasoned professional, ChatGPT can help you deepen your understanding of data science concepts, provide you with personalized learning resources, offer real-time feedback on your work, and generate new project ideas.

By leveraging the power of language models like ChatGPT, you can accelerate your learning and become a more skilled and knowledgeable data scientist. 


Ruhma Khawaja author
Ruhma Khawaja
| October 20

Data science bootcamps are replacing traditional degrees.


They are experiencing a surge in popularity, due to their focus on practicality, real-world skills, and accelerated success. But with a multitude of options available, choosing the right data science bootcamp can be a daunting task.

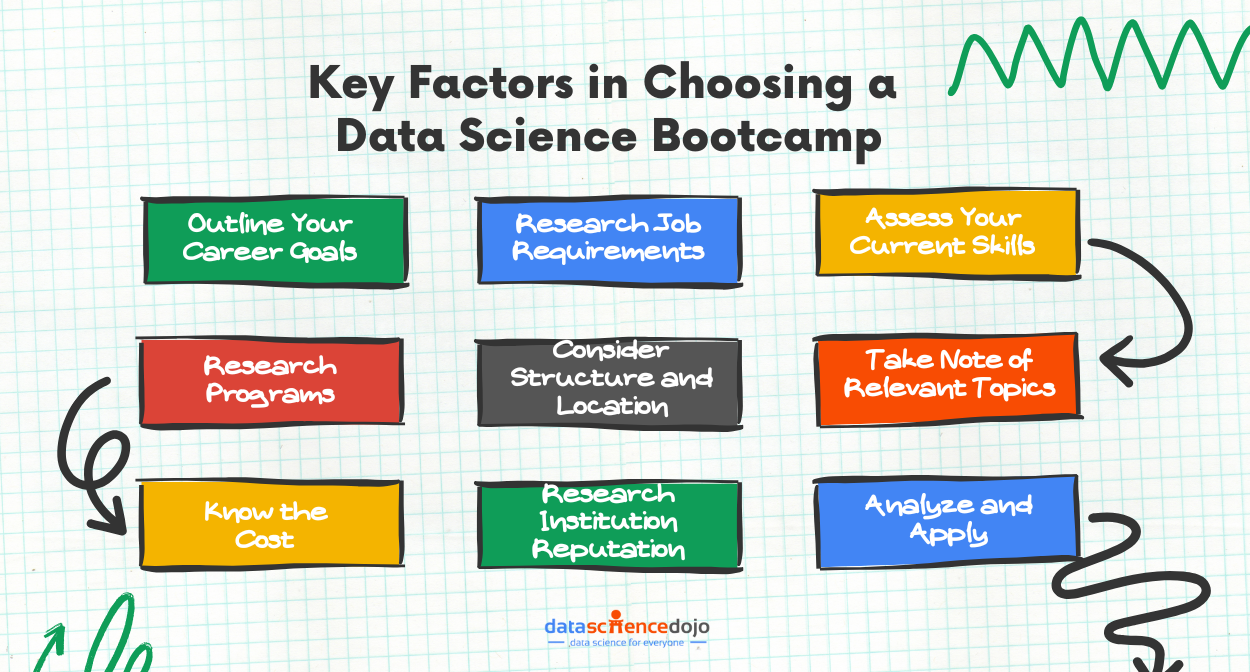
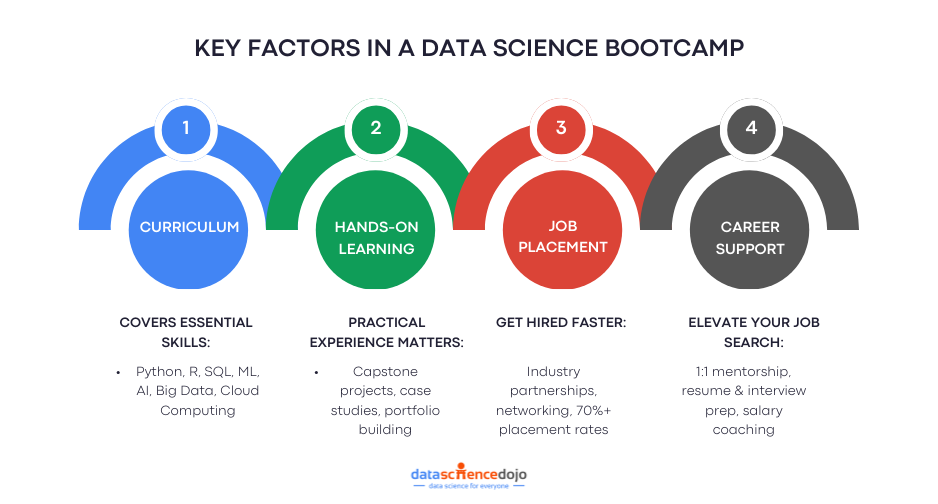
There are several crucial factors to consider, including your career aspirations, the specific skills you need to acquire, program costs, and the bootcamp’s structure and location.

To help you make an informed decision, here are detailed tips on how to select the ideal data science bootcamp for your unique needs:

LLM Bootcamps

The challenge: Choosing the right data science bootcamp

  • Outline your career goals: What do you want to do with a data science degree? Do you want to be a data scientist, a data analyst, or a data engineer? Once you know your career goals, you can start to look for a bootcamp that will help you achieve them. 
  • Research job requirements: What skills do you need to have to get a job in data science? Once you know the skills you need, you can start to look for a bootcamp that will teach you those skills. 
  • Assess your current skills: How much do you already know about data science? If you have some basic knowledge, you can look for a bootcamp that will build on your existing skills. If you don’t have any experience with data science, you may want to look for a bootcamp that is designed for beginners. 
  • Research programs: There are many different data science bootcamps available. Do some research to find a bootcamp that is reputable and that offers the skills you need. 

Large language model bootcamp

Read more –> 10 best data science bootcamps in 2023


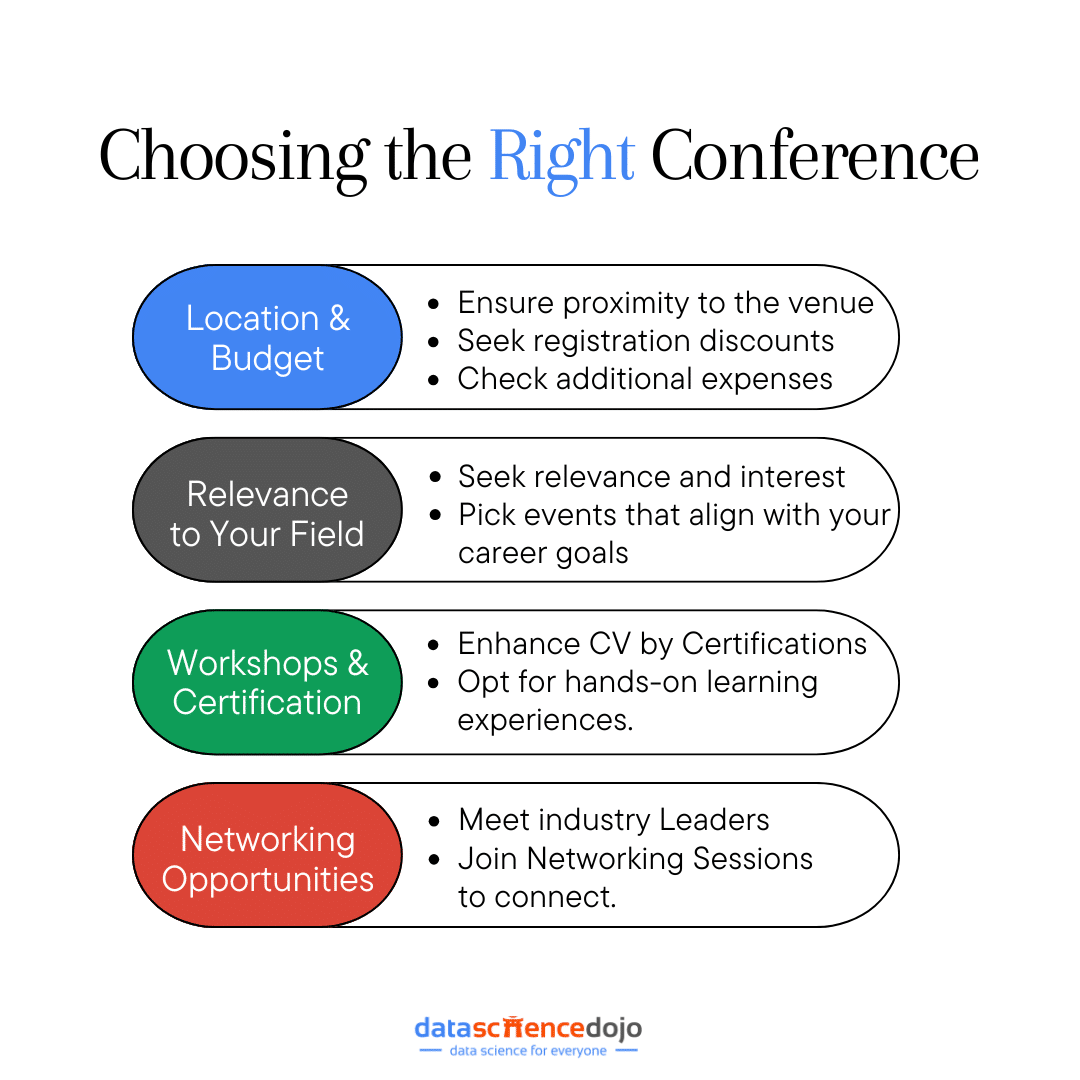
  • Consider structure and location: Do you want to attend an in-person bootcamp or an online bootcamp? Do you want to attend a bootcamp that is located near you or one that is online? 
  • Take note of relevant topics: What topics will be covered in the bootcamp? Make sure that the bootcamp covers the topics that are relevant to your career goals. 
  • Know the cost: How much does the bootcamp cost? Make sure that you can afford the cost of the BootCamp. 
  • Research institution reputation: Choose a bootcamp from a reputable institution or university. 
  • Ranking ( mention switch up, course report, career karma and other reputable rankings 

By following these tips, you can choose the right data science bootcamp for you and start your journey to a career in data science. 

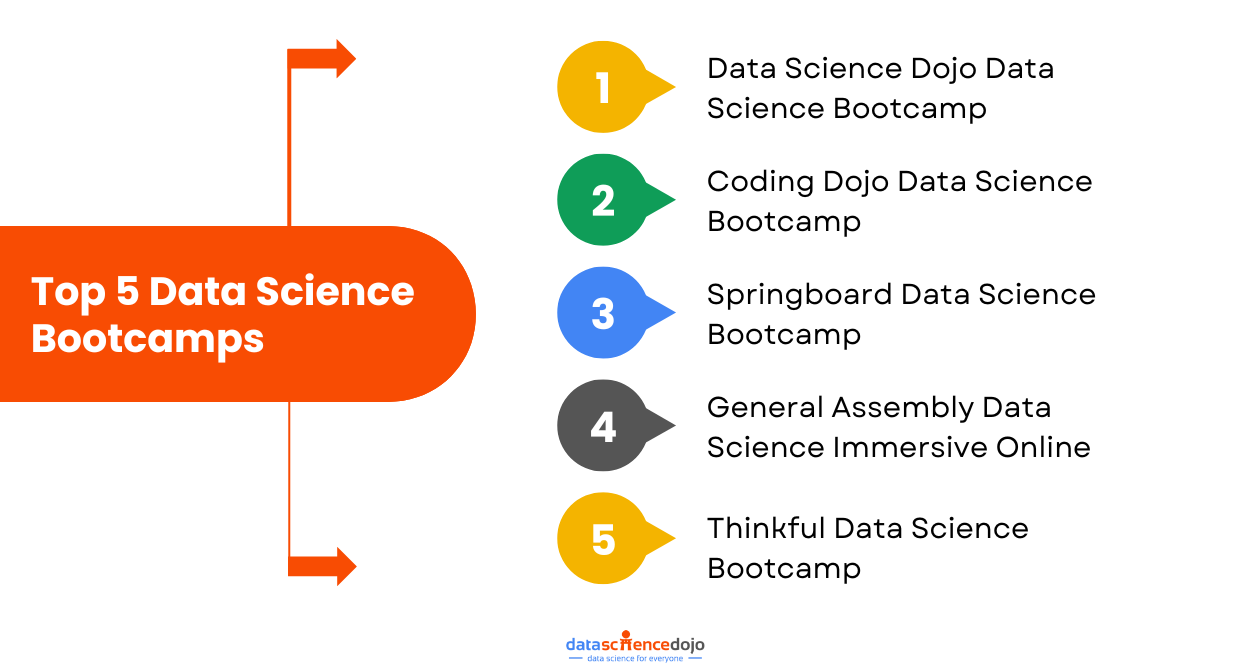
Best picks – Top 5 data science bootcamp to look out for  

5 data science bootcamp to look out for  
5 data science bootcamp to look out for

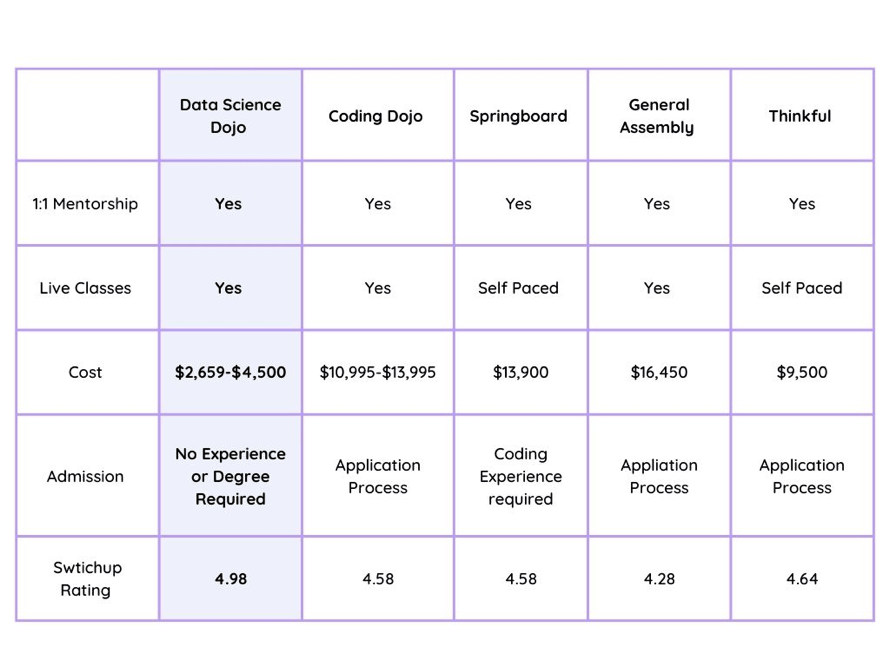
1. Data Science Dojo Data Science Bootcamp

Delivery Format: Online and In-person 

Tuition: $2,659 to $4,500 

Duration: 16 weeks 

Data Science Dojo Bootcamp stands out as an exceptional option for individuals aspiring to become data scientists. It provides a supportive learning environment through personalized mentorship and live instructor-led sessions. The program welcomes beginners, requiring no prior experience, and offers affordable tuition with convenient installment plans featuring 0% interest.  

The bootcamp adopts a business-first approach, combining theoretical understanding with practical, hands-on projects. The team of instructors, possessing extensive industry experience, offers individualized assistance during dedicated office hours, ensuring a rewarding learning journey. 


2. Coding Dojo Data Science Bootcamp Online Part-Time

Delivery Format: Online 

Tuition: $11,745 to $13,745 

Duration: 16 to 20 weeks 

Next on the list, we have Coding Dojo. The bootcamp offers courses in data science and machine learning. The bootcamp is open to students with any background and does not require a four-year degree or prior programming experience. Students can choose to focus on either data science and machine learning in Python or data science and visualization.

The bootcamp offers flexible learning options, real-world projects, and a strong alumni network. However, it does not guarantee a job, and some prior knowledge of programming is helpful. 


3. Springboard Data Science Bootcamp

Delivery Format: Online 

Tuition: $14,950 

Duration: 12 months long 

Springboard’s Data Science Bootcamp is an online program that teaches students the skills they need to become data scientists. The program is designed to be flexible and accessible, so students can learn at their own pace and from anywhere in the world.

Springboard also offers a job guarantee, which means that if you don’t land a job in data science within six months of completing the program, you’ll get your money back. 


4. General Assembly Data Science Immersive Online

Delivery Format: Online, in real-time 

Tuition: $16,450 

Duration: Around 3 months

General Assembly’s online data science bootcamp offers an intensive learning experience. The attendees can connect with instructors and peers in real-time through interactive classrooms. The course includes topics like Python, statistical modeling, decision trees, and random forests.

However, this intermediate-level course requires prerequisites, including a strong mathematical background and familiarity with Python. 


5. Thinkful Data Science Bootcamp

Delivery Format: Online 

Tuition: $16,950 

Duration: 6 months 

Thinkful offers a data science bootcamp that is known for its mentorship program. The bootcamp is available in both part-time and full-time formats. Part-time students can complete the program in 6 months by committing 20-30 hours per week.

Full-time students can complete the program in 5 months by committing 50 hours (about 2 days) per week. Payment plans, tuition refunds, and scholarships are available for all students. The program has no prerequisites, so both fresh graduates and experienced professionals can take it. 


Learn practical data science today!

Ruhma Khawaja author
Ruhma Khawaja
| September 19

The mobile app development industry is in a state of continuous change. With smartphones becoming an extension of our lifestyle, most businesses are scrambling to woo potential customers via mobile apps as that is the only device that is always on our person – at work, at home, or even on a vacation.

COVID-19 had us locked up in our homes for the better part of a year and the mobile started playing an even more important role in our daily lives – grocery haul, attending classes, playing games, streaming on OTT platforms, virtual appointments – all via the smartphone!

Large language model bootcamp

2023: The Year of Innovative Mobile App Trends

Hence, 2023 is the year of new and innovative mobile app development trends. Blockchain for secure payments, augmented reality for fun learning sessions, on-demand apps to deliver drugs home – there’s so much you can achieve with a slew of new technology on the mobile application development front!

A Promising Future: Mobile App Revenue – As per reports by Statista, the total revenue earned from mobile apps is expected to grow at a rate of 9.27% from 2022 to 2026, with a projected market value of 614.40 billion U.S. Dollars by 2026.

What is mobile app technology?

Mobile Application technology refers to various frameworks like (React Native, AngularJS, Laravel, Cake PHP, and so on), tools, components, and libraries that are used to create applications for mobile devices. Mobile app technology is a must-have for reaching a wider audience and making a great fortune in today’s digital-savvy market. The rising apps help businesses to reach more than what they could with a run-of-the-mill website or legacy desktop software.

Importance of mobile app development technologies

Mobile app developers are building everything from consumer-grade apps to high-performing medical solutions, from enterprise solutions to consumer-grade messaging apps in the mobile app industry.

At any stage of development, the developers need to use the latest and greatest technology stack for making their app functional and reliable. This can only be achieved by using the most popular frameworks and libraries that act as a backbone for building quality applications for various platforms like Android, iOS, Windows, etc.


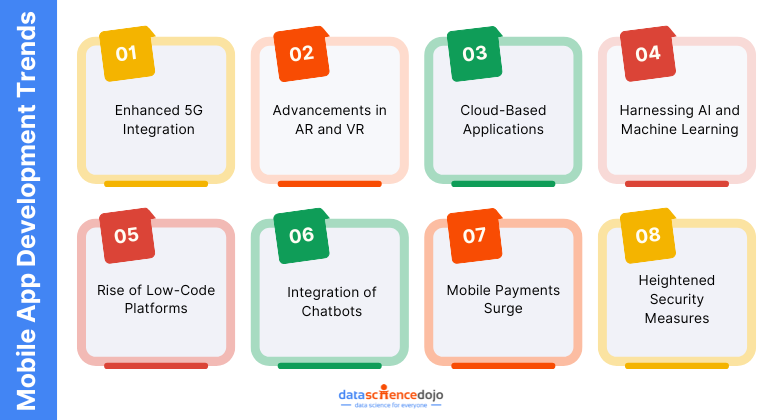
8 mobile app development trends for 2023


Here in this article, we will take a deep dive into the top 9 mobile application trends that are set to change the landscape of mobile app development in 2023!

1. Enhanced 5G Integration:

The rise of 5G technology represents a pivotal milestone in the mobile app development landscape. This revolutionary advancement has unlocked a multitude of opportunities for app creators. With its remarkable speed and efficiency,

5G empowers developers to craft applications that are not only faster but also more data-intensive and reliable than ever before. As we enter 2023, it’s anticipated that developers will make substantial investments in harnessing 5G capabilities to elevate user experiences to unprecedented levels.

2. Advancements in AR and VR:

The dynamic field of mobile app development is witnessing a profound impact from the rapid advancements in Augmented Reality (AR) and Virtual Reality (VR) technologies. These cutting-edge innovations are taking center stage, offering users immersive and interactive experiences.

In the coming year, 2023, we can expect a surge in the adoption of AR and VR by app developers across a diverse range of devices. This trend will usher in a new era of app interactivity, allowing users to engage with digital elements within simulated environments.


Read more –> Predictive analytics vs. AI: Why the difference matters in 2023?


3. Cloud-based applications:

The landscape of mobile app development is undergoing a significant transformation with the emergence of cloud-based applications. This evolution in methodology is gaining traction, and the year 2023 is poised to witness its widespread adoption.

Organizations are increasingly gravitating towards cloud-based apps due to their inherent scalability and cost-effectiveness. These applications offer the advantage of remote data accessibility, enabling streamlined operations, bolstered security, and the agility required to swiftly adapt to evolving requirements. This trend promises to shape the future of mobile app development by providing a robust foundation for innovation and responsiveness.

4. Harnessing AI and Machine Learning:

In the year 2023, the strategic utilization of AI (Artificial Intelligence) and machine learning stands as a game-changing trend, offering businesses a competitive edge. These cutting-edge technologies present an array of advantages, including accelerated development cycles, elevated user experiences, scalability to accommodate growth, precise data acquisition, and cost-effectiveness.

Moreover, they empower the automation of labor-intensive tasks such as testing and monitoring, thereby significantly contributing to operational efficiency.

5. Rise of Low-Code Platforms:

The imminent ascent of low-code platforms is poised to reshape the landscape of mobile app development by 2023. These platforms introduce a paradigm shift, simplifying the app development process substantially. They empower developers with limited coding expertise to swiftly and efficiently create applications.

This transformative trend aligns with the objectives of organizations aiming to streamline their operations and realize cost savings. It is expected to drive the proliferation of corporate mobile apps, catering to diverse business needs.


6. Integration of Chatbots:

Chatbots are experiencing rapid expansion in their role within the realm of mobile app development. They excel at delivering personalized customer support and automating various tasks, such as order processing. In the year 2023, chatbots are poised to assume an even more pivotal role.

Companies are increasingly recognizing their potential in enhancing customer engagement and extracting valuable insights from customer interactions. As a result, the integration of chatbots will be a strategic imperative for businesses looking to stay ahead in the competitive landscape.

Read more —> How to build and deploy custom llm application for your business

7. Mobile Payments Surge:

The year 2023 is poised to witness a substantial surge in the use of mobile payments, building upon the trend’s growing popularity in recent years. Mobile payments entail the seamless execution of financial transactions via smartphones or tablets, ushering in a convenient and secure era of digital transactions.

  • Swift and Secure Transactions: Integrated mobile payment solutions empower users to swiftly and securely complete payments for goods and services. This transformative technology not only expedites financial transactions but also elevates operational efficiency across various sectors.
  • Enhanced Customer Experiences: The adoption of mobile payments enhances customer experiences by eliminating the need for physical cash or credit cards. Users can conveniently make payments anytime, anywhere, contributing to a seamless and user-friendly interaction with businesses.

8. Heightened Security Measures:

In response to the escalating popularity of mobile apps, the year 2023 will witness an intensified focus on bolstering security measures. The growing demand for enhanced security is driven by factors such as the widespread use of mobile devices and the ever-evolving landscape of cybersecurity threats.

  • Stricter Security Policies: Anticipate the implementation of more stringent security policies and safeguards to fortify the protection of user data and privacy. These measures will encompass a comprehensive approach to safeguarding sensitive information, mitigating risks, and ensuring a safe digital environment for users.
  • Staying Ahead of Cyber Threats: Developers and organizations will be compelled to proactively stay ahead of emerging cyber threats. This proactive approach includes robust encryption, multi-factor authentication, regular security audits, and rapid response mechanisms to thwart potential security breaches.

Conclusion: Navigating the mobile app revolution of 2023

As we enter 2023, the mobile app development landscape undergoes significant transformation. With smartphones firmly ingrained in our daily routines, businesses seek to captivate users through innovative apps. The pandemic underscored their importance, from e-commerce to education and telehealth.

The year ahead promises groundbreaking trends:

  • Blockchain Security: Ensuring secure payments.
  • AR/VR Advancements: Offering immersive experiences.
  • Cloud-Based Apps: Enhancing agility and data access.
  • AI & ML: Speeding up development, improving user experiences.
  • Low-Code Platforms: Simplifying app creation.
  • Chatbots: Streamlining customer support.
  • Mobile Payments Surge: Facilitating swift, secure transactions.
  • Heightened Security Measures: Protecting against evolving cyber threats.

2023 not only ushers in innovation but profound transformation in mobile app usage. It’s a year of convenience, efficiency, and innovation, with projected substantial revenue growth. In essence, it’s a chapter in the ongoing mobile app evolution, shaping the future of technology, one app at a time.


Register today

Logo_Tori_small
Erika Balla
| October 3

In today’s world, technology is evolving at a rapid pace. One of the advanced developments is edge computing. But what exactly is it? And why is it becoming so important? This article will explore edge computing and why it is considered the new frontier in international data science trends.

Understanding edge computing

Edge computing is a method where data processing happens closer to where it is generated rather than relying on a centralized data-processing warehouse. This means faster response times and less strain on network resources.

Some of the main characteristics of edge computing include:

  • Speed: Faster data processing and analysis.
  • Efficiency: Less bandwidth usage, which means lower costs.
  • Reliability: More stable, as it doesn’t depend much on long-distance data transmission.

Benefits of implementing edge computing

Implementing edge computing can bring several benefits, such as:

  • Improved performance: It can be analyzed more quickly by processing data locally.
  • Enhanced security: Data is less vulnerable as it doesn’t travel long distances.
  • Scalability: It’s easier to expand the system as needed.


Read more –> Guide to LLM chatbots: Real-life applications

Data processing at the edge

In data science, edge computing is emerging as a pivotal force, enabling faster data processing directly at the source. This acceleration in data handling allows for realizing real-time insights and analytics previously hampered by latency issues.

Consequently, it requires solid knowledge of the field, either earned through experience or through the best data science course, fostering a more dynamic and responsive approach to data analysis, paving the way for innovations and advancements in various fields that rely heavily on data-driven insights.


Learn practical data science today!


Real-time analytics and insights

Edge computing revolutionizes business operations by facilitating instantaneous data analysis, allowing companies to glean critical insights in real-time. This swift data processing enables businesses to make well-informed decisions promptly, enhancing their agility and responsiveness in a fast-paced market.

Consequently, it empowers organizations to stay ahead, giving opportunities to their employees to learn PG in Data Science, optimize their strategies, and seize opportunities more effectively.

Enhancing data security and privacy

Edge computing enhances data security significantly by processing data closer to its generation point, thereby reducing the distance it needs to traverse.

This localized approach diminishes the opportunities for potential security breaches and data interceptions, ensuring a more secure and reliable data handling process. Consequently, it fosters a safer digital ecosystem where sensitive information is better shielded from unauthorized access and cyber threats.

Adoption rates in various regions

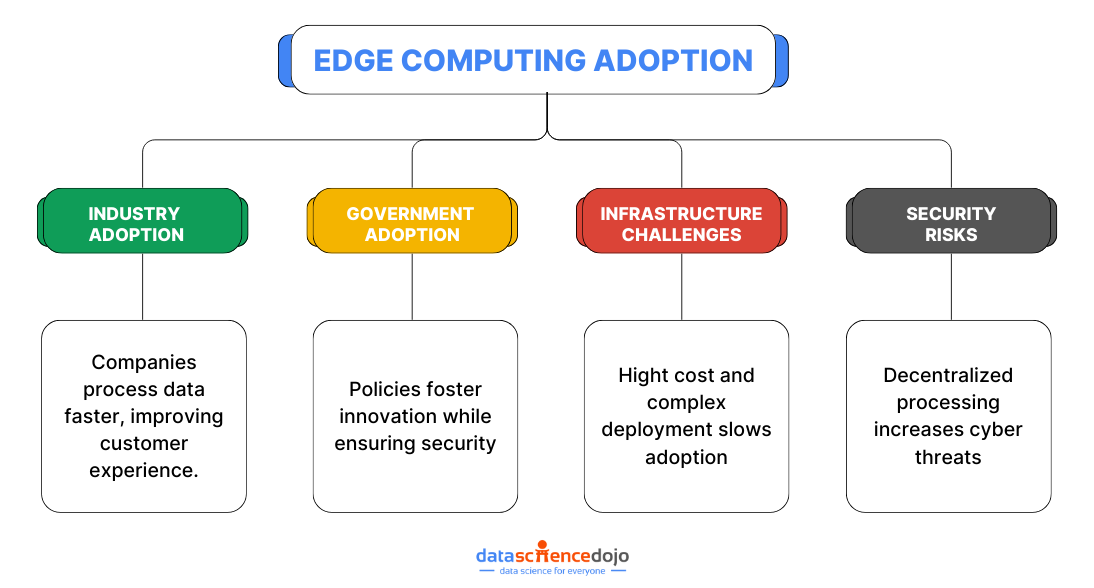
The adoption of edge computing is witnessing a varied pace across different regions globally. Developed nations, with their sophisticated infrastructure and technological advancements, are spearheading this transition, leveraging the benefits of edge computing to foster innovation and efficiency in various sectors.

This disparity in adoption rates underscores the pivotal role of robust infrastructure in harnessing the full potential of this burgeoning technology.

Successful implementations of edge computing

Across the globe, numerous companies are embracing the advantages of edge computing, integrating it into their operational frameworks to enhance efficiency and service delivery.

By processing data closer to the source, these firms can offer more responsive and personalized services to their customers, fostering improved customer satisfaction and potentially driving a competitive edge in their respective markets. This successful adoption showcases the tangible benefits and transformative potential of edge computing in the business landscape.

Government policies and regulations

Governments globally are actively fostering the growth of edge computing by formulating supportive policies and regulations. These initiatives are designed to facilitate the seamless integration of this technology into various sectors, promoting innovation and ensuring security and privacy standards are met.

Through such efforts, governments are catalyzing a conducive environment for the flourishing of edge computing, steering society towards a more connected and efficient future.

Infrastructure challenges

Despite its promising prospects, edge computing has its challenges, particularly concerning infrastructure development. Establishing the requisite infrastructure demands substantial investment in time and resources, posing a significant challenge. The process involves the installation of advanced hardware and the development of compatible software solutions, which can be both costly and time-intensive, potentially slowing the pace of its widespread adoption.

Security concerns

While edge computing brings numerous benefits, it raises security concerns, potentially opening up new avenues for cyber vulnerabilities. Data processing at multiple nodes instead of a centralized location might increase the risk of data breaches and unauthorized access. Therefore, robust security protocols will be paramount as edge computing evolves to safeguard sensitive information and maintain user trust.

Solutions and future directions

A collaborative approach between businesses and governments is emerging to navigate the complexities of implementing edge computing. Together, they craft strategies and policies that foster innovation while addressing potential hurdles such as security concerns and infrastructure development.

This united front is instrumental in shaping a conducive environment for the seamless integration and growth of edge computing in the coming years.

Healthcare sector

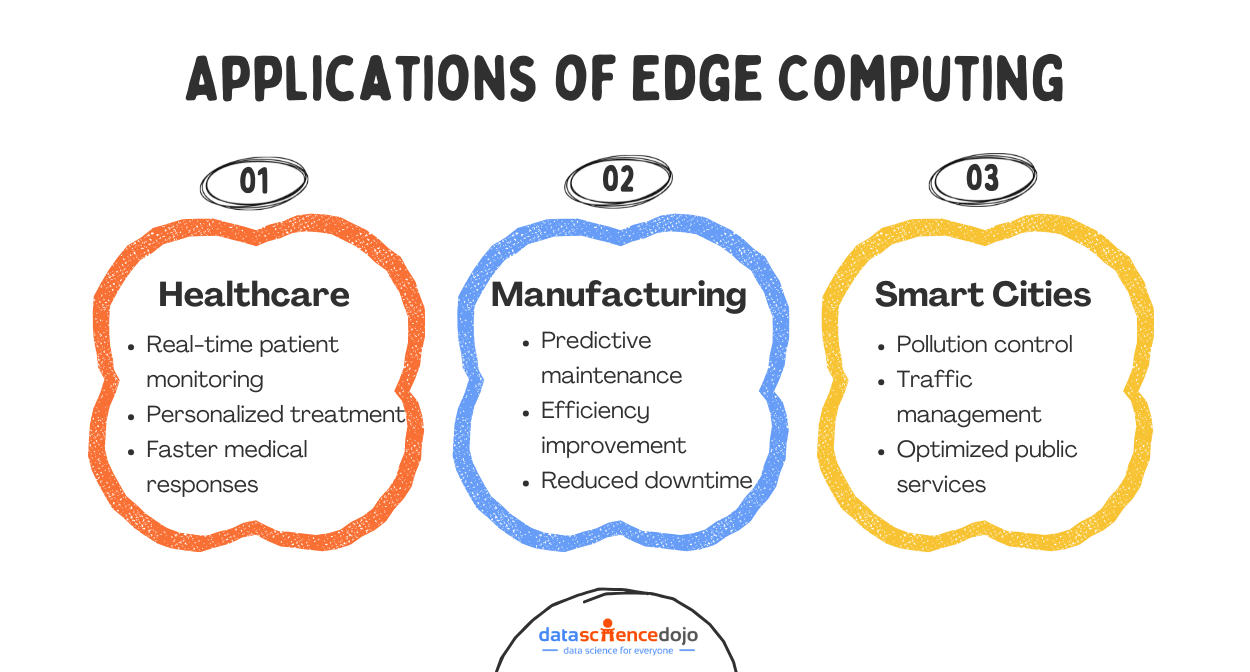
In healthcare, computing is becoming a cornerstone for advancing patient care. It facilitates real-time monitoring and swift data analysis, providing timely interventions and personalized treatment plans. This enhances the accuracy and efficacy of healthcare services and potentially saves lives by enabling quicker responses in critical situations.

Manufacturing industry

In the manufacturing sector, it is vital to streamlining and enhancing production lines. By enabling real-time data analysis directly on the factory floor, it assists in fine-tuning processes, minimizing downtime, and predicting maintenance needs before they become critical issues.

Consequently, it fosters a more agile, efficient, and productive manufacturing environment, paving the way for heightened productivity and reduced operational costs.

Smart cities

Smart cities envisioned as the epitome of urban innovation, are increasingly harnessing the power of edge computing to revolutionize their operations. By processing data in affinity to its source, edge computing facilitates real-time responses, enabling cities to manage traffic flows, thereby reducing congestion and commute times.

Furthermore, it aids in deploying advanced sensors that monitor and mitigate pollution levels, ensuring cleaner urban environments. Beyond these, edge computing also streamlines public services, from waste management to energy distribution, ensuring they are more efficient, responsive, and tailored to the dynamic needs of urban populations.

Integration with IoT and 5G

As we venture forward, edge computing is slated to meld seamlessly with burgeoning technologies like the Internet of Things (IoT) and 5G networks. This integration is anticipated to unlock many benefits, including lightning-fast data transmission, enhanced connectivity, and the facilitation of real-time analytics.

Consequently, this amalgamation is expected to catalyze a new era of technological innovation, fostering a more interconnected and efficient world.


Read more –> IoT | New trainings at Data Science Dojo


Role in Artificial Intelligence and Machine Learning


Edge computing stands poised to be a linchpin in the revolution of artificial intelligence (AI) and machine learning (ML). Facilitating faster data processing and analysis at the source will empower these technologies to function more efficiently and effectively. This synergy promises to accelerate advancements in AI and ML, fostering innovations that could reshape industries and redefine modern convenience.

Predictions for the next decade

In the forthcoming decade, the ubiquity of edge computing is set to redefine our interaction with data fundamentally. This technology, by decentralizing data processing and bringing it closer to the source, promises swifter data analysis and enhanced security and efficiency.

As it integrates seamlessly with burgeoning technologies like IoT and 5G, we anticipate a transformative impact on various sectors, including healthcare, manufacturing, and urban development. This shift towards edge computing signifies a monumental leap towards a future where real-time insights and connectivity are not just luxuries but integral components of daily life, facilitating more intelligent living and streamlined operations in numerous facets of society.

Conclusion

Edge computing is shaping up to be a significant player in the international data science trends. As we have seen, it offers many benefits, including faster data processing, improved security, and the potential to revolutionize industries like healthcare, manufacturing, and urban planning. As we look to the future, the prospects for edge computing seem bright, promising a new frontier in the world of technology.

Remember, the world of technology is ever-changing, and staying informed is the key to staying ahead. So, keep exploring data science courses, keep learning, and keep growing!


Register today

Ali Haider - Author
Ali Haider Shalwani
| October 8

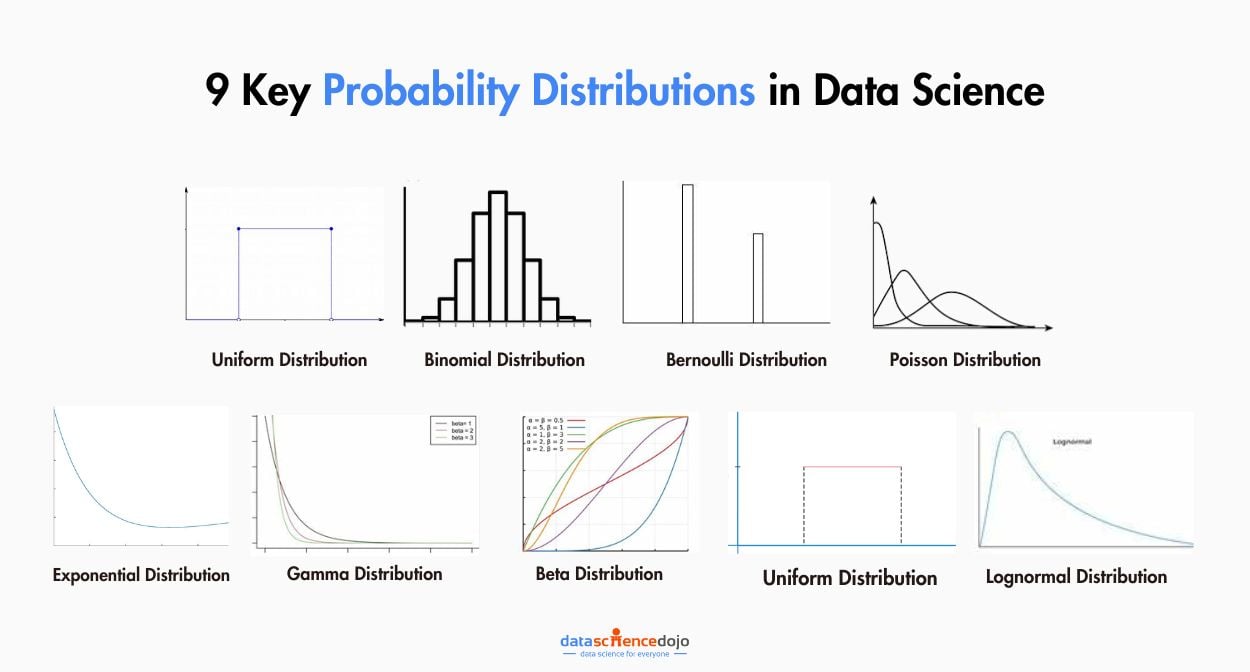
In the realm of data science, understanding probability distributions is crucial. They provide a mathematical framework for modeling and analyzing data.  


Understand the applications of probability in data science with this blog.  

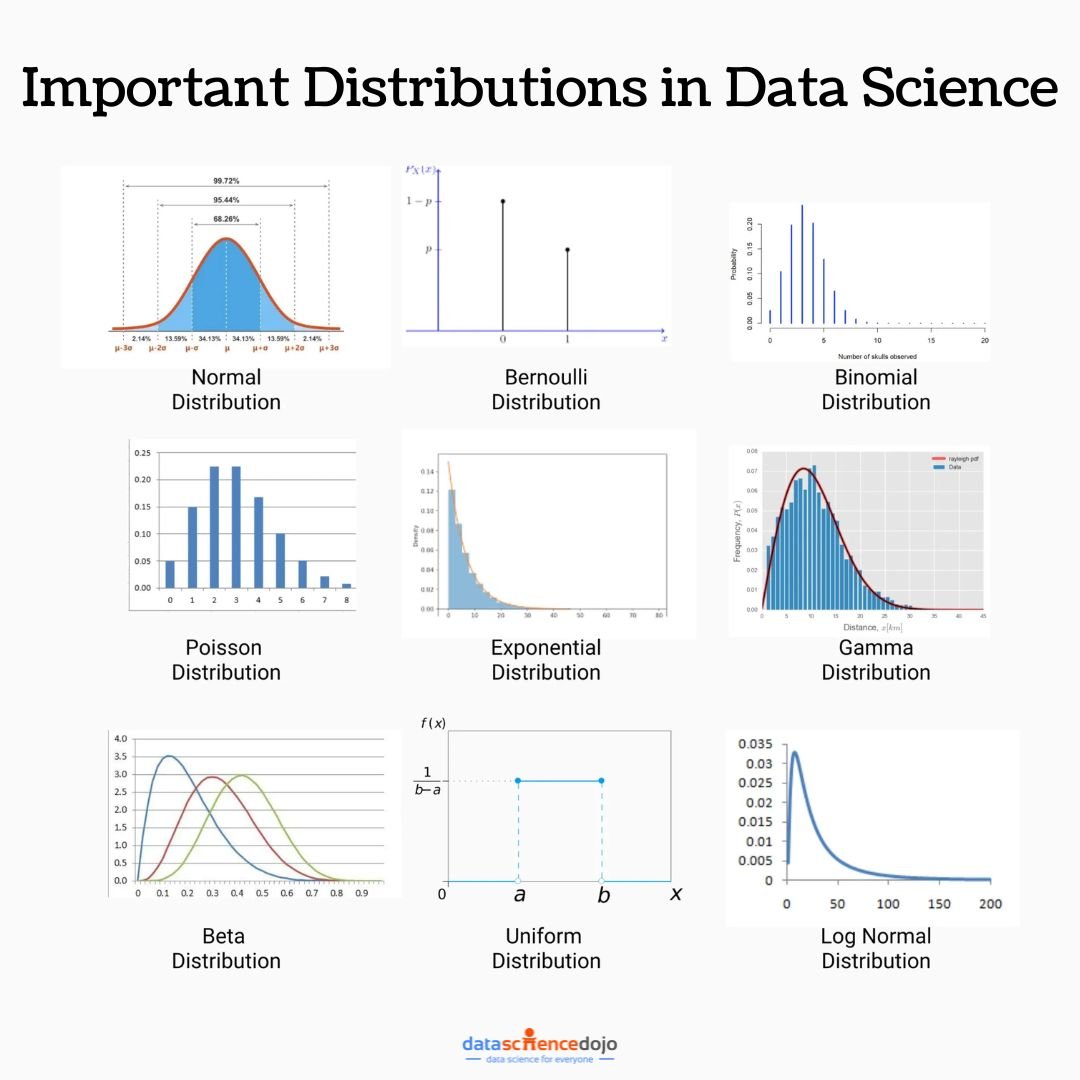
9 probability distributions in data science
9 probability distributions in data science – Data Science Dojo


Explore probability distributions in data science with practical applications

This blog explores nine important data science distributions and their practical applications. 


1. Normal distribution

The normal distribution, characterized by its bell-shaped curve, is prevalent in various natural phenomena. For instance, IQ scores in a population tend to follow a normal distribution. This allows psychologists and educators to understand the distribution of intelligence levels and make informed decisions regarding education programs and interventions.  

Heights of adult males in a given population often exhibit a normal distribution. In such a scenario, most men tend to cluster around the average height, with fewer individuals being exceptionally tall or short. This means that the majority fall within one standard deviation of the mean, while a smaller percentage deviates further from the average. 


2. Bernoulli distribution

The Bernoulli distribution models a random variable with two possible outcomes: success or failure. Consider a scenario where a coin is tossed. Here, the outcome can be either a head (success) or a tail (failure). This distribution finds application in various fields, including quality control, where it’s used to assess whether a product meets a specific quality standard. 

When flipping a fair coin, the outcome of each flip can be modeled using a Bernoulli distribution. This distribution is aptly suited as it accounts for only two possible results – heads or tails. The probability of success (getting a head) is 0.5, making it a fundamental model for simple binary events. 


Learn practical data science today!


3. Binomial distribution

The binomial distribution describes the number of successes in a fixed number of Bernoulli trials. Imagine conducting 10 coin flips and counting the number of heads. This scenario follows a binomial distribution. In practice, this distribution is used in fields like manufacturing, where it helps in estimating the probability of defects in a batch of products. 

Imagine a basketball player with a 70% free throw success rate. If this player attempts 10 free throws, the number of successful shots follows a binomial distribution. This distribution allows us to calculate the probability of making a specific number of successful shots out of the total attempts. 


4. Poisson distribution

The Poisson distribution models the number of events occurring in a fixed interval of time or space, assuming a constant rate. For example, in a call center, the number of calls received in an hour can often be modeled using a Poisson distribution. This information is crucial for optimizing staffing levels to meet customer demands efficiently. 

In the context of a call center, the number of incoming calls over a given period can often be modeled using a Poisson distribution. This distribution is applicable when events occur randomly and are relatively rare, like calls to a hotline or requests for customer service during specific hours. 


5. Exponential distribution

The exponential distribution represents the time until a continuous, random event occurs. In the context of reliability engineering, this distribution is employed to model the lifespan of a device or system before it fails. This information aids in maintenance planning and ensuring uninterrupted operation. 

The time intervals between successive earthquakes in a certain region can be accurately modeled by an exponential distribution. This is especially true when these events occur randomly over time, but the probability of them happening in a particular time frame is constant. 


6. Gamma distribution

The gamma distribution extends the concept of the exponential distribution to model the sum of k independent exponential random variables. This distribution is used in various domains, including queuing theory, where it helps in understanding waiting times in systems with multiple stages. 

Consider a scenario where customers arrive at a service point following a Poisson process, and the time it takes to serve them follows an exponential distribution. In this case, the total waiting time for a certain number of customers can be accurately described using a gamma distribution. This is particularly relevant for modeling queues and wait times in various service industries. 


7. Beta distribution

The beta distribution is a continuous probability distribution bound between 0 and 1. It’s widely used in Bayesian statistics to model probabilities and proportions. In marketing, for instance, it can be applied to optimize conversion rates on a website, allowing businesses to make data-driven decisions to enhance user experience. 

In the realm of A/B testing, the conversion rate of users interacting with two different versions of a webpage or product is often modeled using a beta distribution. This distribution allows analysts to estimate the uncertainty associated with conversion rates and make informed decisions regarding which version to implement. 


8. Uniform distribution

In a uniform distribution, all outcomes have an equal probability of occurring. A classic example is rolling a fair six-sided die. In simulations and games, the uniform distribution is used to model random events where each outcome is equally likely. 

When rolling a fair six-sided die, each outcome (1 through 6) has an equal probability of occurring. This characteristic makes it a prime example of a discrete uniform distribution, where each possible outcome has the same likelihood of happening. 


9. Log normal distribution

The log normal distribution describes a random variable whose logarithm is normally distributed. In finance, this distribution is applied to model the prices of financial assets, such as stocks. Understanding the log normal distribution is crucial for making informed investment decisions. 

The distribution of wealth among individuals in an economy often follows a log-normal distribution. This means that when the logarithm of wealth is considered, the resulting values tend to cluster around a central point, reflecting the skewed nature of wealth distribution in many societies. 


Get started with your data science learning journey with our instructor-led live bootcamp. Explore now 


Learn probability distributions today! 

Understanding these distributions and their applications empowers data scientists to make informed decisions and build accurate models. Remember, the choice of distribution greatly impacts the interpretation of results, so it’s a critical aspect of data analysis. 

Delve deeper into probability with this short tutorial 


Ali Haider - Author
Ali Haider Shalwani
| September 26

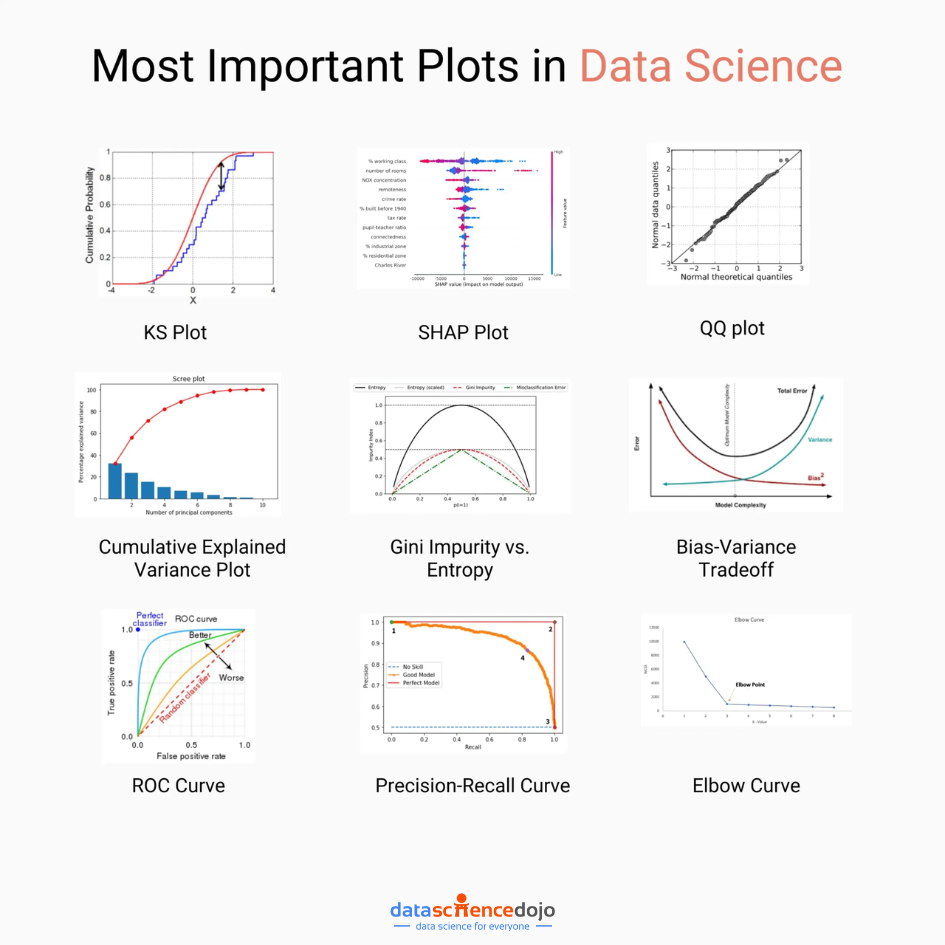
Plots in data science play a pivotal role in unraveling complex insights from data. They serve as a bridge between raw numbers and actionable insights, aiding in the understanding and interpretation of datasets. Learn about 33 tools to visualize data with this blog 

In this blog post, we will delve into some of the most important plots and concepts that are indispensable for any data scientist. 

data science plots
9 Data Science Plots – Data Science Dojo


1. KS Plot (Kolmogorov-Smirnov Plot):

The KS Plot is a powerful tool for comparing two probability distributions. It measures the maximum vertical distance between the cumulative distribution functions (CDFs) of two datasets. This plot is particularly useful for tasks like hypothesis testing, anomaly detection, and model evaluation.

Suppose you are a data scientist working for an e-commerce company. You want to compare the distribution of purchase amounts for two different marketing campaigns. By using a KS Plot, you can visually assess if there’s a significant difference in the distributions. This insight can guide future marketing strategies.

2. SHAP Plot:

SHAP plots offer an in-depth understanding of the importance of features in a predictive model. They provide a comprehensive view of how each feature contributes to the model’s output for a specific prediction. SHAP values help answer questions like, “Which features influence the prediction the most?”

Imagine you’re working on a loan approval model for a bank. You use a SHAP plot to explain to stakeholders why a certain applicant’s loan was approved or denied. The plot highlights the contribution of each feature (e.g., credit score, income) in the decision, providing transparency and aiding in compliance.

3. QQ plot:

The QQ plot is a visual tool for comparing two probability distributions. It plots the quantiles of the two distributions against each other, helping to assess whether they follow the same distribution. This is especially valuable in identifying deviations from normality.

In a medical study, you want to check if a new drug’s effect on blood pressure follows a normal distribution. Using a QQ Plot, you compare the observed distribution of blood pressure readings post-treatment with an expected normal distribution. This helps in assessing the drug’s effectiveness. 

Large language model bootcamp


4. Cumulative explained variance plot:

In the context of Principal Component Analysis (PCA), this plot showcases the cumulative proportion of variance explained by each principal component. It aids in understanding how many principal components are required to retain a certain percentage of the total variance in the dataset.

Let’s say you’re working on a face recognition system using PCA. The cumulative explained variance plot helps you decide how many principal components to retain to achieve a desired level of image reconstruction accuracy while minimizing computational resources. 

Explore, analyze, and visualize data using Power BI Desktop to make data-driven business decisions. Check out our Introduction to Power BI cohort. 

5. Gini Impurity vs. Entropy:

These plots are critical in the field of decision trees and ensemble learning. They depict the impurity measures at different decision points. Gini impurity is faster to compute, while entropy provides a more balanced split. The choice between the two depends on the specific use case.

Suppose you’re building a decision tree to classify customer feedback as positive or negative. By comparing Gini impurity and entropy at different decision nodes, you can decide which impurity measure leads to a more effective splitting strategy for creating meaningful leaf nodes.

6. Bias-Variance tradeoff:

Understanding the tradeoff between bias and variance is fundamental in machine learning. This concept is often visualized as a curve, showing how the total error of a model is influenced by its bias and variance. Striking the right balance is crucial for building models that generalize well.

Imagine you’re training a model to predict housing prices. If you choose a complex model (e.g., deep neural network) with many parameters, it might overfit the training data (high variance). On the other hand, if you choose a simple model (e.g., linear regression), it might underfit (high bias). Understanding this tradeoff helps in model selection. 

7. ROC curve:

The ROC curve is a staple in binary classification tasks. It illustrates the tradeoff between the true positive rate (sensitivity) and false positive rate (1 – specificity) for different threshold values. The area under the ROC curve (AUC-ROC) quantifies the model’s performance.

In a medical context, you’re developing a model to detect a rare disease. The ROC curve helps you choose an appropriate threshold for classifying individuals as positive or negative for the disease. This decision is crucial as false positives and false negatives can have significant consequences. 

Want to get started with data science? Check out our instructor-led live Data Science Bootcamp 

8. Precision-Recall curve:

Especially useful when dealing with imbalanced datasets, the precision-recall curve showcases the tradeoff between precision and recall for different threshold values. It provides insights into a model’s performance, particularly in scenarios where false positives are costly.

Let’s say you’re working on a fraud detection system for a bank. In this scenario, correctly identifying fraudulent transactions (high recall) is more critical than minimizing false alarms (low precision). A precision-recall curve helps you find the right balance.

9. Elbow curve:

In unsupervised learning, particularly clustering, the elbow curve aids in determining the optimal number of clusters for a dataset. It plots the variance explained as a function of the number of clusters. The “elbow point” is a good indicator of the ideal cluster count.

You’re tasked with clustering customer data for a marketing campaign. By using an elbow curve, you can determine the optimal number of customer segments. This insight informs personalized marketing strategies and improves customer engagement. 


Improvise your models today with plots in data science! 

These plots in data science are the backbone of your data. Incorporating them into your analytical toolkit will empower you to extract meaningful insights, build robust models, and make informed decisions from your data. Remember, visualizations are not just pretty pictures; they are powerful tools for understanding the underlying stories within your data. 


Check out this crash course in data visualization, it will help you gain great insights so that you become a data visualization pro: 


author image austin
Austin Gendron
| September 21

Imagine you’re a data scientist or a developer, and you’re about to embark on a new project. You’re excited, but there’s a problem – you need data, lots of it, and from various sources. You could spend hours, days, or even weeks scraping websites, cleaning data, and setting up databases.

Or you could use APIs and get all the data you need in a fraction of the time. Sounds like a dream, right? Well, it’s not. Welcome to the world of APIs! 

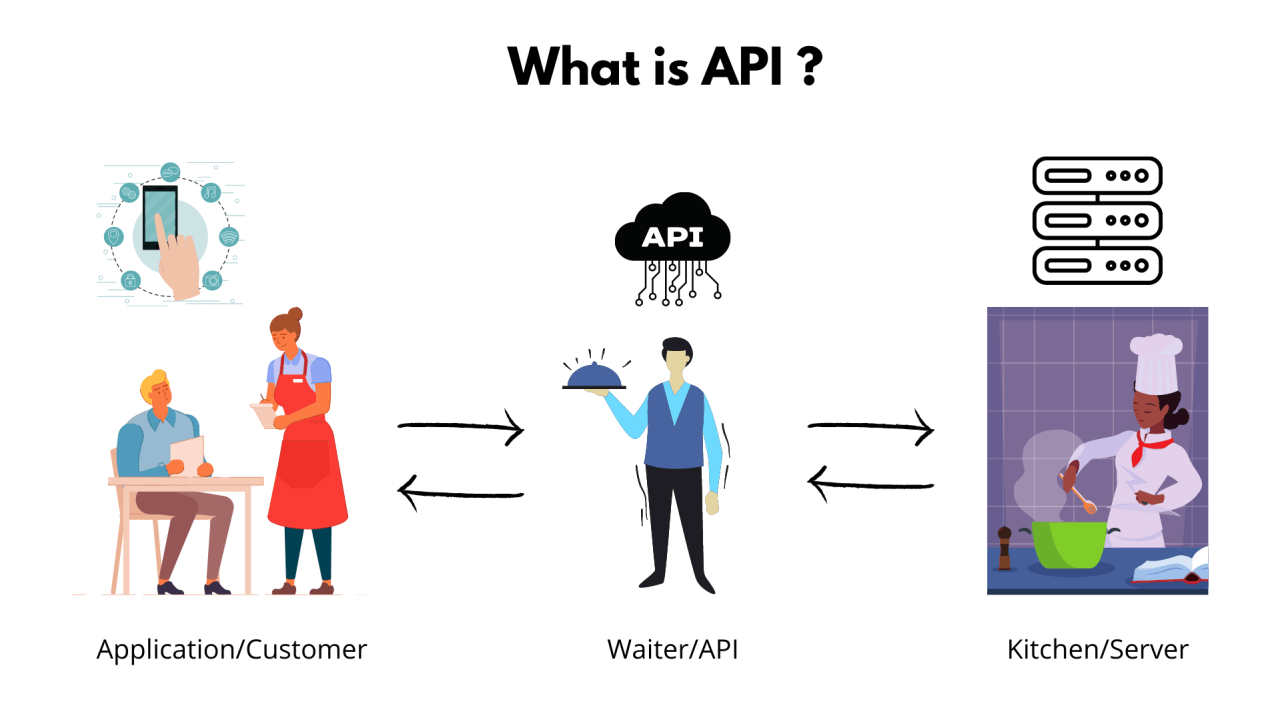
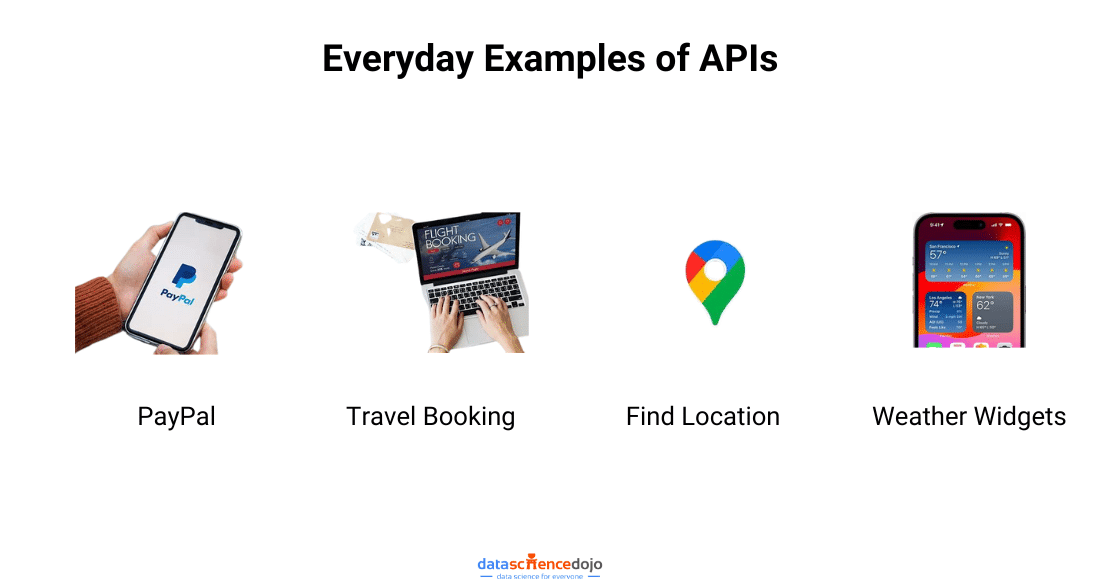
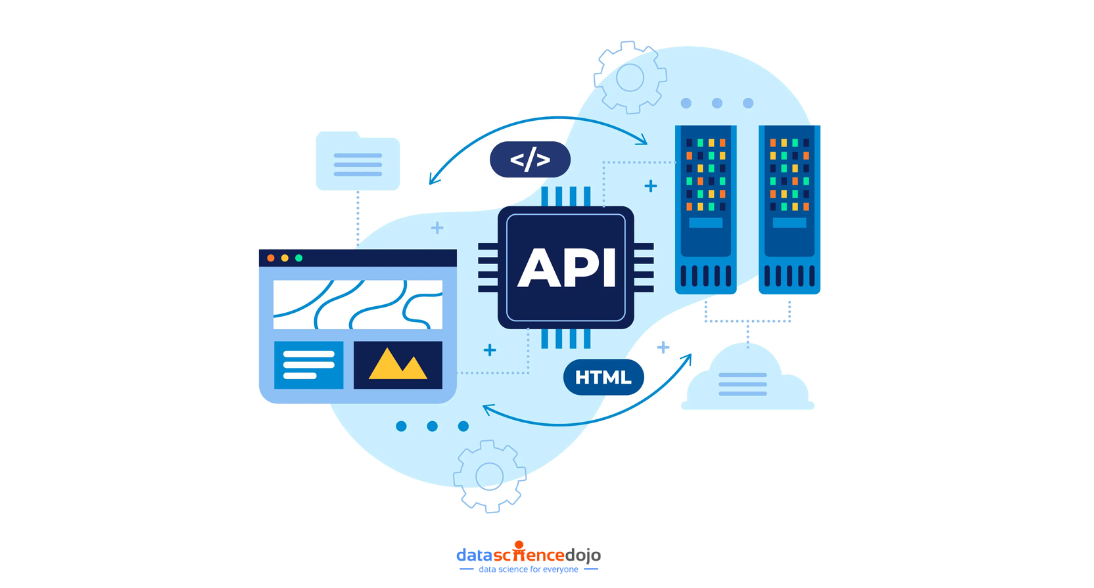
Application Programming Interfaces are like secret tunnels that connect different software applications, allowing them to communicate and share data with each other. They are the unsung heroes of the digital world, quietly powering the apps and services we use every day.


Learn in detail about –> RestAPI


For data scientists, these are not just convenient; they are also a valuable source of untapped data. 

Let’s dive into three powerful APIs that will not only make your life easier but also take your data science projects to the next level. 


Master 3 APIs
Master 3 APIs – Data Science Dojo

RapidAPI – The ultimate API marketplace 

Now, imagine walking into a supermarket, but instead of groceries, the shelves are filled with APIs. That’s RapidAPI for you! It’s a one-stop-shop where you can find, connect, and manage thousands of APIs across various categories. 

Learn more details about RapidAPI:

  • RapidAPI is a platform that provides access to a wide range of APIs. It offers both free and premium APIs.
  • RapidAPI simplifies API integration by providing a single dashboard to manage multiple APIs.
  • Developers can use RapidAPI to access APIs for various purposes, such as data retrieval, payment processing, and more.
  • It offers features like Application Programming Interfaces key management, analytics, and documentation.
  • RapidAPI is a valuable resource for developers looking to enhance their applications with third-party services.

Toolstack 

All you need is an HTTP client like Postman or a library in your favorite programming language (Python’s requests, JavaScript’s fetch, etc.), and a RapidAPI account. 


Read more about the basics of APIs


Steps to manage the project 

  • Identify: Think of it as window shopping. Browse through the RapidAPI marketplace and find the API that fits your needs. 
  • Subscribe: Just like buying a product, some APIs are free, while others require a subscription. 
  • Integrate: Now, it’s time to bring your purchase home. Use the provided code snippets to integrate the Application Programming Interfaces into your application. 
  • Test: Make sure your new Application Programming Interfaces works well with your application. 
  • Monitor: Keep an eye on your API’s usage and performance using RapidAPI’s dashboard. 

Use cases 

  • Sentiment analysis: Analyze social media posts or customer reviews to understand public sentiment about a product or service. 
  • Stock market predictions: Predict future stock market trends by analyzing historical stock prices. 
  • Image recognition: Build an image recognition system that can identify objects in images. 


Tomorrow.io Weather API – Your personal weather station 

Ever wished you could predict the weather? With the Tomorrow.io Weather API, you can do just that and more! It provides access to real-time, forecast, and historical weather data, offering over 60 different weather data fields. 

Here are some other details about Tomorrow.io Weather API:

  • Tomorrow.io (formerly known as ClimaCell) Weather API provides weather data and forecasts for developers.
  • It offers hyper-local weather information, including minute-by-minute precipitation forecasts.
  • Developers can access weather data such as current conditions, hourly and daily forecasts, and severe weather alerts.
  • The API is often used in applications that require accurate and up-to-date weather information, including weather apps, travel apps, and outdoor activity planners.
  • Integration with Tomorrow.io Weather API can help users stay informed about changing weather conditions.


Toolstack 

You’ll need an HTTP client to make requests, a JSON parser to handle the response, and a Tomorrow.io account to get your Application Programming Interface key. 

Steps to manage the project 

  • Register: Sign up for a Tomorrow.io account and get your personal API key. 
  • Make a Request: Use your key to ask the Tomorrow.io Weather API for the weather data you need. 
  • Parse the Response: The Application Programming Interface will send back data in JSON format, which you’ll need to parse to extract the information you need. 
  • Integrate the Data: Now, you can integrate the weather data into your application or model. 

Use cases 

  • Weather forecasting: Build your own weather forecasting application. 
  • Climate research: Study climate change patterns using historical weather data. 
  • Agricultural planning: Help farmers plan their planting and harvesting schedules based on weather forecasts. 

Google Maps API – The world at your fingertips 

The Google Maps API is like having a personal tour guide that knows every nook and cranny of the world. It provides access to a wealth of geographical and location-based data, including maps, geocoding, places, routes, and more. 

Below are some key details about Google Maps API:

  • Google Maps API is a suite of APIs provided by Google for integrating maps and location-based services into applications.
  • Developers can use Google Maps APIs to embed maps, find locations, calculate directions, and more in their websites and applications.
  • Some of the popular Google Maps APIs include Maps JavaScript, Places, and Geocoding.
  • To use Google Maps APIs, developers need to obtain an API key from the Google Cloud Platform Console.
  • These Application Programming Interfaces are commonly used in web and mobile applications to provide users with location-based information and navigation


Toolstack 

You’ll need an HTTP client, a JSON parser, and a Google Cloud account to get your API key. 

Steps to manage the project 

  • Get an API Key: Sign up for a Google Cloud account and enable the Google Maps API to get your key. 
  • Make a Request: Use your Application Programming Interface key to ask the Google Maps API for the geographical data you need. 
  • Handle the Response: The API will send back data in JSON format, which you’ll need to parse to extract the information you need. 
  • Use the Data: Now, you can integrate the geographical data into your application or model. 

Use cases 

  • Location-Based services: Build applications that offer services based on the user’s location. 
  • Route planning: Help users find the best routes between multiple destinations. 
  • Local business search: Help users find local businesses based on their queries. 

Your challenge – Create your own data-driven project 

Now that you’re equipped with the knowledge of these powerful APIs, it’s time to put that knowledge into action. We challenge you to create your own data-driven project using one or more of these. 

Perhaps you could build a weather forecasting app that helps users plan their outdoor activities using the Tomorrow.io Weather API. Or maybe you could create a local business search tool using the Google Maps API.

You could even combine Application Programming Interfaces to create something unique, like a sentiment analysis tool that uses the RapidAPI marketplace to analyze social media reactions to different weather conditions. 

Remember, the goal here is not just to build something but to learn and grow as a data scientist or developer. Don’t be afraid to experiment, make mistakes, and learn from them. That’s how you truly master a skill. 

So, are you ready to take on the challenge? We can’t wait to see what you’ll create. Remember, the only limit is your imagination. Good luck! 

Improve your data science project efficiency with APIs 

In conclusion, APIs are like magic keys that unlock a world of data for your projects. By mastering these three Application Programming Interfaces, you’ll not only save time but also uncover insights that can make your projects shine. So, what are you waiting for? Start the challenge now by exploring these. Experience the full potential of data science with us. 


Data Science Dojo
Erika Balla
| August 30

The crux of any business operation lies in the judicious interpretation of data, extracting meaningful insights, and implementing strategic actions based on these insights. In the modern digital era, this particular area has evolved to give rise to a discipline known as Data Science.

Data Science offers a comprehensive and systematic approach to extracting actionable insights from complex and unstructured data. It is at the forefront of artificial intelligence, driving the decision-making process of businesses, governments, and organizations worldwide. 

Applied Data Science

However, Applied Data Science, a subset of Data Science, offers a more practical and industry-specific approach. It directly focuses on implementing scientific methods and algorithms to solve real-world business problems and is a key player in transforming raw data into significant and actionable business insights.

But what are the key concepts and methodologies involved in Applied Data Science? Let’s dive deep to unravel these facets.   


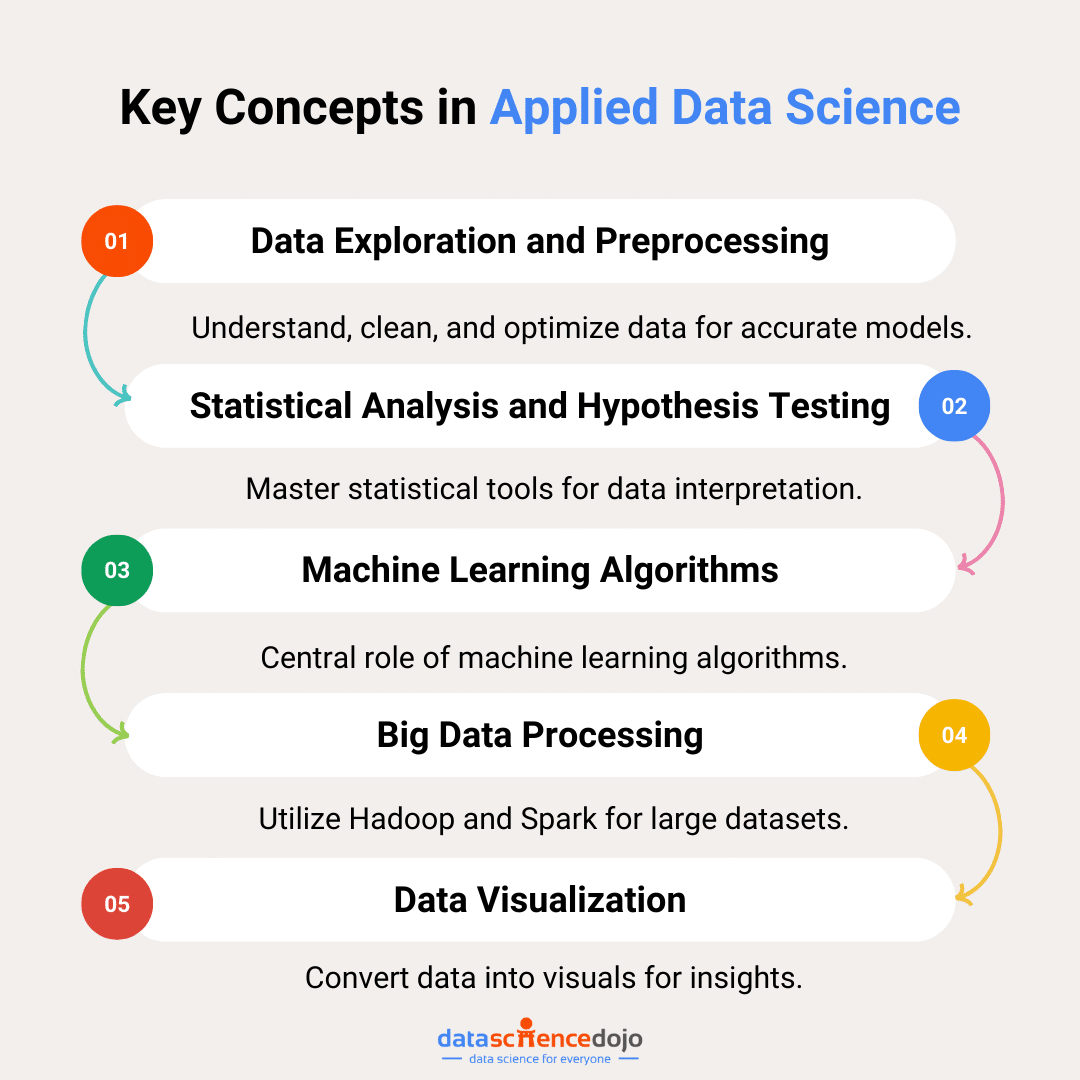
Key concepts of applied data science


1. Data exploration and preprocessing

An essential aspect of the Applied Data Science journey begins with data exploration and preprocessing. This stage involves understanding the data’s nature, cleaning the data by dealing with missing values and outliers, and transforming it to ensure its readiness for further processing. The preprocessing phase helps to improve the accuracy and efficiency of the models developed in the later stages. 

2. Statistical analysis and hypothesis testing

Statistical methods provide powerful tools for understanding data. An Applied Data Scientist must have a solid understanding of statistics to interpret data correctly. Hypothesis testing, correlation, and regression analysis, and distribution analysis are some of the essential statistical tools that data scientists use. 

3. Machine learning algorithms

Machine learning forms the core of Applied Data Science. It leverages algorithms to parse data, learn from it, and make predictions or decisions without being explicitly programmed. From decision trees and neural networks to regression models and clustering algorithms, a variety of techniques come under the umbrella of machine learning. 

4. Big data processing

With the increasing volume of data, big data technologies have become indispensable for Applied Data Science. Technologies like Hadoop and Spark enable the processing and analysis of massive datasets in a distributed and parallel manner. 

5. Data visualization

Data visualization is the artwork of illustrating complicated facts in a graphical or pictorial format. This makes the data easier to understand and allows business stakeholders to identify patterns and trends that might go unnoticed in text-based data.   

Key Concepts of Applied Data Science


Read more –> 33 ways to stunning data visualization


Methodologies of applied data science

1. CRISP-DM methodology

Cross-Industry Standard Process for Data Mining (CRISP-DM) is a commonly used methodology in Applied Data Science. It consists of six phases: business understanding, data understanding, data preparation, modeling, evaluation, and deployment.

2. OSEMN framework

The OSEMN (Obtain, Scrub, Explore, Model, and Interpret) framework provides another structured approach to tackling data science problems. It ensures a streamlined workflow, from acquiring data to presenting insights.

3. Agile methodology

The Agile methodology emphasizes iterative progress, collaboration, and responsiveness to change. Its implementation in Applied Data Science allows data science teams to adapt swiftly to changing requirements and deliver results in incremental phases. 

As the world evolves increasingly data-driven, the demand for professional Applied Data Scientists is rising. A well-rounded Applied Data Science Program can equip you with the necessary knowledge and hands-on experience to excel in this rapidly evolving field. It can help you understand these concepts and methodologies in-depth and provide an opportunity to work on real-world data science projects. 

Furthermore, it is essential to consistently acquire knowledge and stay up-to-date with the most recent developments in the industry. Continuous Data Science Training can offer a fantastic opportunity to continuously enhance your abilities and remain pertinent in the employment market. These programs can provide a more profound understanding of both the theoretical and applied aspects of Data Science and its diverse fields. 


Large language model bootcamp

Advancements in applied data science

Applied Data Science is not a static field. It constantly evolves to incorporate new technologies and methodologies. In recent years, we’ve seen several advancements that have significantly impacted the discipline. 

1. Deep learning

Deep learning, a subset of machine learning, has been a game-changer in lots of industries. It is a way of implementing and training neural networks that are inspired by the human brain’s workings. These neural networks can process large amounts of data and identify patterns and correlations. In Applied Data Science, deep learning has been a critical factor in advancing complex tasks like natural language processing, image recognition, and recommendation systems.

2. Automated Machine Learning (AutoML)

AutoML is an exciting advancement in the field of Applied Data Science. It refers to the automated process of applying machine learning to real-world problems. AutoML covers the complete pipeline from raw data to deployable models, automating data pre-processing, feature engineering, model selection, and hyperparameter tuning. This significantly reduces the time and effort required by data scientists and also democratizes machine learning by making it accessible to non-experts.

3. Reinforcement learning

Reinforcement learning, an alternative type of machine learning, centers on determining how an agent should act within an environment in order to optimize a cumulative reward. This method is applied in diverse fields, ranging from gaming and robotics to recommendation systems and advertising. The agent acquires the ability to accomplish a goal in an uncertain, possibly intricate environment. 

To stay abreast of these progressions and consistently enhance your expertise, engaging in an ongoing Data Science Course is essential. Such a course can offer a greater profound knowledge of both the theoretical and practical aspects of Data Science and its growing domains. 

Conclusion: Future of applied data science

Applied Data Science has drastically transformed the way businesses operate and make decisions. With advancements in technologies and methodologies, the field continues to push the boundaries of what is possible with data.  

However, mastering Applied Data Science requires a systematic understanding of its key concepts and methodologies. Enrolling in an Applied Data Science Program can help you comprehend these in-depth and provide hands-on experience with real-world data science projects.  

The role of Applied Data Science is only set to expand in the future. It will retain to revolutionize sectors like finance, healthcare, and entertainment, transportation, to name a few. In this light, gaining proficiency in Applied Data Science can pave the way for rewarding and impactful career opportunities. As we increasingly rely on data to drive our decisions, the significance of Applied Data Science will only continue to grow.  

To wrap up, Applied Data Science is a perfect blend of technology, mathematics, and business insight, driving innovation and growth. It offers a promising avenue for individuals looking to make a difference with data. It’s an exciting time to delve into Applied Data Science – a field where curiosity meets technology and data to shape the future. 


Register today

Data Science Dojo
Fiza Fatima
| August 15

Explore the lucrative world of data science careers. Learn about factors influencing data scientist salaries, industry demand, and how to prepare for a high-paying role.

Data scientists are in high demand in today’s tech-driven world. They are responsible for collecting, analyzing, and interpreting large amounts of data to help businesses make better decisions. As the amount of data continues to grow, the demand for data scientists is expected to increase even further. 

According to the US Bureau of Labor Statistics, the demand for data scientists is projected to grow 36% from 2021 to 2031, much faster than the average for all occupations. This growth is being driven by the increasing use of data in a variety of industries, including healthcare, finance, retail, and manufacturing. 

Earning Insights Data Scientist Salaries
Earning Insights Data Scientist Salaries – Source: Freepik

Factors Shaping Data Scientist Salaries 

There are a number of factors that can impact the salary of a data scientist, including: 

  • Geographic location: Data scientists in major tech hubs like San Francisco and New York City tend to earn higher salaries than those in other parts of the country. 
  • Experience: Data scientists with more experience typically earn higher salaries than those with less experience. 
  • Education: Data scientists with advanced degrees, such as a master’s or Ph.D., tend to earn higher salaries than those with a bachelor’s degree. 

Large language model bootcamp

  • Industry: Data scientists working in certain industries, such as finance and healthcare, tend to earn higher salaries than those working in other industries. 
  • Job title and responsibilities: The salary for a data scientist can vary depending on the job title and the specific responsibilities of the role. For example, a senior data scientist with a lot of experience will typically earn more than an entry-level data scientist. 

Data Scientist Salaries in 2023 

Data Scientists Salaries

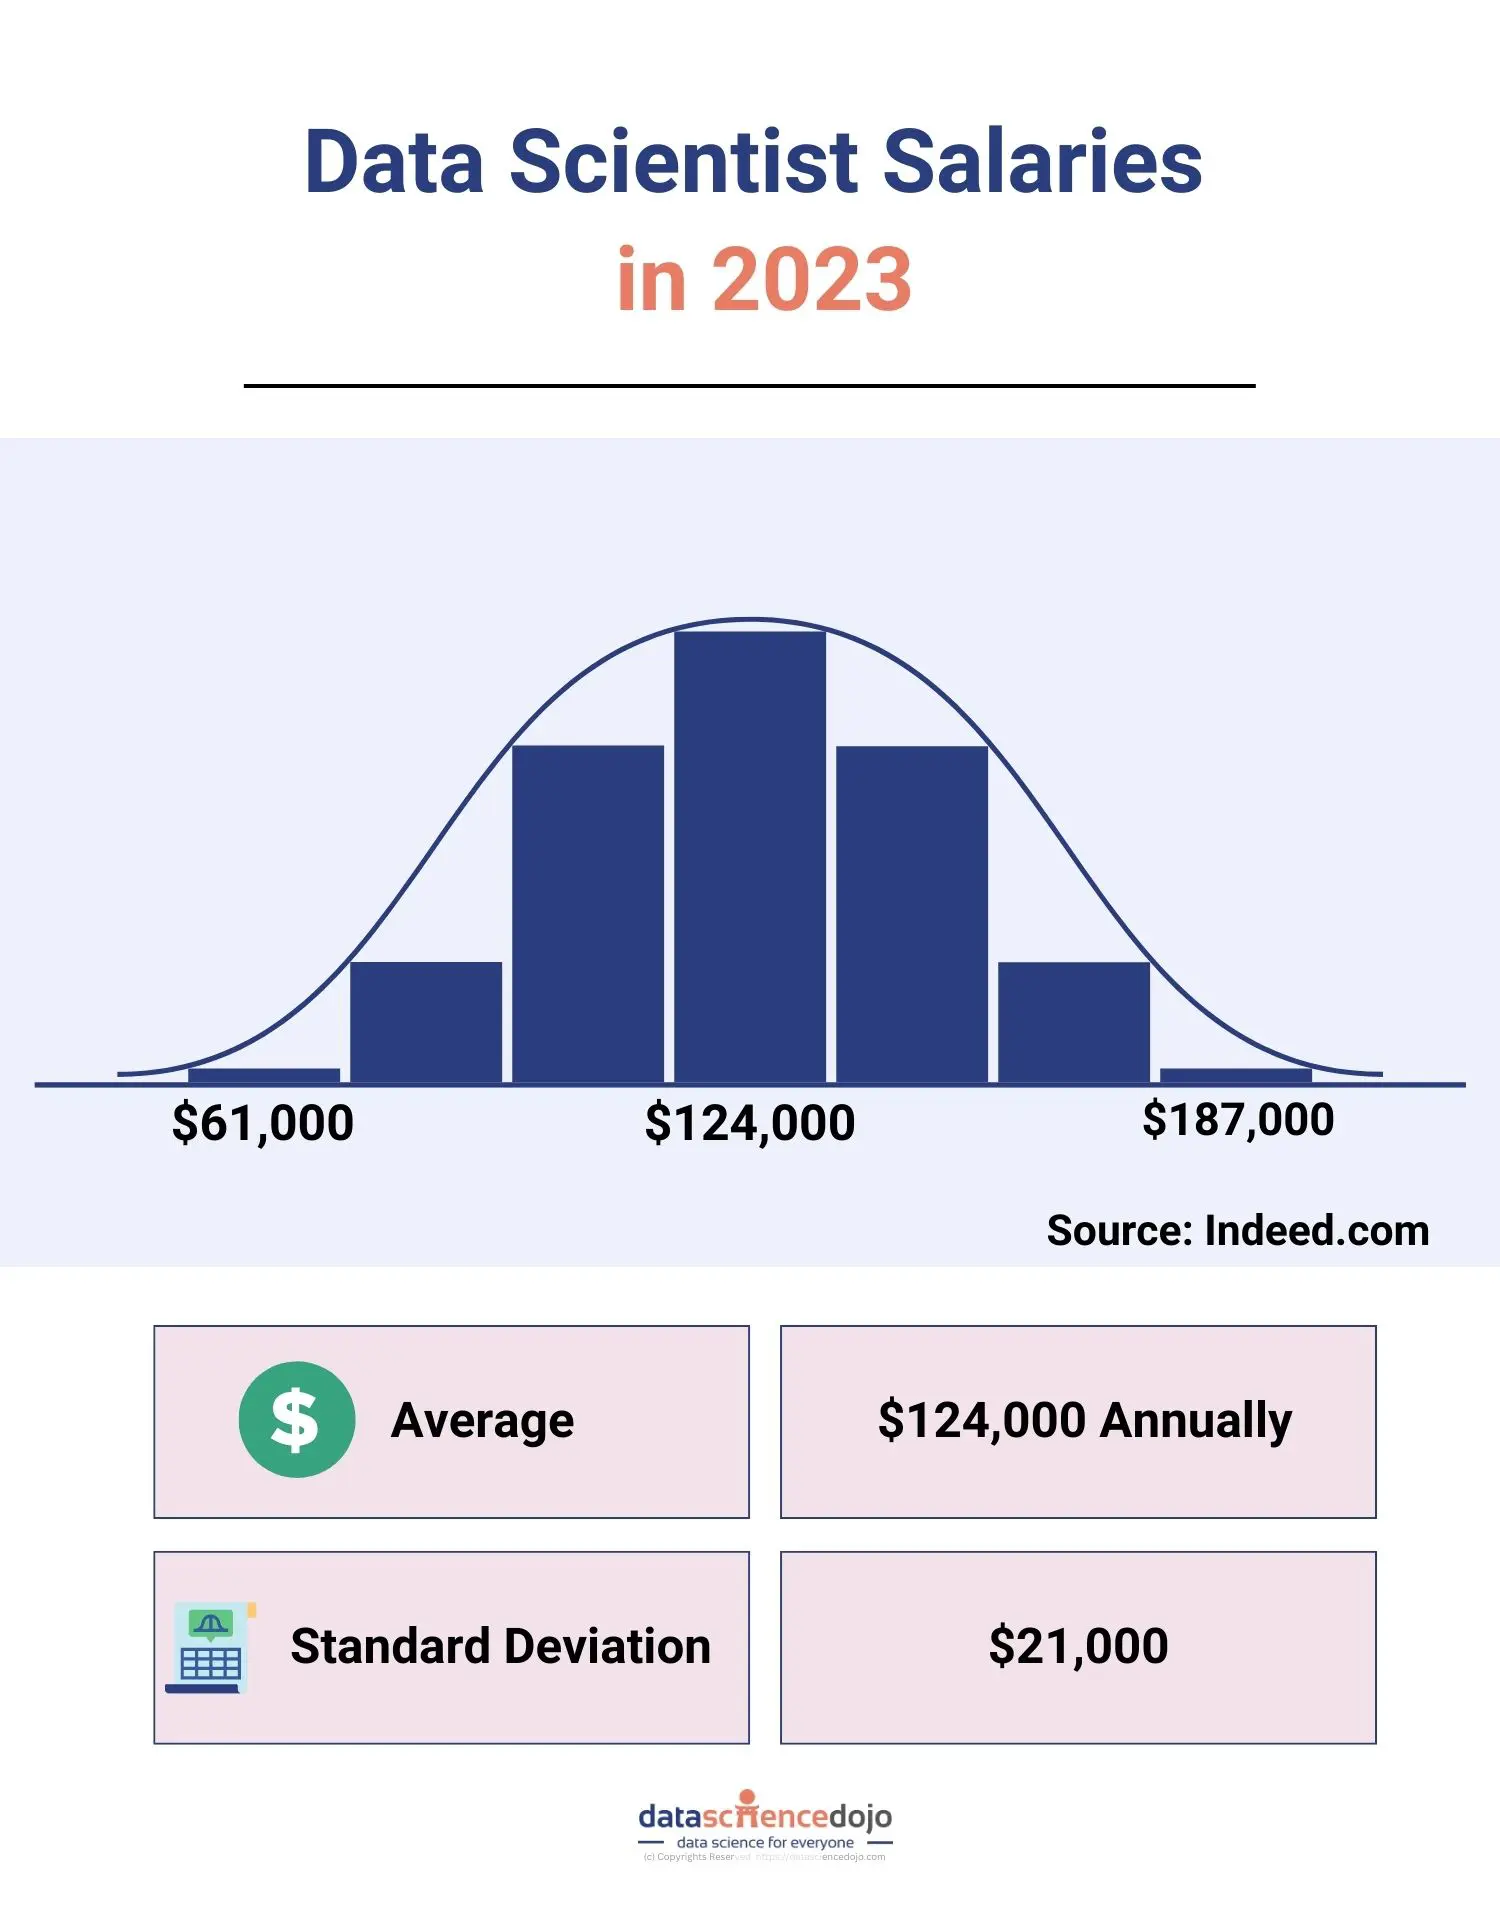
To get a better understanding of data scientist salaries in 2023, a study analyzed data from Indeed.com. The study analyzed the salaries for data scientist positions that were posted on Indeed in March 2023. The results of the study are as follows: 

  • Average annual salary: $124,000 
  • Standard deviation: $21,000 
  • Confidence interval (95%): $83,000 to $166,000 

The average annual salary for a data scientist in 2023 is $124,000. However, there is a significant range in salaries, with some data scientists earning as little as $83,000 and others earning as much as $166,000. The standard deviation of $21,000 indicates that there is a fair amount of variation in salaries even among data scientists with similar levels of experience and education. 

The average annual salary for a data scientist in 2023 is significantly higher than the median salary of $100,000 reported by the US Bureau of Labor Statistics for 2021. This discrepancy can be attributed to a number of factors, including the increasing demand for data scientists and the higher salaries offered by tech hubs. 


If you want to get started with Data Science as a career, get yourself enrolled in Data Science Dojo’s Data Science Bootcamp

10 different data science careers in 2023


Data Science Career


Average Salary (USD)


Range

Data Scientist $124,000 $83,000 – $166,000
Machine Learning Engineer $135,000 $94,000 – $176,000
Data Architect $146,000 $105,000 – $187,000
Data Analyst $95,000 $64,000 – $126,000
Business Intelligence Analyst $90,000 $60,000 – $120,000
Data Engineer $110,000 $79,000 – $141,000
Data Visualization Specialist $100,000 $70,000 – $130,000
Predictive Analytics Manager $150,000 $110,000 – $190,000
Chief Data Officer $200,000 $160,000 – $240,000

Conclusion 

The data scientist profession is a lucrative one, with salaries that are expected to continue to grow in the coming years. If you are interested in a career in data science, it is important to consider the factors that can impact your salary, such as your geographic location, experience, education, industry, and job title. By understanding these factors, you can position yourself for a high-paying career in data science. 

Murk Sindhya Memon - Author
Murk Sindhya Memon
| August 11

The significance of creating and disseminating information has been immensely crucial. In contemporary times, data science elements have emerged as a substantial and progressively expanding domain that has an impact on virtually every sphere of human ingenuity: be it commerce, technology, healthcare, education, governance, and beyond.

The challenge and prospects arise as we endeavor to extract the value embedded in data in a meaningful manner to facilitate the decision-making process.

Data science takes on a comprehensive approach to the concept of scientific inquiry, albeit adhering to certain fundamental regulations and tenets. This piece will concentrate on the elemental constituents constituting data science. However, prior to delving into that, it is prudent to precisely comprehend the essence of data science.

Large language model bootcamp

Essential data science elements: A comprehensive overview

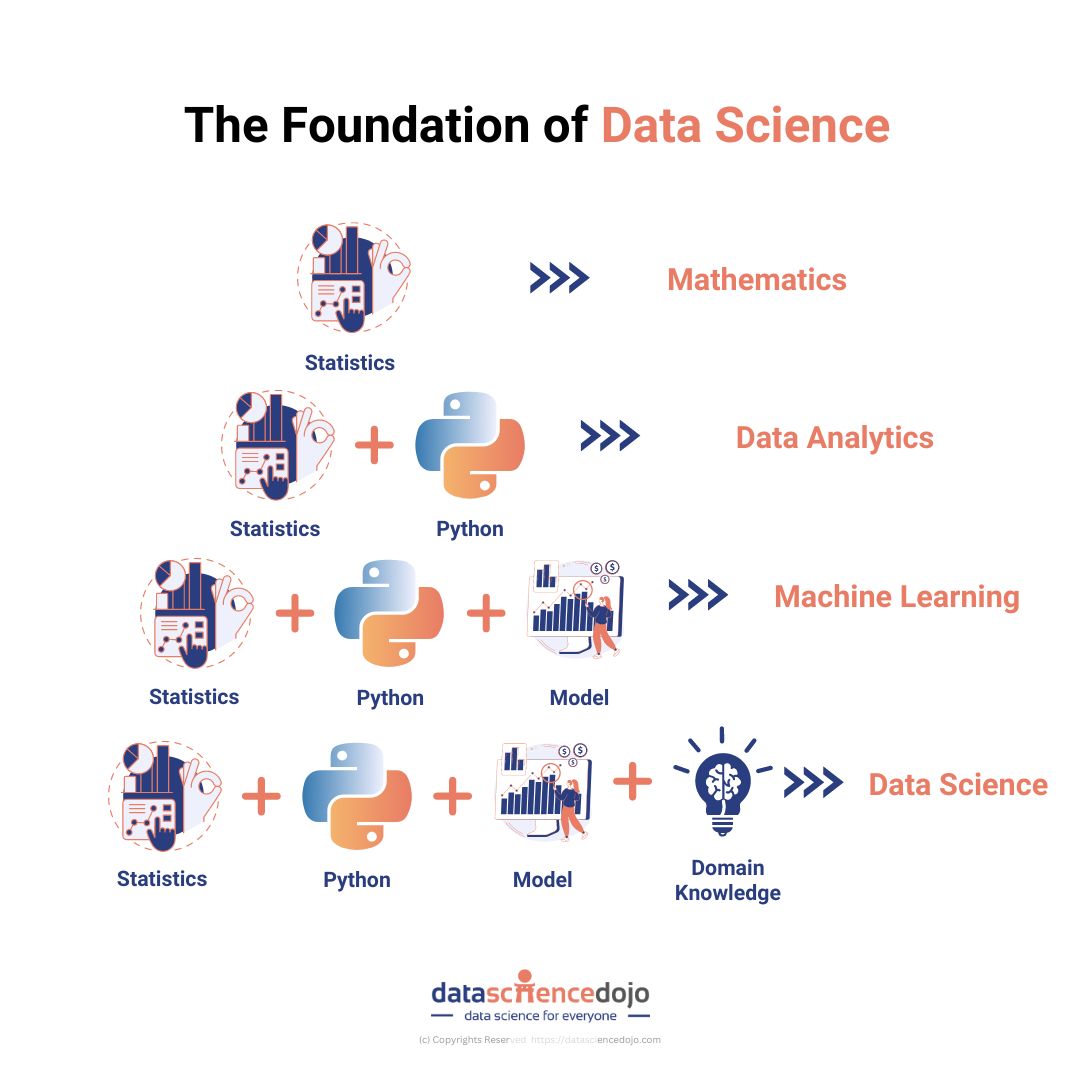
Data science has emerged as a critical field in today’s data-driven world, enabling organizations to glean valuable insights from vast amounts of data. At the heart of this discipline lie four key building blocks that form the foundation for effective data science: statistics, Python programming, models, and domain knowledge.

In this comprehensive overview, we will delve into each of these building blocks, exploring their significance and how they synergistically contribute to the field of data science.

1. Statistics: Unveiling the patterns within data

Statistics serves as the bedrock of data science, providing the tools and techniques to collect, analyze, and interpret data. It equips data scientists with the means to uncover patterns, trends, and relationships hidden within complex datasets. By applying statistical concepts such as central tendency, variability, and correlation, data scientists can gain insights into the underlying structure of data.

Moreover, statistical inference empowers them to make informed decisions and draw meaningful conclusions based on sample data.

There are many different statistical techniques that can be used in data science. Some of the most common techniques include: 

  • Descriptive statistics are used to summarize data. They can be used to describe the central tendency, spread, and shape of a data set. 
  • Inferential statistics are used to make inferences about a population based on a sample. They can be used to test hypotheses, estimate parameters, and make predictions. 
  • Machine learning is a field of computer science that uses statistical techniques to build models from data. These models can be used to predict future outcomes or to classify data into different categories. 

The ability to understand the principles of probability, hypothesis testing, and confidence intervals enables data scientists to validate their findings and ascertain the reliability of their analyses. Statistical literacy is essential for discerning between random noise and meaningful signals in data, thereby guiding the formulation of effective strategies and solutions.

2. Python: Versatile data scientist’s toolkit

Python has emerged as a prominent programming language in the data science realm due to its versatility, readability, and an expansive ecosystem of libraries. Its simplicity makes it accessible to both beginners and experienced programmers, facilitating efficient data manipulation, analysis, and visualization.

Some of the most popular Python libraries for data science include: 

  • NumPy is a library for numerical computation. It provides a fast and efficient way to manipulate data arrays. 
  • SciPy is a library for scientific computing. It provides a wide range of mathematical functions and algorithms. 
  • Pandas is a library for data analysis. It provides a high-level interface for working with data frames. 
  • Matplotlib is a library for plotting data. It provides a wide range of visualization tools. 

The flexibility of Python extends to its ability to integrate with other technologies, enabling data scientists to create end-to-end data pipelines that encompass data ingestion, preprocessing, modeling, and deployment. The language’s widespread adoption in the data science community fosters collaboration, knowledge sharing, and the development of best practices.

Building blocks of Data Science

3. Models: Bridging data and predictive insights

Models, in the context of data science, are mathematical representations of real-world phenomena. They play a pivotal role in predictive analytics and machine learning, enabling data scientists to make informed forecasts and decisions based on historical data patterns.

By leveraging models, data scientists can extrapolate trends and behaviors, facilitating proactive decision-making.

Supervised machine learning algorithms, such as linear regression and decision trees, are fundamental models that underpin predictive modeling. These algorithms learn patterns from labeled training data and generalize those patterns to make predictions on unseen data. Unsupervised learning models, like clustering and dimensionality reduction, aid in uncovering hidden structures within data.

There are many different types of models that can be used in data science. Some of the most common types of models include: 

  • Linear regression models are used to predict a continuous outcome from a set of independent variables. 
  • Logistic regression models are used to predict a categorical outcome from a set of independent variables. 
  • Decision trees are used to classify data into different categories. 
  • Support vector machines are used to classify data and to predict continuous outcomes. 

Models serve as an essential bridge between data and insights. By selecting, training, and fine-tuning models, data scientists can unlock the potential to automate decision-making processes, enhance business strategies, and optimize resource allocation.

4. Domain knowledge: Contextualizing data insights

While statistics, programming, and models provide the technical foundation for data science, domain knowledge adds a crucial contextual layer. Domain knowledge involves understanding the specific industry or field to which the data pertains. This contextual awareness aids data scientists in framing relevant questions, identifying meaningful variables, and interpreting results accurately.

Domain knowledge guides the selection of appropriate models and features, ensuring that data analyses align with the nuances of the subject matter. It enables data scientists to discern anomalies that might be of strategic importance, detect potential biases, and validate the practical relevance of findings.

Collaboration between data scientists and domain experts fosters a holistic approach to problem-solving. Data scientists contribute their analytical expertise, while domain experts offer insights that can refine data-driven strategies. This synergy enhances the quality and applicability of data science outcomes within the broader business or research context.

Conclusion: Synergy of four pillars

In the realm of data science, success hinges on the synergy of four essential building blocks: statistics, Python programming, models, and domain knowledge. Together, these pillars empower data scientists to collect, analyze, and interpret data, unlocking valuable insights and driving informed decision-making.

By harnessing statistical techniques, leveraging the versatility of Python, harnessing the power of models, and contextualizing findings within domain knowledge, data scientists can navigate the complexities of data-driven challenges and contribute meaningfully to their respective fields.

Syed Muhammad Hani - Author
Syed Muhammad Hani
| August 4

Are you a data scientist looking to streamline your development process and ensure consistent results across different environments? Need information on Docker for Data Science? Well, this blog post delves into the concept of Docker and how it helps developers ship their code effortlessly in the form of containers.

We will explore the underlying principle of virtualization, comparing Docker containers with virtual machines (VMs) to understand their differences. Plus, we will provide a hands-on Docker tutorial for data science using Python scripts, running on Windows OS, and integrated with Visual Studio Code (VS Code).

But that is not all! We will also uncover the power of Docker Hub and show you how to set up a Docker container registry, publish your images, and effortlessly share your data science projects across different environments. Let us embark on this containerization journey together!  

Understanding Dockers and Containers
Understanding Dockers and Containers – Source: Microsoft

Understanding the concept of Docker and Containers

The concept of Docker for Data Science is to help developers develop and ship their code easily, in the form of containers. These containers can be deployed anywhere, making the process of setting up a project much simpler, ensuring consistency and reproducibility across different environments. 

The structure of a Docker Image is that it contains instructions for creating a container. It is a snapshot of a filesystem with application code and all its dependencies. Docker Container, however, is a runnable instance of a Docker Image. You can play around with both using CLI, or GUI using Docker Desktop 
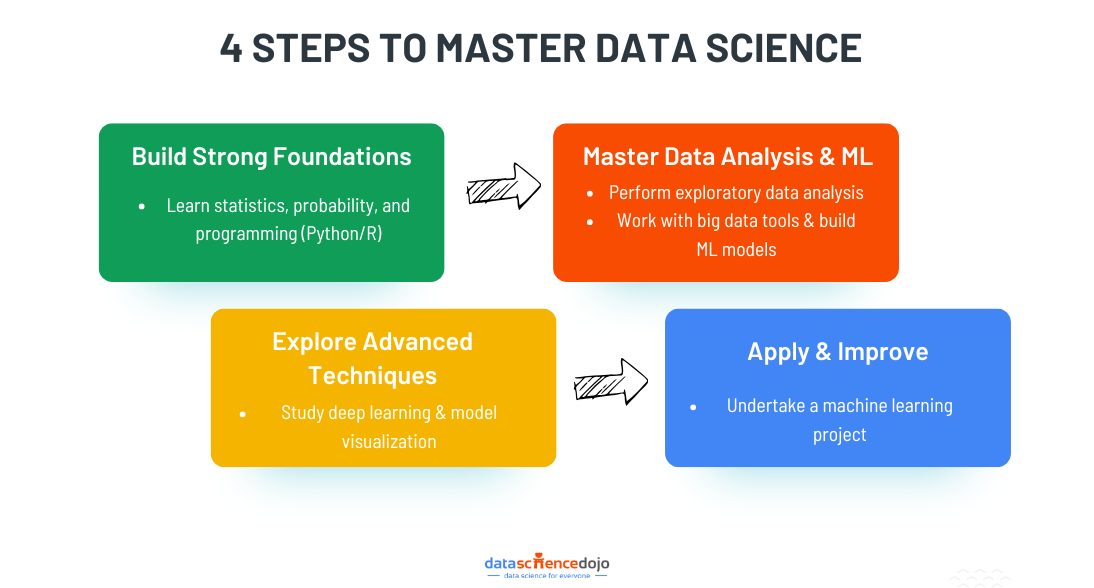
The underlying principle used to create isolated environments for running applications is called Virtualization. You may already have an idea of virtual machines which use the same concept. Both Docker and VMs aim to achieve isolation, but they use different approaches to accomplish this.  

VMs provide stronger isolation by running complete operating systems, while Docker containers leverage the host OS’s kernel, making them more lightweight and efficient in terms of resource usage. Docker containers are well-suited for deploying applications consistently across various environments, while VMs are better for running different operating systems on the same physical hardware.

Docker for data science: A tutorial 

Prerequisites: 

  1. Install Docker Desktop for Windows: Download and install Docker Desktop for Windows from the official website.
  2. Install Visual Studio Code: Download and install Visual Studio Code from the official website: https://code.visualstudio.com/ 

Step 1: Set Up Your Project Directory 

Create a project directory for your data science project. Inside the project directory, create a Python script (e.g., code_1.py) that contains your data science code. 

Let us suppose you have a file named code_1.py which contains:

This is just a simple example to demonstrate data analysis and machine learning operations 

Read more –> Machine learning roadmap: 5 Steps to a successful career

Step 2: Dockerfile 

Create a file in the project directory. The file contains instructions to build the image for your data science application.  

Step 3: Build the Docker Image 

Open a terminal or command prompt and navigate to your project directory. Build the image using the following command: 

Note: Remember to not skip the “.” as it serves as a positional argument.

Step 4: Run the Docker Container 

Once the image is built, you can run the Docker container with the following command: 

This will execute the Python script inside the container, and you will see the output in the terminal. 

Step 5: VS Code Integration 

To run and debug your data science code inside the container directly from VS Code, follow these steps:  

  • Install the “Remote – Containers” extension in VS Code. This extension allows you to work with development containers directly from VS Code. 
  • Open your project directory in VS Code. 
  • Click on the green icon at the bottom-left corner of the VS Code window. It should say “Open a Remote Window.” Select “Remote-Containers: Reopen in Container” from the menu that appears. 
  • VS Code will now reopen inside the Docker container. You will have access to all the tools and dependencies installed in the container. 
  • Open your code_1.py script in VS Code and start working on your data science code as usual. 
  • When you are ready to run the Python script, simply open a terminal in VS Code and execute it using the command: 

You can also use the VS Code debugger to set breakpoints, inspect variables, and debug your data science code inside the container. With this setup, you can develop and run your data science code using Docker and VS Code locally. 

Next, let us move toward the Docker Hub and Docker Container Registry, which will show us its power. By setting up a Docker container registry, publishing your Docker images, and pulling them from Docker Hub, you can easily share your data science projects with others or deploy them on different machines while ensuring consistency across environments. Docker Hub serves as a central repository for Docker images, making it convenient to manage and distribute your containers. 

Step 6: Set Up Docker Container Registry (Docker Hub): 

  1. Create an account on Docker Hub (https://hub.docker.com/). 
  2. Login to Docker Hub using the following command in your terminal or command prompt: 

Step 7: Tag and push the Docker Image to Docker Hub: 

After building the image, tag it with your  Hub username and the desired repository name. The repository name can be anything you choose. It is good practice to include a version number as well.  

Step 8: Pull and Run the Docker Image from Docker Hub: 

Now, let us demonstrate how to pull the Docker image from Docker Hub on a different machine or another environment: 

  1. On the new machine, install it and ensure it is running. 
  2. Pull the Docker image from Docker Hub using the following command: 

This will execute the same script we initially had inside the container, and you should see the same output as before. 

Final takeaways

In conclusion, Docker for data science is a game-changer for data scientists, streamlining development and ensuring consistent results across environments. Its lightweight containers outshine traditional VMs, making deployment effortless. With Docker Hub’s central repository, sharing projects becomes seamless.

Embrace Docker’s power and elevate your data science journey!

Author image - Ayesha
Ayesha Saleem
| July 18

Data science, machine learning, artificial intelligence, and statistics can be complex topics. But that doesn’t mean they can’t be fun! Memes and jokes are a great way to learn about these topics in a more light-hearted way.

In this blog, we’ll take a look at some of the best memes and jokes about data science, machine learning, artificial intelligence, and statistics. We’ll also discuss why these memes and jokes are so popular, and how they can help us learn about these topics.

So, whether you’re a data scientist, a machine learning engineer, or just someone who’s interested in these topics, read on for a laugh and a learning experience!


1. Data Science Memes


Data scientist's meme
R and Python languages in Data Science – Meme

As a data scientist, you must be able to relate to the above meme. R is a popular language for statistical computing, while Python is a general-purpose language that is also widely used for data science. They both are the most used languages in data science having their own advantages.


Large language model bootcamp


Here is a more detailed explanation of the two languages:

  • R is a statistical programming language that is specifically designed for data analysis and visualization. It is a powerful language with a wide range of libraries and packages, making it a popular choice for data scientists.
  • Python is a general-purpose programming language that can be used for a variety of tasks, including data science. It is a relatively easy language to learn, and it has a large and active community of developers.

Both R and Python are powerful languages that can be used for data science. The best language for you will depend on your specific needs and preferences. If you are looking for a language that is specifically designed for statistical computing, then R is a good choice. If you are looking for a language that is more versatile and can be used for a variety of tasks, then Python is a good choice.

Here are some additional thoughts on R and Python in data science:

  • R is often seen as the better language for statistical analysis, while Python is often seen as the better language for machine learning. However, both languages can be used for both tasks.
  • R is generally slower than Python, but it is more expressive and has a wider range of libraries and packages.
  • Python is easier to learn than R, but it has a steeper learning curve for statistical analysis.

Ultimately, the best language for you will depend on your specific needs and preferences. If you are not sure which language to choose, I recommend trying both and seeing which one you prefer.

Data scientist's meme
Data scientist’s meme

We’ve been on Twitter for a while now and noticed that there’s always a new tool or app being announced. It’s like the world of tech is constantly evolving, and we’re all just trying to keep up.

Although we are constantly learning about new tools and looking for ways to improve the workflow. But sometimes, it can be a bit overwhelming. There’s just so much information out there, and it’s hard to know which tools are worth your time.

So, what should we do to efficiently learn about evolving technology? We can develop a bit of a filter when it comes to new tools. If you see a tweet about a new tool, first ask yourself: “What problem does this tool solve?” If the answer is something that I’m currently struggling with, then take a closer look.

Also, check out the reviews for the tool. If the reviews are mostly positive, then try it. But if the reviews are mixed, then you can probably pass. Just

Just remember to be selective about the tools you use. Don’t just install every new tool that you see. Instead, focus on the tools that will actually help you be more productive.

And who knows, maybe you’ll even be the one to announce the next big thing!


Enjoying this blog? Read more about —> Data Science Jokes 


2. Machine Learning Meme

Data scientist's meme
Machine learning – Meme

Despite these challenges, machine learning is a powerful tool that can be used to solve a wide range of problems. However, it is important to be aware of the potential for confusion when working with machine learning.

Here are some tips for dealing with confusing machine learning:

  • Find a good resource. There are many good resources available that can help you understand machine learning. These resources can include books, articles, tutorials, and online courses.
  • Don’t be afraid to ask for help. If you are struggling to understand something, don’t be afraid to ask for help from a friend, colleague, or online forum.
  • Take it slow. Machine learning is a complex field, and it takes time to learn. Don’t try to learn everything at once. Instead, focus on one concept at a time and take your time.
  • Practice makes perfect. The best way to learn machine learning is by practicing. Try to build your own machine-learning models and see how they perform.

With time and effort, you can overcome the confusion and learn to use machine learning to solve real-world problems.

3. Statistics Meme

Data scientist's meme
Linear regression – Meme

Here are some fun examples to understand about outliers in linear regression models:

Outliers are like weird kids in school. They don’t fit in with the rest of the data, and they can make the model look really strange.
Outliers are like bad apples in a barrel. They can spoil the whole batch, and they can make the model inaccurate.
Outliers are like the drunk guy at a party. They’re not really sure what they’re doing, and they’re making a mess.

So, how do you deal with outliers in linear regression models? There are a few things you can do:

  • You can try to identify the outliers and remove them from the data set. This is a good option if the outliers are clearly not representative of the overall trend.
  • You can try to fit a non-linear regression model to the data. This is a good option if the data does not follow a linear trend.
  • You can try to adjust the model to account for the outliers. This is a more complex option, but it can be effective in some cases.

Ultimately, the best way to deal with outliers in linear regression models depends on the specific data set and the goals of the analysis.


Data scientist's meme
Statistics Meme

4. Programming Language Meme


Data scientist's meme
Java and Python – Meme

Java and Python are two of the most popular programming languages in the world. They are both object-oriented languages, but they have different syntax and semantics.

Here is a simple code written in Java:

And here is the same code written in Python:

As you can see, the Java code is more verbose than the Python code. This is because Java is a statically typed language, which means that the types of variables and expressions must be declared explicitly. Python, on the other hand, is a dynamically typed language, which means that the types of variables and expressions are inferred by the interpreter.

The Java code is also more structured than the Python code. This is because Java is a block-structured language, which means that statements must be enclosed in blocks. Python, on the other hand, is a free-form language, which means that statements can be placed anywhere on a line.

So, which language is better? It depends on your needs. If you need a language that is statically typed and structured, then Java is a good choice. If you need a language that is dynamically typed and free-form, then Python is a good choice.

Here is a light and funny way to think about the difference between Java and Python:

  • Java is like a suit and tie. It’s formal and professional.
  • Python is like a T-shirt and jeans. It’s casual and relaxed.
  • Java is like a German car. It’s efficient and reliable.
  • Python is like a Japanese car. It’s fun and quirky.

Ultimately, the best language for you depends on your personal preferences. If you’re not sure which language to choose, I recommend trying both and seeing which one you like better.


Git pull and Git push - Meme
Git pull and Git push – Meme

Git pull and Git push - Meme

Git pull and git push are two of the most common commands used in Git. They are used to synchronize your local repository with a remote repository.

Git pull fetches the latest changes from the remote repository and merges them into your local repository.

Git push pushes your local changes to the remote repository.

Here is a light and funny way to think about git pull and git push:

  • Git pull is like asking your friend to bring you a beer. You’re getting something that’s already been made, and you’re not really doing anything.
  • Git push is like making your own beer. It’s more work, but you get to enjoy the fruits of your labor.
  • Git pull is like a lazy river. You just float along and let the current take you.
  • Git push is like whitewater rafting. It’s more exciting, but it’s also more dangerous.

Ultimately, the best way to use git pull and git push depends on your needs. If you need to keep your local repository up-to-date with the latest changes, then you should use git pull. If you need to share your changes with others, then you should use git push.

Here is a joke about git pull and git push:

Why did the Git developer cross the road?

To fetch the latest changes.

User Experience Meme

Data scientist's meme
User experience – Meme

Bad user experience (UX) happens when you start with high hopes, but then things start to go wrong. The website is slow, the buttons are hard to find, and the error messages are confusing. By the end of the experience, you’re just hoping to get out of there as soon as possible.

Here are some examples of bad UX:

  • A website that takes forever to load.
  • A form that asks for too much information.
  • An error message that doesn’t tell you what went wrong.
  • A website that’s not mobile-friendly.

Bad UX can be frustrating and even lead to users abandoning a website or app altogether. So, if you’re designing a user interface, make sure to put the user first and create an experience that’s easy and enjoyable to use.

5. Open AI Memes and Jokes

OpenAI is a non-profit research company that is working to ensure that artificial general intelligence benefits all of humanity. They have developed a number of AI tools that are already making our lives easier, such as:

  • GPT-3: A large language model that can generate text, translate languages, write different kinds of creative content, and answer your questions in an informative way.
  • Dactyl: A robot hand that can learn to perform complex tasks by watching humans do them.
  • Five: A conversational AI that can help you with tasks like booking appointments, making reservations, and finding information.

OpenAI’s work is also leading to the obsolescence of some traditional ways of work. For example, GPT-3 is already being used by some businesses to generate marketing copy, and it is likely that this technology will eventually replace human copywriters altogether.

Here is a light and funny way to think about the impact of OpenAI on our lives:

  • OpenAI is like a genie in a bottle. It can grant us our wishes, but it’s up to us to use its power wisely.
  • OpenAI is like a new tool in the toolbox. It can help us do things that we couldn’t do before, but it’s not going to replace us.
  • OpenAI is like a new frontier. It’s full of possibilities, but it’s also full of risks.

Ultimately, the impact of OpenAI on our lives is still unknown. But one thing is for sure: it’s going to change the world in ways that we can’t even imagine.

Here is a joke about OpenAI:

What do you call a group of OpenAI researchers?

A think tank.

Data scientist's meme
AI – Meme


Data scientist's meme
AI-Meme


Data scientist's meme
Open AI – Meme


In addition to being fun, memes and jokes can also be a great way to discuss complex topics in a more accessible way. For example, a meme about the difference between supervised and unsupervised learning can help people who are new to these topics understand the concepts more visually.

Of course, memes and jokes are not a substitute for serious study. But they can be a fun and engaging way to learn about data science, machine learning, artificial intelligence, and statistics.

So next time you’re looking for a laugh, be sure to check out some memes and jokes about data science. You might just learn something!

Data Science Dojo
Sonya Newson
| July 7

In the technology-driven world we inhabit, two skill sets have risen to prominence and are a hot topic: coding vs data science. At first glance, they may seem like two sides of the same coin, but a closer look reveals distinct differences and unique career opportunities.  

This article aims to demystify these domains, shedding light on what sets them apart, the essential skills they demand, and how to navigate a career path in either field.

What is Coding?

Coding, or programming, forms the backbone of our digital universe. In essence, coding is the process of using a language that a computer can understand to develop software, apps, websites, and more.  

The variety of programming languages, including Python, Java, JavaScript, and C++, cater to different project needs.  Each has its niche, from web development to systems programming. 

  • Python, for instance, is loved for its simplicity and versatility. 
  • JavaScript, on the other hand, is the lifeblood of interactive web pages. 
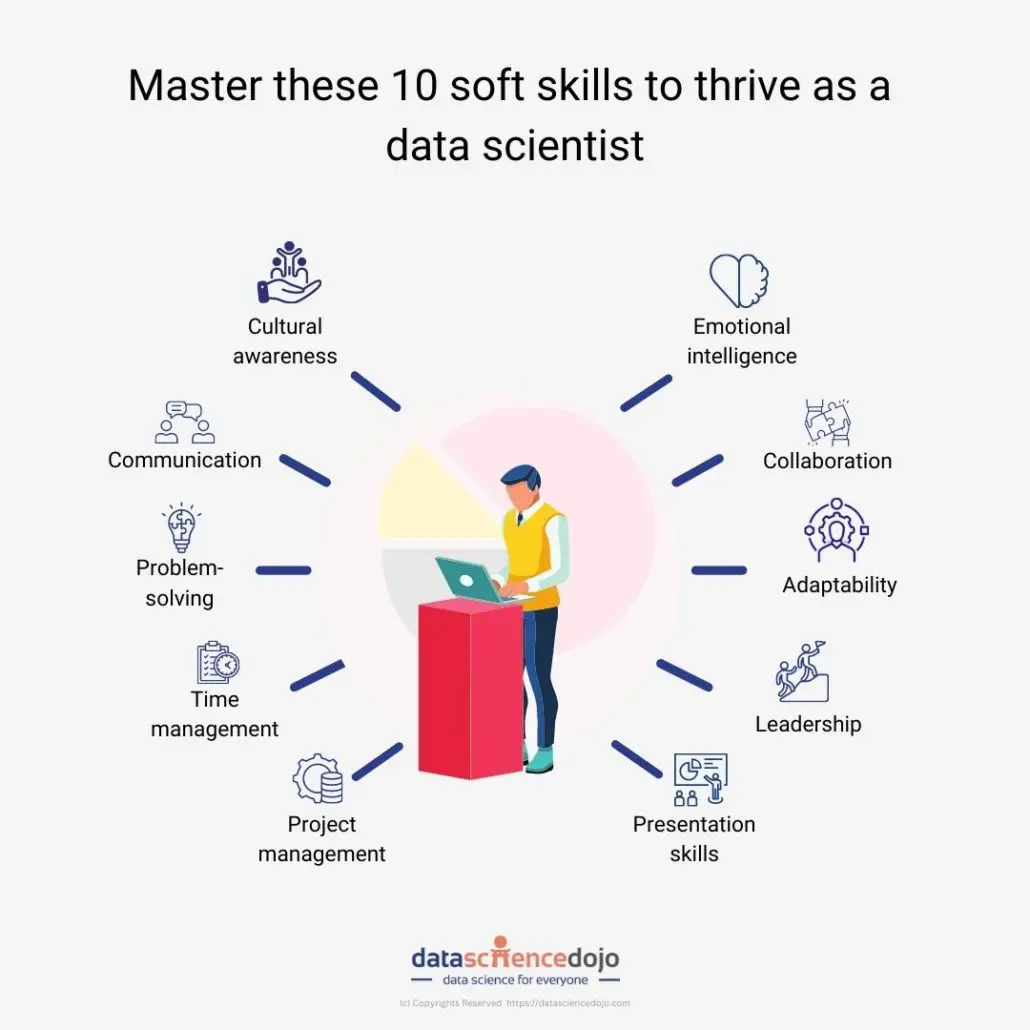
Coding vs Data Science

Coding goes beyond just software creation, impacting fields as diverse as healthcare, finance, and entertainment. Imagine a day without apps like Google Maps, Netflix, or Excel – that’s a world without coding! 

What is Data Science? 

While coding builds digital platforms, data science is about making sense of the data those platforms generate. Data Science intertwines statistics, problem-solving, and programming to extract valuable insights from vast data sets.  
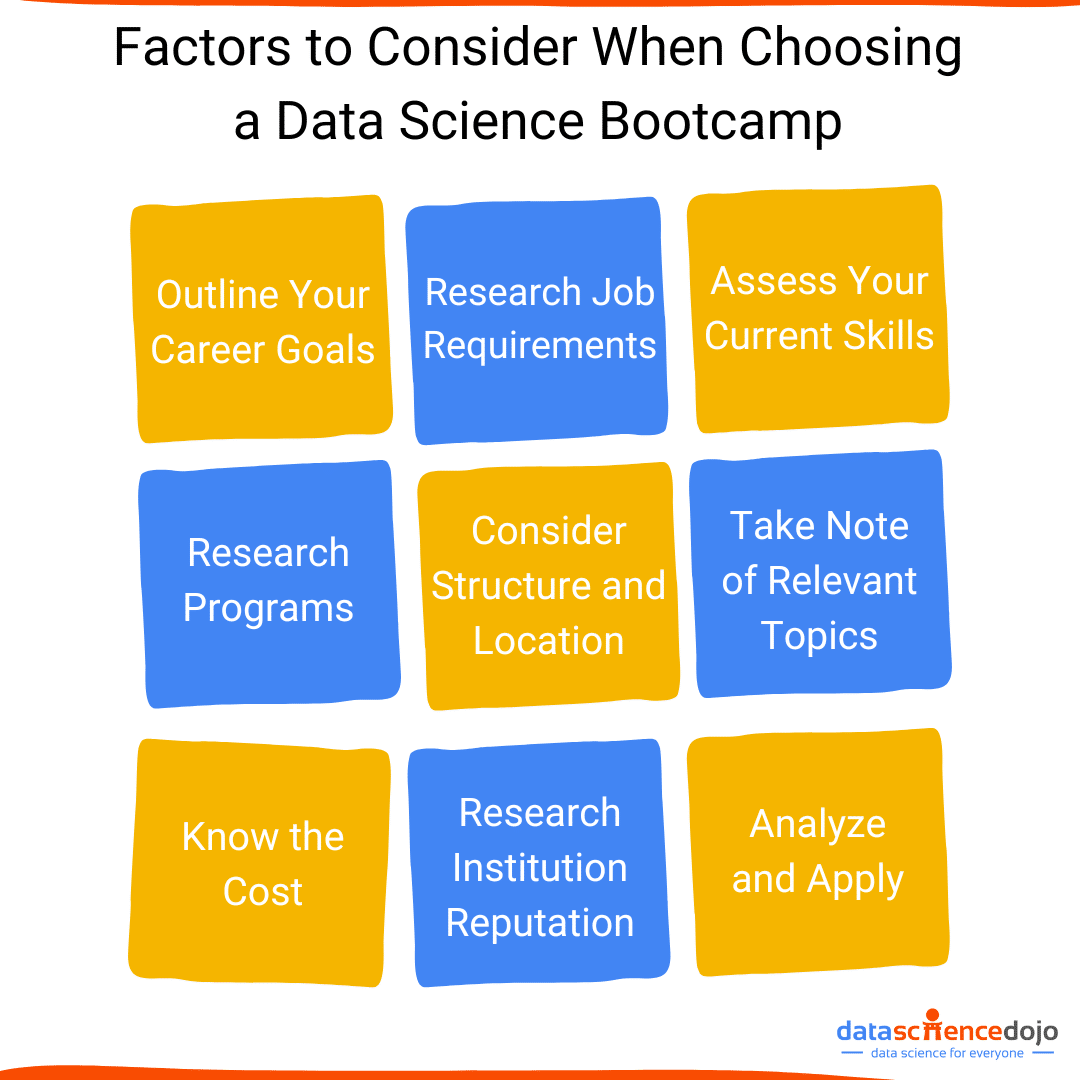
This discipline takes raw data, deciphers it, and turns it into a digestible format using various tools and algorithms. Tools such as Python, R, and SQL help to manipulate and analyze data. Algorithms like linear regression or decision trees aid in making data-driven predictions.   

In today’s data-saturated world, data science plays a pivotal role in fields like marketing, healthcare, finance, and policy-making, driving strategic decision-making with its insights. 

Essential Skills for Coding

Coding demands a unique blend of creativity and analytical skills. Mastering a programming language is just the tip of the iceberg. A skilled coder must understand syntax, but also demonstrate logical thinking, problem-solving abilities, and attention to detail. 

Logical thinking and problem-solving are crucial for understanding program flow and structure, as well as debugging and adding features. Persistence and independent learning are valuable traits for coders, given technology’s constant evolution.

Understanding algorithms is like mastering maps, with each algorithm offering different paths to solutions. Data structures, like arrays, linked lists, and trees, are versatile tools in coding, each with its unique capabilities.

Mastering these allows coders to handle data with the finesse of a master sculptor, crafting software that’s both efficient and powerful. But the adventure doesn’t end there.

But fear not, for debugging skills are the secret weapons coders wild to tame these critters.  Like a detective solving a mystery, coders use debugging to follow the trail of these bugs, understand their moves, and fix the disruption they’ve caused. In the end, persistence and adaptability complete a coder’s arsenal. 

Essential Skills for Data Science

Data Science, while incorporating coding, demands a different skill set. Data scientists need a strong foundation in statistics and mathematics to understand the patterns in data.  

Proficiency in tools like Python, R, SQL, and platforms like Hadoop or Spark is essential for data manipulation and analysis. Statistics helps data scientists to estimate, predict and test hypotheses.

Knowledge of Python or R is crucial to implement machine learning models and visualize data. Data scientists also need to be effective communicators, as they often present their findings to stakeholders with limited technical expertise.

Career Paths: Coding vs Data Science

The fields of coding and data science offer exciting and varied career paths. Coders can specialize as front-end, back-end, or full-stack developers, among others. Data science, on the other hand, offers roles as data analysts, data engineers, or data scientists. 

Whether you’re figuring out how to start coding or exploring data science, knowing your career path can help streamline your learning process and set realistic goals. 

Comparison: Coding vs Data Science 

While both coding and data science are deeply intertwined with technology, they differ significantly in their applications, demands, and career implications. 

Coding primarily revolves around creating and maintaining software, while data science is focused on extracting meaningful information from data. The learning curve also varies. Coding can be simpler to begin with, as it requires mastery of a programming language and its syntax.  

Data science, conversely, needs a broader skill set including statistics, data manipulation, and knowledge of various tools. However, the demand and salary potential in both fields are highly promising, given the digitalization of virtually every industry. 

Choosing Between Coding and Data Science 

Coding vs data science depends largely on personal interests and career aspirations. If building software and apps appeals to you, coding might be your path. If you’re intrigued by data and driving strategic decisions, data science could be the way to go. 

It’s also crucial to consider market trends. Demand in AI, machine learning, and data analysis is soaring, with implications for both fields. 

Transitioning from Coding to Data Science (and vice versa)

Transitions between coding and data science are common, given the overlapping skill sets.    

Coders looking to transition into data science may need to hone their statistical knowledge, while data scientists transitioning to coding would need to deepen their understanding of programming languages. 

Regardless of the path you choose, continuous learning and adaptability are paramount in these ever-evolving fields. 

Conclusion

In essence, coding vs data science or both are crucial gears in the technology machine.  Whether you choose to build software as a coder or extract insights as a data scientist, your work will play a significant role in shaping our digital world.  

So, delve into these exciting fields and discover where your passion lies. 

Ruhma Khawaja author
Ruhma Khawaja
| June 30

This blog elaborates on a Data Science Dojo vs Thinkful debate when you are looking for an appropriate data science bootcamp.

Choosing to invest in a data science bootcamp can be a daunting task. Whether it’s weighing pros and cons or cross-checking reviews, it can be brain-wracking to make the perfect choice.

To assist you in making a well-informed decision and simplify your research process, we have created this comparison blog of Data Science Dojo vs Thinkful to let their features and statistics speak for themselves.

So, without any delay, let’s delve deeper into the comparison: Data Science Dojo vs Thinkful Bootcamp.

Data Science Dojo vs Thinkful

Data Science Dojo 

As an ideal choice for beginners with no prerequisites, Data Science Dojo’s Bootcamp is a great choice. It is a 16-week online bootcamp that covers the fundamentals of data science. It adopts a business-first approach in its curriculum, combining theoretical knowledge with practical hands-on projects. With a team of instructors who possess extensive industry experience, students have the opportunity to receive personalized support during dedicated office hours.

The boot camp covers various topics, including data exploration and visualization, decision tree learning, predictive modeling for real-world scenarios, and linear models for regression. Moreover, students can use multiple payment plans and may earn a verified data science certificate from the University of New Mexico.


Thinkful

Thinkful’s data science bootcamp provides the option for part-time enrollment, requiring around six months to finish. Students advance through modules at their own pace, dedicating approximately 15 to 20 hours per week to coursework.

The curriculum features important courses such as analytics and experimentation, as well as a supervised learning experience in machine learning where students construct their initial models. It has a partnership with Southern New Hampshire University (SNHU), allowing graduates to earn credit toward a Bachelor’s or Master of Science degree at SNHU.

Data Science Dojo vs Thinkful features 

Here is a table that compares the features of Data Science Dojo and Thinkful:

Data Science Dojo VS Thinkful

Which data science bootcamp is best for you?

Embarking on a bootcamp journey is a major step for your career. Before committing to any program, it’s crucial to evaluate your future goals and assess how each prospective bootcamp aligns with them.

To choose the right data science bootcamp, ask yourself a series of important questions. How soon do you want to enter the workforce? What level of earning potential are you aiming for? Which skills are essential for your desired career path?

By answering these questions, you’ll gain valuable clarity during your search and be better equipped to make an informed decision. Ultimately, the best bootcamp for you will depend on your individual needs and goals.


Feeling uncertain about which bootcamp is the perfect fit for you? Talk with an advisor today!

Author image - Ayesha
Ayesha Saleem
| June 27

In today’s rapidly changing world, organizations need employees who can keep pace with the ever-growing demand for data analysis skills. With so much data available, there is a significant opportunity for organizations to harness the power of this data to improve decision-making, increase productivity, and enhance overall performance. In this blog post, we explore the business case for why every employee in an organization should learn data science. 

The importance of data science in the workplace 

Data science is a rapidly growing field that is revolutionizing the way organizations operate. Data scientists use statistical models, machine learning algorithms, and other tools to analyze and interpret data, helping organizations make better decisions, improve performance, and stay ahead of the competition. With the growth of big data, the demand for data science skills has skyrocketed, making it a critical skill for all employees to have. 

The benefits to learn data science for employees 

There are many benefits to learning data science for employees, including improved job satisfaction, increased motivation, and greater efficiency in processes By learning data science, employees can gain valuable skills that will make them more valuable to their organizations and improve their overall career prospects. 

Uses of data science in different areas of the business 

Data Science can be applied in various areas of business, including marketing, finance, human resources, healthcare, and government programs. Here are some examples of how data science can be used in different areas of business: 

  • Marketing: Data Science can be used to determine which product is most likely to sell. It provides insights, drives efficiency initiatives, and informs forecasts. 
  • Finance: Data Science can aid in stock trading and risk management. It can also make predictive modeling more accurate. 
  • Operations: Data Science applications can be used for any industry that generates data. A healthcare company might gather historical data on previous diagnoses, treatments and patient responses over years and use machine learning technologies to understand the different factors that might affect unique areas of treatments and human conditions 

Improved employee satisfaction 

One of the biggest benefits of learning data science is improved job satisfaction. With the ability to analyze and interpret data, employees can make better decisions, collaborate more effectively, and contribute more meaningfully to the success of the organization. Additionally, data science skills can help organizations provide a better work-life balance to their employees, making them more satisfied and engaged in their work. 

Increased motivation and efficiency 

Another benefit of learning data science is increased motivation and efficiency. By having the skills to analyze and interpret data, employees can identify inefficiencies in processes and find ways to improve them, leading to financial gain for the organization. Additionally, employees who have data science skills are better equipped to adopt new technologies and methods, increasing their overall capacity for innovation and growth. 

Opportunities for career advancement 

For employees looking to advance their careers, learning data science can be a valuable investment. Data science skills are in high demand across a wide range of industries, and employees with these skills are well-positioned to take advantage of these opportunities. Additionally, data science skills are highly transferable, making them valuable for employees who are looking to change careers or pursue new opportunities. 

Access to free online education platforms 

Fortunately, there are many free online education platforms available for those who want to learn data science. For example, websites like KDNuggets offer a listing of available data science courses, as well as free course curricula that can be used to learn data science. Whether you prefer to learn by reading, taking online courses, or using a traditional education plan, there is an option available to help you learn data science. 

Conclusion 

In conclusion, learning data science is a valuable investment for all employees. With its ability to improve job satisfaction, increase motivation and efficiency, and provide opportunities for career advancement, it is a critical skill for employees in today’s rapidly changing world. With access to free online education 

Enrolling in Data Science Dojo’s enterprise training program will provide individuals with comprehensive training in data science and the necessary resources to succeed in the field.

To learn more about the program, visit https://datasciencedojo.com/data-science-for-business/

Sydney Evans - Author
Sydney Evans
| June 15

Data science in finance brings a new era of insights and opportunities. By leveraging advanced data science, machine learning, and big data techniques, businesses can unlock the potential hidden within financial data,

Running a small business isn’t for the faint of heart. And yet, they comprise a staggering 99.9% of all businesses in the US alone. Small businesses may individually be small, but the impact they have on the economy is great—and their growth potential even greater.

But cultivating sustainable momentum in SMEs can be challenging, especially when you consider the sheer level of competition they face. Fortunately, there are many tools and strategies available to help small business owners successfully navigate this tough crowd.

Why data science in finance is essential

One of the most indispensable tools you can use as a small business is key metrics. This is especially true for businesses working in technical industries, such as data science in finance and other spheres.

The ability to measure the financial health of your businesses provides you and your team with crucial information about where to allocate resources and how to structure your budgets moving forward. It can also empower you to better connect with your target audience. Let’s find out more.

5 key financial metrics every small business should follow

There are dozens of key metrics worth following. But some are more important than others, and if you’re looking for the basics, this list of critical financial metrics is a suitable place to start.

1. Gross profit margin

This is financial metric 101. All businesses, regardless of size or industry, need to track their gross profit margin. A healthy business should maintain a high profit ratio. Getting there is only possible when you have a strong grip on profit margins as they fluctuate over time.

Gross profit margin is the difference between revenue and the cost of goods or services sold, divided by revenue. It’s typically expressed as a percentage. Your gross profit margin is one of the clearest and most important indicators of your business’s health and sustainability level.

2. Cash balance

Cash flow is another vitally important financial metric to follow. Your cash balance rate is determined by deducting the cash paid from the cash received during an allocated time period, such as a month, quarter, or year. It provides useful, easy-to-analyze information about how healthy your cash flow system is. 

A low cash balance will tell you that your business may be heading towards bankruptcy, or at the very least, financial difficulty. Whereas a high cash balance indicates that your business will remain sustainable for a longer period.

3. Customer retention

While customer retention might not sound like a financial metric, it provides crucial information about the current and future revenue of your small business.

You can find your customer retention rate by subtracting the number of new customers within a set period from the total number of retained customers by the end of that same time and then multiplying that number by one hundred.

4. Revenue concentration

Another important financial metric for small businesses is revenue concentration. It helps you calculate the total amount of revenue generated by either a set of your highest-paying clients or the revenue generated by your singularly high-paying client. 

This metric is important because it gives your insight into where your revenue should be concentrated for lead generation in both present and future situations. It also helps you to understand where most of your revenue is flowing.

5. Debt ratios

Your company’s debt ratio is determined by dividing your total debt by your total assets. This key financial metric tells you how leveraged your company is—or isn’t.

Debt ratios are important for judging true equity and assets. Both of which play major roles in the overall health of your small business. A vast percentage of small businesses start off in debt after a start-up loan (or something similar), which makes debt ratios even more important to track.

Why is data science in finance essential?

In a nutshell, data science in finance is essential for informed decision-making, accurate risk assessment, enhanced financial forecasting, efficient operations, personalized services, and fraud detection. By leveraging analytics and advanced techniques, businesses can gain valuable insights, optimize processes, allocate resources effectively, deliver personalized experiences, and ensure a secure financial environment.

Why use key metrics to track the progress of your business?

While analyzing data science in finance, metrics are indicators of your business’s health and expansion rate. Without the use of metrics and data science in finance, it’s impossible to accurately understand your business’s true status or position in the market.

This is especially important for SMEs, which typically require insight to break through their respective market. But there are many benefits to using key metrics for a deeper understanding of your business, including:

Track patterns over timeIf you know how to calculate profit margin, metrics can help you to identify and follow financial patterns (and other patterns) over extended periods of time. This provides a more insightful long-term perspective.  

Identify growth opportunities – Key metrics also help you identify problems and growth opportunities for your business. Plus, they highlight trends you may not have noticed otherwise and give your insight into how to best move forward.

Helps your team focus on what’s important – When you know the hard data behind your small business, you become more informed about what problems or strategies to prioritize.

Avoid unnecessary stress – The more information you have, the less confused you will be. And the less confused you are, the more confidently you can lead your team. Finding ways to reduce financial (and other) stress in small business management is essential.

Improve internal communication – When you have access to key metrics, both you and your coworkers or employees gain clarity as a team. This enhances communication and helps streamline internal communication strategies.

These little milestone metrics allow you to see your business through a clearer lens so that you can make more informed decisions and tackle problems with more efficiency and exactitude.

Bottom line

Metrics are data feedback from your business about the state of its health, longevity, and realistic growth potential. Without them, any major business, or financial decisions you make are being made in the dark. You need data science in finance to make strategic, informed decisions about your business.

But with so many different business-related metrics, it can be hard to know which ones are most important to follow. These five are listed for their universal appeal and reliability about financial health tracking. Whether you work in data analytics or AI, these metrics will come in handy.

Without waiting any further, start practicing data-driven decision making today!

Book a call CTA

Ruhma Khawaja author
Ruhma Khawaja
| June 9

The job market for data scientists is booming. In fact, the demand for data experts is expected to grow by 36% between 2021 and 2031, significantly higher than the average for all occupations. This is great news for anyone who is interested in a career in data science.

According to the U.S. Bureau of Labor Statistics, the job outlook for data science is estimated to be 36% between 2021–31, significantly higher than the average for all occupations, which is 5%. This makes it an opportune time to pursue a career in data science. 

Data Science Bootcamp

What are Data Science Bootcamps? 

Data science boot camps are intensive, short-term programs that teach students the skills they need to become data scientists. These programs typically cover topics such as data wrangling, statistical inference, machine learning, and Python programming. 

  • Short-term: Bootcamps typically last for 3-6 months, which is much shorter than traditional college degrees. 
  • Flexible: Bootcamps can be completed online or in person, and they often offer part-time and full-time options. 
  • Practical experience: Bootcamps typically include a capstone project, which gives students the opportunity to apply the skills they have learned. 
  • Industry-focused: Bootcamps are taught by industry experts, and they often have partnerships with companies that are hiring data scientists. 


Top 10 Data Science Bootcamps

Without further ado, here is our selection of the most reputable data science boot camps.  

1. Data Science Dojo Data Science Bootcamp

  • Delivery Format: Online and In-person
  • Tuition: $2,659 to $4,500
  • Duration: 16 weeks
Data Science Dojo Bootcamp

Data Science Dojo Bootcamp is an excellent choice for aspiring data scientists. With 1:1 mentorship and live instructor-led sessions, it offers a supportive learning environment. The program is beginner-friendly, requiring no prior experience. Easy installments with 0% interest options make it the top affordable choice. Rated as an impressive 4.96, Data Science Dojo Bootcamp stands out among its peers. Students learn key data science topics, work on real-world projects, and connect with potential employers. Moreover, it prioritizes a business-first approach that combines theoretical knowledge with practical, hands-on projects. With a team of instructors who possess extensive industry experience, students have the opportunity to receive personalized support during dedicated office hours.

2. Springboard Data Science Bootcamp

  • Delivery Format: Online
  • Tuition: $14,950
  • Duration: 12 months long
Springboard Data Science Bootcamp

Springboard’s Data Science Bootcamp is a great option for students who want to learn data science skills and land a job in the field. The program is offered online, so students can learn at their own pace and from anywhere in the world. The tuition is high, but Springboard offers a job guarantee, which means that if you don’t land a job in data science within six months of completing the program, you’ll get your money back.

3. Flatiron School Data Science Bootcamp

  • Delivery Format: Online or On-campus (currently online only)
  • Tuition: $15,950 (full-time) or $19,950 (flexible)
  • Duration: 15 weeks long
Flatiron School Data Science Bootcamp

Next on the list, we have Flatiron School’s Data Science Bootcamp. The program is 15 weeks long for the full-time program and can take anywhere from 20 to 60 weeks to complete for the flexible program.
Students have access to a variety of resources, including online forums, a community, and one-on-one mentorship.

4. Coding Dojo Data Science Bootcamp Online Part-Time

  • Delivery Format: Online
  • Tuition: $11,745 to $13,745
  • Duration: 16 to 20 weeks
Coding Dojo Data Science Bootcamp Online Part-Time

Coding Dojo’s online bootcamp is open to students with any background and does not require a four-year degree or Python programming experience. Students can choose to focus on either data science and machine learning in Python or data science and visualization. It offers flexible learning options, real-world projects, and a strong alumni network. However, it does not guarantee a job, requires some prior knowledge, and is time-consuming.

5. CodingNomads Data Science and Machine Learning Course

  • Delivery Format: Online
  • Tuition: Membership: $9/month, Premium Membership: $29/month, Mentorship: $899/month
  • Duration: Self-paced
CodingNomads Data Science Course

CodingNomads offers a data science and machine learning course that is affordable, flexible, and comprehensive. The course is available in three different formats: membership, premium membership, and mentorship. The membership format is self-paced and allows students to work through the modules at their own pace. The premium membership format includes access to live Q&A sessions. The mentorship format includes one-on-one instruction from an experienced data scientist. CodingNomads also offers scholarships to local residents and military students.

6. Udacity School of Data Science

  • Delivery Format: Online
  • Tuition: $399/month
  • Duration: Depends on the program
Udacity School of Data Science

Udacity offers multiple data science bootcamps, including data science for business leaders, data project managers and more. It offers frequent start dates throughout the year for its data science programs. These programs are self-paced and involve real-world projects and technical mentor support. Students can also receive LinkedIn profile and GitHub portfolio reviews from Udacity’s career services. However, it is important to note that there is no job guarantee, so students should be prepared to put in the work to find a job after completing the program.

7. LearningFuze Data Science Bootcamp

  • Delivery Format: Online and in person
  • Tuition: $5,995 per module
  • Duration: Multiple formats
LearningFuze Data Science Bootcamp

LearningFuze offers a data science boot camp through a strategic partnership with Concordia University Irvine. Offering students the choice of live online or in-person instruction, the program gives students ample opportunities to interact one-on-one with their instructors. LearningFuze also offers partial tuition refunds to students who are unable to find a job within six months of graduation.

The program’s curriculum includes modules in machine learning and deep learning and artificial intelligence. However, it is essential to note that there are no scholarships available, and the program does not accept the GI Bill.

8. Thinkful Data Science Bootcamp

  • Delivery Format: Online
  • Tuition: $16,950
  • Duration: 6 months
Thinkful Data Science Bootcamp

Thinkful offers a data science boot camp which is best known for its mentorship program. It caters to both part-time and full-time students. Part-time offers flexibility with 20-30 hours per week, taking 6 months to finish. Full-time is accelerated at 50 hours per week, completing in 5 months. Payment plans, tuition refunds, and scholarships are available for all students. The program has no prerequisites, so both fresh graduates and experienced professionals can take this program.

9. Brain Station Data Science Course Online

  • Delivery Format: Online
  • Tuition: $9,500 (part time); $16,000 (full time)
  • Duration: 10 weeks
Brain Station Data Science Course Online

BrainStation offers an immersive and hands-on data science boot camp that is both comprehensive and affordable. Industry experts teach the program and includes real-world projects and assignments. BrainStation has a strong job placement rate, with over 90% of graduates finding jobs within six months of completing the program. However, the program is expensive and can be demanding. Students should carefully consider their financial situation and time commitment before enrolling in the program.

10. BloomTech Data Science Bootcamp

  • Delivery Format: Online
  • Tuition: $19,950
  • Duration: 6 months
BloomTech Data Science Bootcamp

BloomTech offers a data science bootcamp covers a wide range of topics, including statistics, predictive modeling, data engineering, machine learning, and Python programming. BloomTech also offers a 4-week fellowship at a real company, which gives students the opportunity to gain work experience. BloomTech has a strong job placement rate, with over 90% of graduates finding jobs within six months of completing the program. The program is expensive and requires a significant time commitment, but it is also very rewarding.

What to expect in a data science bootcamp?

A data science bootcamp is a short-term, intensive program that teaches you the fundamentals of data science. While the curriculum may be comprehensive, it cannot cover the entire field of data science.

Therefore, it is important to have realistic expectations about what you can learn in a bootcamp. Here are some of the things you can expect to learn in a data science bootcamp:

  • Data science concepts: This includes topics such as statistics, machine learning, and data visualization.
  • Hands-on projects: You will have the opportunity to work on real-world data science projects. This will give you the chance to apply what you have learned in the classroom.
  • A portfolio: You will build a portfolio of your work, which you can use to demonstrate your skills to potential employers.
  • Mentorship: You will have access to mentors who can help you with your studies and career development.
  • Career services: Bootcamps typically offer career services, such as resume writing assistance and interview preparation.

Wrapping up

All and all, data science bootcamps can be a great way to learn the fundamentals of data science and gain the skills you need to launch a career in this field. If you are considering a boot camp, be sure to do your research and choose a program that is right for you.

Data Science Dojo
Saptarshi Sen
| June 7

The digital age today is marked by the power of data. It has resulted in the generation of enormous amounts of data daily, ranging from social media interactions to online shopping habits. It is estimated that every day, 2.5 quintillion bytes of data are created. Although this may seem daunting, it provides an opportunity to gain valuable insights into consumer behavior, patterns, and trends.

Big data and power of data science in the digital age
Big data and data science in the digital age

This is where data science plays a crucial role. In this article, we will delve into the fascinating realm of Data Science and the power of data. We examine why it is fast becoming one of the most in-demand professions. 

What is data science? 

Data Science is a field that encompasses various disciplines, including statistics, machine learning, and data analysis techniques to extract valuable insights and knowledge from data. The primary aim is to make sense of the vast amounts of data generated daily by combining statistical analysis, programming, and data visualization.

It is divided into three primary areas: data preparation, data modeling, and data visualization. Data preparation entails organizing and cleaning the data, while data modeling involves creating predictive models using algorithms. Finally, data visualization involves presenting data in a way that is easily understandable and interpretable. 

Importance of data science 

The application is not limited to just one industry or field. It can be applied in a wide range of areas, from finance and marketing to sports and entertainment. For example, in the finance industry, it is used to develop investment strategies and detect fraudulent transactions. In marketing, it is used to identify target audiences and personalize marketing campaigns. In sports, it is used to analyze player performance and develop game strategies.

It is a critical field that plays a significant role in unlocking the power of big data in today’s digital age. With the vast amount of data being generated every day, companies and organizations that utilize data science techniques to extract insights and knowledge from data are more likely to succeed and gain a competitive advantage. 

Skills required for a data scientist

It is a multi-faceted field that necessitates a range of competencies in statistics, programming, and data visualization.

Proficiency in statistical analysis is essential for Data Scientists to detect patterns and trends in data. Additionally, expertise in programming languages like Python or R is required to handle large data sets. Data Scientists must also have the ability to present data in an easily understandable format through data visualization.

A sound understanding of machine learning algorithms is also crucial for developing predictive models. Effective communication skills are equally important for Data Scientists to convey their findings to non-technical stakeholders clearly and concisely. 

If you are planning to add value to your data science skillset, check out ourPython for Data Sciencetraining.  

What are the initial steps to begin a career as a Data Scientist? 

To start a  career, it is crucial to establish a solid foundation in statistics, programming, and data visualization. This can be achieved through online courses and programs, such as data. To begin a career in data science, there are several initial steps you can take:

  • Gain a strong foundation in mathematics and statistics: A solid understanding of mathematical concepts such as linear algebra, calculus, and probability is essential in data science.
  • Learn programming languages: Familiarize yourself with programming languages commonly used in data science, such as Python or R.
  • Acquire knowledge of machine learning: Understand different algorithms and techniques used for predictive modeling, classification, and clustering.
  • Develop data manipulation and analysis skills: Gain proficiency in using libraries and tools like pandas and SQL to manipulate, preprocess, and analyze data effectively.
  • Practice with real-world projects: Work on practical projects that involve solving data-related problems.
  • Stay updated and continue learning: Engage in continuous learning through online courses, books, tutorials, and participating in data science communities.

Science training courses 

To further develop your skills and gain exposure to the community, consider joining Data Science communities and participating in competitions. Building a portfolio of projects can also help showcase your abilities to potential employers. Lastly, seeking internships can provide valuable hands-on experience and allow you to tackle real-world Data Science challenges. 

The crucial power of data

The significance cannot be overstated, as it has the potential to bring about substantial changes in the way organizations operate and make decisions. However, this field demands a distinct blend of competencies, such as expertise in statistics, programming, and data visualization 

Data Science Dojo
Natasha Merchant
| June 6

You needn’t go very far in today’s fast-paced, technology-driven market to witness the results of digital transformation. And it’s not just the flashy firms in Silicon Valley that are feeling the pinch. Year after year, developing and expanding technology displaces long-standing businesses and whole markets. 

In 2009, Uber came along and revolutionized the entire taxi business. Amazon Go, a cashier-less convenience store that debuted in 2019, is just one instance of how traditional industries are undergoing a digital upheaval. 

In today’s dynamic and constantly evolving business landscape, digitization is no longer a matter of debate but a crucial reality for businesses of all shapes and sizes.  

The question at hand is – what’s the path to get there? 

In this piece, we’ll delve deeper into each of these areas and explain why they’re critical for modern businesses to thrive in the digital age. 

Understanding the basics of digital transformation strategy

Digital transformation strategy guide

 An organization’s digital transformation strategy is a plan to optimize all aspects of its use of digital technology. The goal is to enhance operational effectiveness, teamwork, speed, and the quality of service provided to customers.  

The term “digital transformation” is broad enough to encompass everything from “IT modernization” (such as cloud computing) to “digital optimization” (such as “big data”) to “new digital business models.”  – Gartner

While innovation and speed are essential, digitizing the enterprise entails more than just introducing new technologies, releasing digital products, or migrating systems to the cloud. It also necessitates a radical transformation of the organization’s culture, processes, and workflows. 

ALSO READ: The power of AI-generated art to innovate the creative process 

Why is digital transformation strategy important?  

There are various motivations that could lead an entrepreneur to embark on the digital transformation journey.  

Survival is the most obvious motivation.  Now let’s discuss the significance of digital transformation.

Achieving competitive advantage  

Companies must consistently experiment with new ideas and methods to survive in today’s fast-paced, cutthroat economic climate. By harnessing the latest technologies, companies can innovate their products and services, streamline their processes, and reach new demographics. This can lead to the creation of fresh revenue streams and a superior customer experience, setting them apart from rivals. 

For instance, a business that uses AI to automate and streamline its procedures can save a lot of money compared to its rivals, who still use antiquated methods. Similarly, firms that employ data analytics to learn about their customers’ habits and likes can tailor their offerings to those consumers.

Improving operational efficiency  

Efficiency gains in business operations are another benefit of digital transformation. Using automation businesses can save huge time and money while reducing human error. For instance, robotic process automation (RPA) software can handle routine tasks like data entry and invoice processing to free up employees’ time for more strategic work. 

In addition, digital transformation can facilitate enhanced teamwork and communication inside businesses. Employees can work together effectively no matter where they are located, thanks to cloud-based collaboration technologies. This not only improves output but also helps businesses retain talented individuals who place a premium on work-life balance.

Enhancing customer experience

Businesses may benefit from digital transformation and better serve their customers by allowing for consistent and individualized service across channels. To better serve their customers, businesses can use machine learning algorithms trained on consumer data to understand their client’s tastes and preferences better.   

Customers may be more satisfied and loyal to a company if it offers self-service choices; this is made possible by digital transformation. Organizations can enhance customer satisfaction and shorten wait times by introducing simple digital channels.

Steps to develop a digital transformation strategy  

After learning what a digital transformation strategy is and why it’s important, you can begin developing your own strategy. To help you succeed, we’ve broken it down into five easy steps. 

Conducting a digital assessment  

You may begin building the groundwork for your approach after you have buy-in and a rough budget in mind. Assessing how well your business is doing right now should be your first order of business.  Planning your next steps requires knowing your current situation.  

A snapshot of the current situation can aid in the following: 

  • Analyze the ethos of the company. 
  • Assess the level of expertise in the workforce. 
  • Create a diagram of the present workflow, operations, and responsibilities. 
  • Find the problems that need to be fixed and the possibilities that can help.

A common pitfall for businesses undergoing digital transformation is assuming that it is easy to migrate existing technology to a new platform or system (like the cloud or AWS). You may better plan your digital operations and allocate your resources with the data gleaned from a current status assessment.  

ALSO READ: How big data revolution has the potential to do wonders in your business? 

Setting up vision and goals

After conducting a digital audit, the next stage is to formulate a mission and objectives for the digital transformation plan. You may determine your objectives and the steps to take to reach them with the assistance of a digital transformation strategy. 

Each company will undergo digital transformation in its own unique way, and as a result, its goals will vary. But every company needs to keep in mind the following minimum standards: 

  1. How could you improve your service to your customers? 
  2. Is it possible to improve productivity and cut costs by implementing cutting-edge strategies and tools? 
  3. How can you make your accounting firm flexible and open to new ideas? 
  4. Do you have a process for mining analytics to obtain data for making quick judgments?

Asking yourself these questions can help you zero in on the parts of your plan that need the most work or the parts of your approach that should be tackled first.

Implementing the strategy

You’ve finished planning, and now it’s time to put your strategy into action. However,  there are probably a lot of elements to your idea. Don’t try to cram in all of your changes at once; instead, take a breath and work in iterations. 

Only 16% of digital transformation initiatives achieved their desired results.” – a study conducted by McKinsey & Company 

That’s a staggering statistic that highlights the need for effective implementation. 

It is recommended to implement measures in stages, beginning with low-risk projects and working up to more ambitious plans. Talk about how things are going, make sure you’re not going outside the project’s parameters, and assess any issues to see whether they require a strategy adjustment. 

Making steady, substantial progress without introducing sudden, overwhelming, and disruptive change is possible by implementing a plan in manageable pieces.

Monitoring and measuring the results  

Every initiative must focus on measurable outcomes. For example, let’s say you want to implement a new company model that boosts revenue by 3% while improving operational efficiency by 15%. Creating a baseline won’t be too difficult if you already have data on some aspects of your business.  

Project success depends on stakeholders agreeing on how to measure aspects of the business for which no data exists. Measuring and metricizing new business models is difficult.   

  1. Is this revenue growth coming at the expense of other business units, or is it generated independently? 
  2. Is the revenue increase due to acquiring new customers or selling more to existing ones? 

As the business landscape undergoes significant changes, it’s crucial to gather valuable insights that can help predict long-term shifts. Companies can adapt to the changing market by anticipating trends and making informed decisions.

As such, evaluating your inventory and making necessary adjustments is necessary while also identifying logistics and technological changes required to address these shifts.

In order to better manage your progress toward transformation, metrics can be employed to help improve the entire team. Each member of the team needs to have a firm grasp on how progress is being tracked. Everyone should feel like they have a stake in the outcome (“win together”).  If you haven’t already, incorporate data tracking into every facet of your company immediately.

Conclusion

These three issues need to be addressed by any digital transformation strategy worth its salt.

  • Strategy: What do you hope to achieve?
  • Technology: How will you implement technology?
  • Marketing: Who will spearhead the transition?


The “what,” “who,” “how,” and “why” of any digital transformation strategy are the answers to fundamental business questions. Answering these issues is essential in developing a digital transformation strategy that can propel businesses forward.

A digital transformation strategy’s primary advantage is that it provides a road map that helps all teams work together to achieve what’s most important to the company and its consumers. Staying on track and giving your business the ability to evolve and drive innovation is possible with a solid digital transformation framework.

The key to success is mastering the intricacies of digital change. Enable your company to streamline its strategy implementation and shorten its time to market.

Related Topics

Statistics
Resources
Programming
Machine Learning
LLM
Generative AI
Data Visualization
Data Security
Data Science
Data Engineering
Data Analytics
Computer Vision
Career
Artificial Intelligence