fbpx
Learn to build large language model applications: vector databases, langchain, fine tuning and prompt engineering. Learn more

Data Visualization

avatar-180x180
Guest Author
| March 2

In a rapidly changing world, where anthropogenic activities continuously sculpt and modify our planet’s surface, understanding the complex dynamics of land cover is becoming increasingly critical.

Land cover classification (LCC), an exciting and increasingly vital field of study, offers a powerful lens to observe these changes, interpret their implications, and chart potential solutions for a sustainable future. 

The intricate mosaic of forests, agricultural lands, urban areas, water bodies, and other terrestrial features form the planet’s land cover. Our ability to classify and monitor these regions with accuracy can influence everything from climate change predictions and biodiversity conservation strategies to urban planning and agricultural productivity optimization.
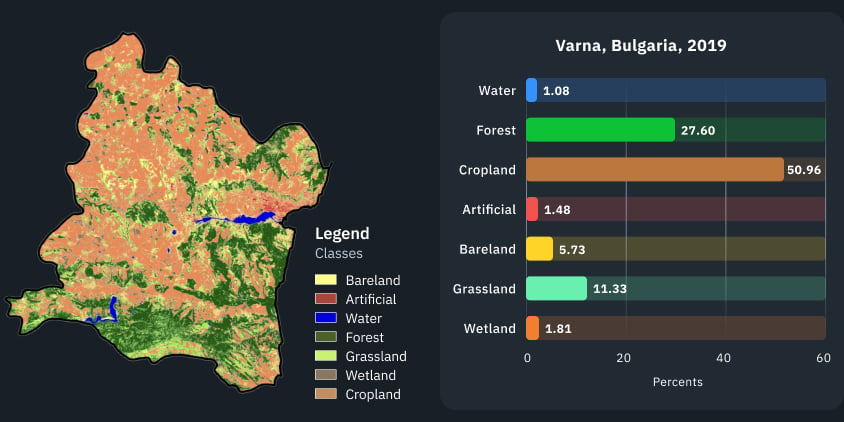
 

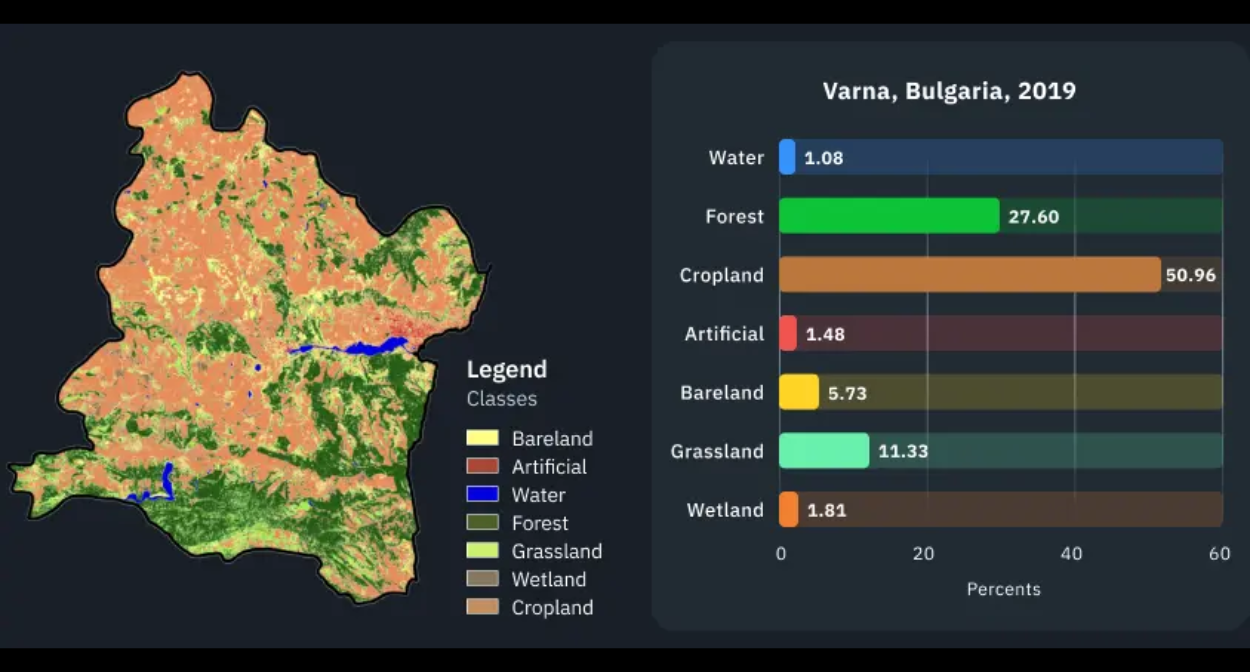
An example of land cover classification
An example of land cover classification – Source: EOSDA


Statistics on the use of agricultural land are highly informative. However, land use classification requires maps of field boundaries, potentially covering large areas containing thousands of farms. It takes work to obtain such a map.

However, there are more options and opportunities thanks to technological development, including AI algorithms and field boundary detection with satellite technologies. In this piece, we will delve into technologies driving the field, such as remote sensing and cutting-edge algorithms.


Satellite Imagery and Land Cover Classification


In the quest to accurately classify and monitor Earth’s land cover, researchers have found an indispensable tool: satellite imagery. Harnessing the power of different satellite platforms that offer satellite imagery, scientists can keep a watchful eye over the globe, identifying and documenting changes in land use with remarkable precision. 

At the heart of this discipline is remote sensing, a technique that involves the capture and analysis of data from sensors that can detect reflected, emitted, or backscattered radiation. Satellites equipped with these sensors orbit the Earth, collecting valuable data on different land cover types ranging from dense forests and sprawling urban landscapes to vast oceans and arid deserts. 

Advancements in machine learning and artificial intelligence have further propelled the potential of satellite imagery in land cover classification. Algorithms can be trained to automatically identify and categorize different land cover types based on their spectral signatures.

This process, often referred to as supervised classification, has greatly improved the speed and accuracy of large-scale land cover mapping.


Large language model bootcamp


For instance, the EOSDA scientific team continually refines neural network models for land cover classification, employing a custom fully connected regression model (FCRM) to ensure precision. In the process, they initially collect and preprocess satellite images alongside corresponding ground truth data (such as weather conditions) for various land cover categories.

Next, they design an FCRM for each class, which transforms into a linear regression on the output, establishing a linear relationship between the input (satellite data) and output. 

The data is then divided into training, validation, and testing subsets, ensuring a balanced representation of classes. Each FCRM is trained separately on the training set, to minimize the Mean Squared Error (MSE) between predicted probabilities and ground truth labels.

Optimization algorithms and regularization techniques are used to update model parameters and prevent overfitting, respectively. Then the team monitors the FCRM’s performance on the validation set during training and adjusts hyperparameters as needed to optimize performance.

Then, by using ensemble methods, the scientists combine predictions from individual FCRMs to achieve a final land cover classification. Afterward, they assess the overall algorithm performance on the test data, using various metrics like statistical error.

Then, iterate through the previous steps to fine-tune and improve the classification performance. Finally, the output visualizations are prepared according to predefined Area of Interest (AOI) coordinates.


Field Boundaries Detection With Satellite Technologies


Remote sensing images provide detailed spatial information on agricultural land use that is otherwise difficult to collect. Manual interpretation is labor-intensive, so researchers use automatic field boundary detection and land use classification methods, often with a time series of images.

EOS Data Analytics provides cutting-edge technological solutions based on high-resolution imagery and boundary detection algorithms that provide detailed field delineation, with models customized to any region using locally-sourced client data.

EOSDA solution offers over 80% accuracy, depending on various factors, including season and region. Advanced algorithms entirely automate the task so that field boundary maps can be created seamlessly and accurately, even for large territories.


Learn to build LLM applications


Convolutional Neural Network: Stellar Algorithms in LCC


As a subset of machine learning algorithms, CNNs have revolutionized the way we interpret and analyze satellite imagery, turning what was once a time-consuming, manual task into an automated, efficient process. 

In the context of land cover classification, a CNN can be trained to recognize different land cover types based on their spectral and textural characteristics in satellite imagery. The network scans through the image, identifies unique features of each land cover type, and assigns a class label accordingly — such as water, urban area, forest, or agriculture. 
CNNs offer several advantages in land cover classification.

Firstly, they eliminate the need for manual feature extraction, a traditionally laborious step in image classification. Instead, they automatically learn relevant features from the data, often resulting in improved classification accuracy.

Secondly, due to their hierarchical nature, they can recognize patterns at different scales, making them versatile for different sizes and resolutions of images.


Examples of Land Cover Classification with EOSDA


Let’s examine the Land Use and Land Cover (LULC) classification results achieved by the EOS Data Analytics model in Bulgaria. The model accurately identified classes such as forests, water bodies, and croplands. It’s important to note that the precision of the cropland class is closely tied to the quantity of input images, seasonal variations, and the resulting output.

The output demonstrates the model’s training on ample high-quality input data, as shown by the EOSDA scientists. Infrastructure, such as pavements, is meticulously captured within the bare land class. The model has also successfully identified man-made structures.

Another example of LULC classification by EOSDA is in Africa. The training output indicates that the model effectively classified Nigeria’s arid regions as the bare land class. Simultaneously, it precisely detected limited areas of water and grassland. The model’s identification of minor wetland territories provides insights into seasonal flooding patterns or their absence, which could suggest drought conditions.

Ali Haider - Author
Ali Haider Shalwani
| September 26

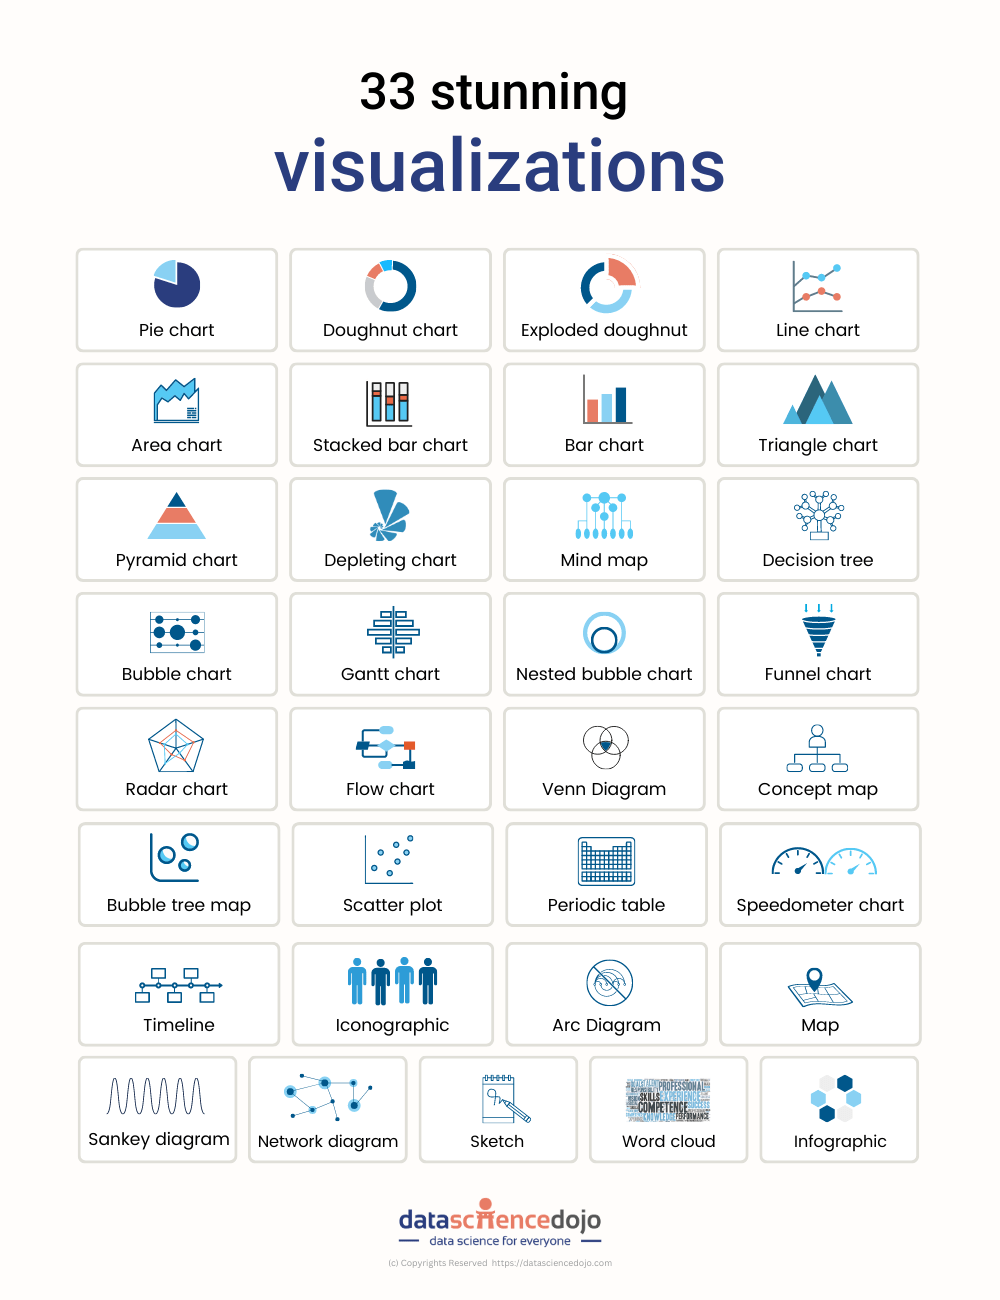
Plots in data science play a pivotal role in unraveling complex insights from data. They serve as a bridge between raw numbers and actionable insights, aiding in the understanding and interpretation of datasets. Learn about 33 tools to visualize data with this blog 

In this blog post, we will delve into some of the most important plots and concepts that are indispensable for any data scientist. 

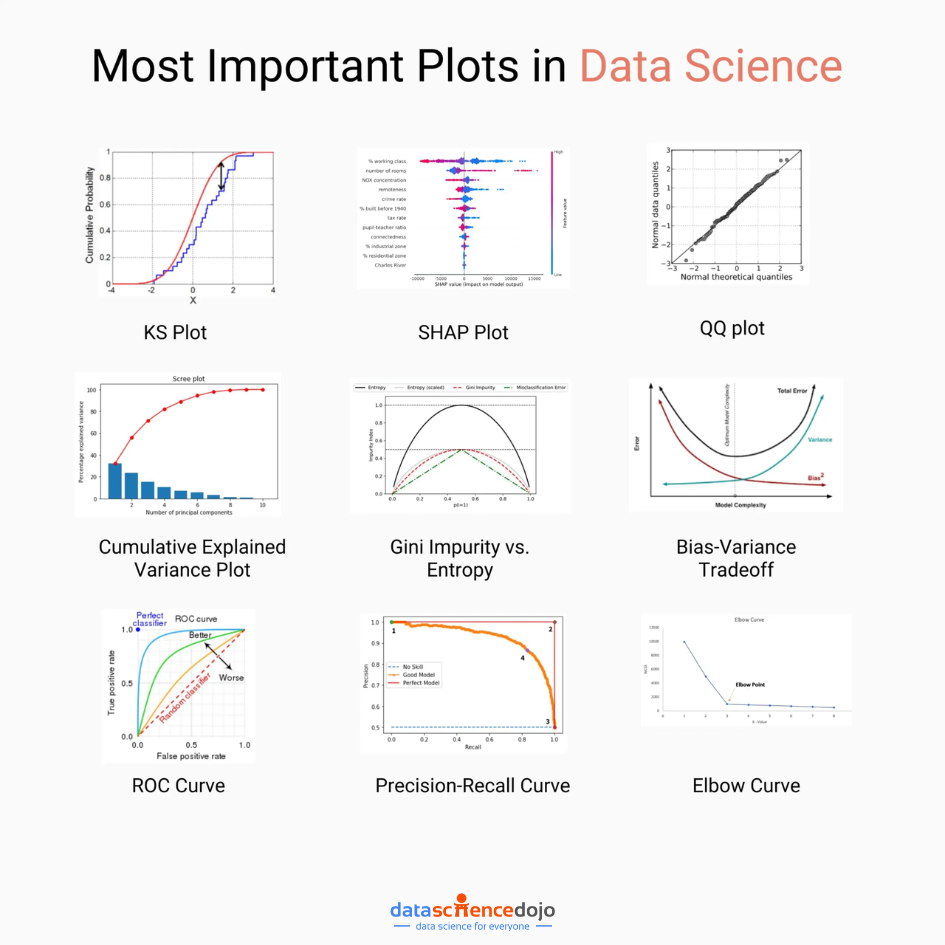
data science plots
9 Data Science Plots – Data Science Dojo


1. KS Plot (Kolmogorov-Smirnov Plot):

The KS Plot is a powerful tool for comparing two probability distributions. It measures the maximum vertical distance between the cumulative distribution functions (CDFs) of two datasets. This plot is particularly useful for tasks like hypothesis testing, anomaly detection, and model evaluation.

Suppose you are a data scientist working for an e-commerce company. You want to compare the distribution of purchase amounts for two different marketing campaigns. By using a KS Plot, you can visually assess if there’s a significant difference in the distributions. This insight can guide future marketing strategies.

2. SHAP Plot:

SHAP plots offer an in-depth understanding of the importance of features in a predictive model. They provide a comprehensive view of how each feature contributes to the model’s output for a specific prediction. SHAP values help answer questions like, “Which features influence the prediction the most?”

Imagine you’re working on a loan approval model for a bank. You use a SHAP plot to explain to stakeholders why a certain applicant’s loan was approved or denied. The plot highlights the contribution of each feature (e.g., credit score, income) in the decision, providing transparency and aiding in compliance.

3. QQ plot:

The QQ plot is a visual tool for comparing two probability distributions. It plots the quantiles of the two distributions against each other, helping to assess whether they follow the same distribution. This is especially valuable in identifying deviations from normality.

In a medical study, you want to check if a new drug’s effect on blood pressure follows a normal distribution. Using a QQ Plot, you compare the observed distribution of blood pressure readings post-treatment with an expected normal distribution. This helps in assessing the drug’s effectiveness. 

Large language model bootcamp


4. Cumulative explained variance plot:

In the context of Principal Component Analysis (PCA), this plot showcases the cumulative proportion of variance explained by each principal component. It aids in understanding how many principal components are required to retain a certain percentage of the total variance in the dataset.

Let’s say you’re working on a face recognition system using PCA. The cumulative explained variance plot helps you decide how many principal components to retain to achieve a desired level of image reconstruction accuracy while minimizing computational resources. 

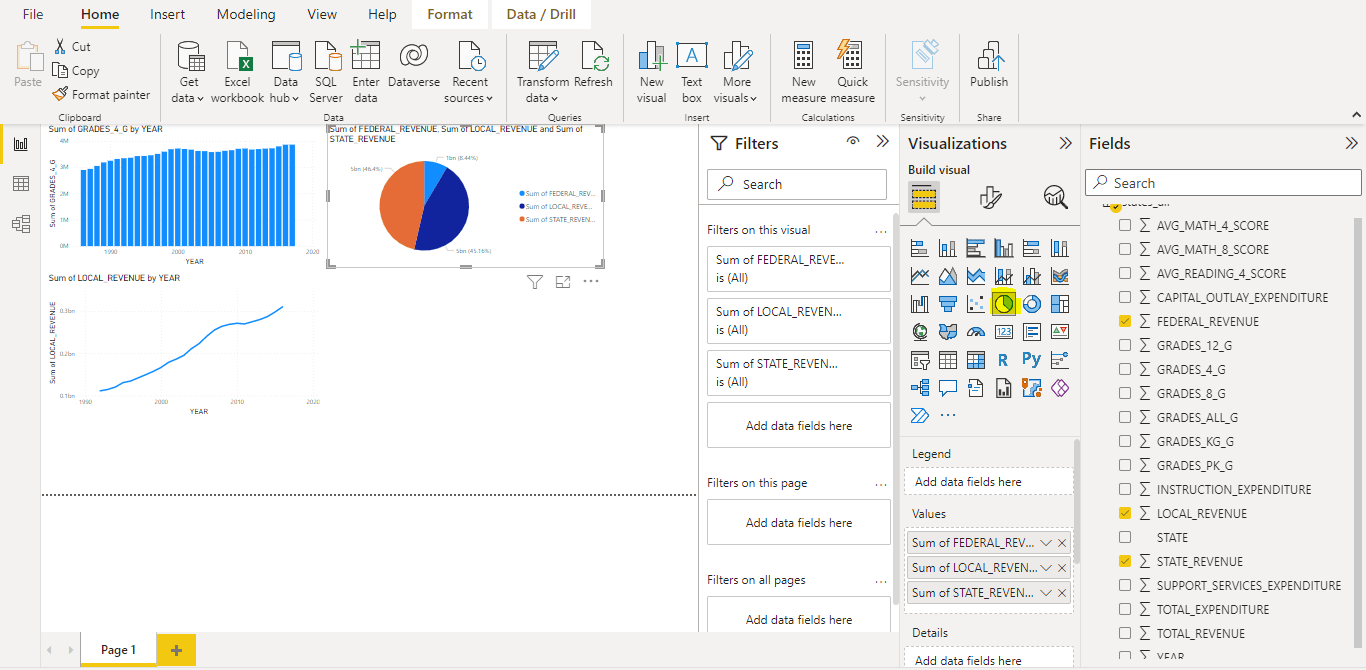
Explore, analyze, and visualize data using Power BI Desktop to make data-driven business decisions. Check out our Introduction to Power BI cohort. 

5. Gini Impurity vs. Entropy:

These plots are critical in the field of decision trees and ensemble learning. They depict the impurity measures at different decision points. Gini impurity is faster to compute, while entropy provides a more balanced split. The choice between the two depends on the specific use case.

Suppose you’re building a decision tree to classify customer feedback as positive or negative. By comparing Gini impurity and entropy at different decision nodes, you can decide which impurity measure leads to a more effective splitting strategy for creating meaningful leaf nodes.

6. Bias-Variance tradeoff:

Understanding the tradeoff between bias and variance is fundamental in machine learning. This concept is often visualized as a curve, showing how the total error of a model is influenced by its bias and variance. Striking the right balance is crucial for building models that generalize well.

Imagine you’re training a model to predict housing prices. If you choose a complex model (e.g., deep neural network) with many parameters, it might overfit the training data (high variance). On the other hand, if you choose a simple model (e.g., linear regression), it might underfit (high bias). Understanding this tradeoff helps in model selection. 

7. ROC curve:

The ROC curve is a staple in binary classification tasks. It illustrates the tradeoff between the true positive rate (sensitivity) and false positive rate (1 – specificity) for different threshold values. The area under the ROC curve (AUC-ROC) quantifies the model’s performance.

In a medical context, you’re developing a model to detect a rare disease. The ROC curve helps you choose an appropriate threshold for classifying individuals as positive or negative for the disease. This decision is crucial as false positives and false negatives can have significant consequences. 

Want to get started with data science? Check out our instructor-led live Data Science Bootcamp 

8. Precision-Recall curve:

Especially useful when dealing with imbalanced datasets, the precision-recall curve showcases the tradeoff between precision and recall for different threshold values. It provides insights into a model’s performance, particularly in scenarios where false positives are costly.

Let’s say you’re working on a fraud detection system for a bank. In this scenario, correctly identifying fraudulent transactions (high recall) is more critical than minimizing false alarms (low precision). A precision-recall curve helps you find the right balance.

9. Elbow curve:

In unsupervised learning, particularly clustering, the elbow curve aids in determining the optimal number of clusters for a dataset. It plots the variance explained as a function of the number of clusters. The “elbow point” is a good indicator of the ideal cluster count.

You’re tasked with clustering customer data for a marketing campaign. By using an elbow curve, you can determine the optimal number of customer segments. This insight informs personalized marketing strategies and improves customer engagement. 


Improvise your models today with plots in data science! 

These plots in data science are the backbone of your data. Incorporating them into your analytical toolkit will empower you to extract meaningful insights, build robust models, and make informed decisions from your data. Remember, visualizations are not just pretty pictures; they are powerful tools for understanding the underlying stories within your data. 


Check out this crash course in data visualization, it will help you gain great insights so that you become a data visualization pro: 


Ruhma Khawaja author
Ruhma Khawaja
| July 6

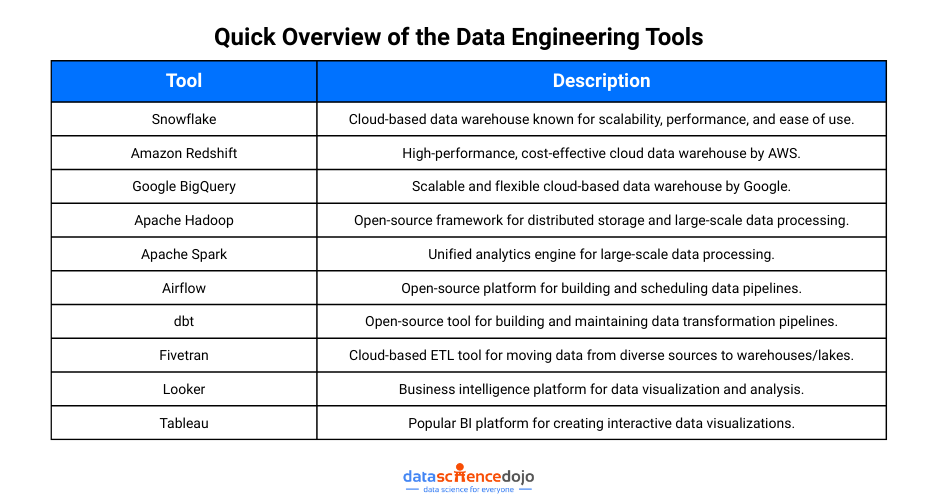
Data engineering tools are software applications or frameworks specifically designed to facilitate the process of managing, processing, and transforming large volumes of data.

These tools provide data engineers with the necessary capabilities to efficiently extract, transform, and load (ETL) data, build data pipelines, and prepare data for analysis and consumption by other applications.

Data engineering tools offer a range of features and functionalities, including data integration, data transformation, data quality management, workflow orchestration, and data visualization.

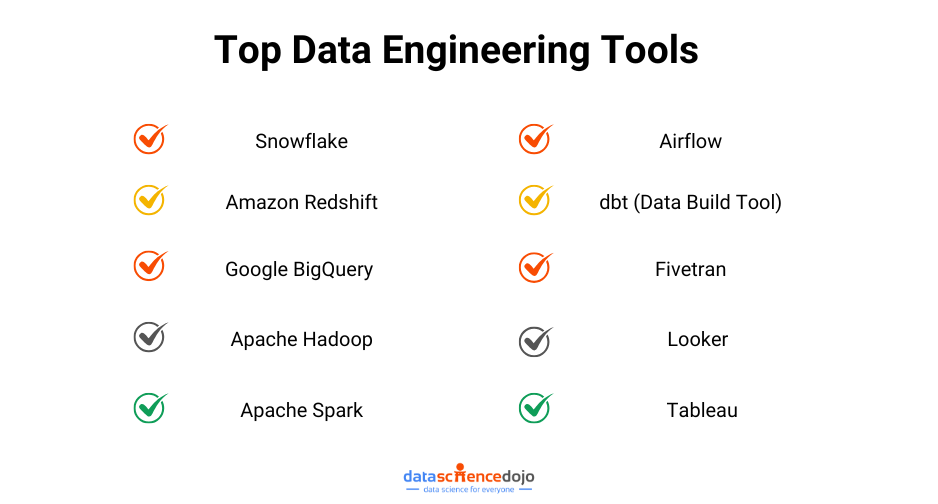
data engineering tools

Top 10 data engineering tools to watch out for in 2023

1. Snowflake:

Snowflake is a cloud-based data warehouse platform that provides high scalability, performance, and ease of use. It allows data engineers to store, manage, and analyze large datasets efficiently. Snowflake’s architecture separates storage and compute, enabling elastic scalability and cost-effective operations. It supports various data types and offers advanced features like data sharing and multi-cluster warehouses.

2. Amazon Redshift:

Amazon Redshift is a cloud-based data warehousing service provided by Amazon Web Services (AWS). It is known for its high performance and cost-effectiveness. Amazon Redshift allows data engineers to analyze large datasets quickly using massively parallel processing (MPP) architecture. It integrates seamlessly with other AWS services and supports various data integration and transformation workflows.

3. Google BigQuery:

Google BigQuery is a serverless, cloud-based data warehouse designed for big data analytics. It offers scalable storage and compute resources, enabling data engineers to process large datasets efficiently. BigQuery’s columnar storage and distributed computing capabilities facilitate fast query performance. It integrates well with other Google Cloud services and supports advanced analytics and machine learning features.

4. Apache Hadoop:

Apache Hadoop is an open-source framework for distributed storage and processing of large datasets. It provides a scalable and fault-tolerant ecosystem for big data processing. Hadoop consists of the Hadoop Distributed File System (HDFS) for distributed storage and the MapReduce programming model for parallel data processing. It supports batch processing and is widely used for data-intensive tasks.

5. Apache Spark:

Apache Spark is an open-source, unified analytics engine designed for big data processing. It provides high-speed, in-memory data processing capabilities and supports various programming languages like Scala, Java, Python, and R. Spark offers a rich set of libraries for data processing, machine learning, graph processing, and stream processing. It can handle both batch and real-time data processing tasks efficiently.

6. Airflow:

Apache Airflow is an open-source platform for orchestrating and scheduling data pipelines. It allows data engineers to define and manage complex workflows as directed acyclic graphs (DAGs). Airflow provides a rich set of operators for tasks like data extraction, transformation, and loading (ETL), and it supports dependency management, monitoring, and retries. It offers extensibility and integration with various data engineering tools.

7. dbt (Data Build Tool):

dbt is an open-source data transformation and modeling tool. It allows data engineers to build, test, and maintain data pipelines in a version-controlled manner. dbt focuses on transforming raw data into analytics-ready tables using SQL-based transformations. It enables data engineers to define data models, manage dependencies, and perform automated testing, making it easier to ensure data quality and consistency.

8. Fivetran:

Fivetran is a cloud-based data integration platform that simplifies the process of loading data from various sources into a data warehouse or data lake. It offers pre-built connectors for a wide range of data sources, enabling data engineers to set up data pipelines quickly and easily. Fivetran automates the data extraction, transformation, and loading processes, ensuring reliable and up-to-date data in the target storage.

9. Looker:

Looker is a business intelligence and data visualization platform. It allows data engineers to create interactive dashboards, reports, and visualizations from data stored in data warehouses or other sources. Looker provides a drag-and-drop interface and a flexible modeling layer that enables data engineers to define data relationships and metrics. It supports collaborative analytics and integrates with various data platforms.

10 Tableau:

Tableau is a widely used business intelligence and data visualization tool. It enables data engineers to create interactive and visually appealing dashboards and reports. Tableau connects to various data sources, including data warehouses, spreadsheets, and cloud services. It provides advanced data visualization capabilities, allowing data engineers to explore and analyze data in a user-friendly and intuitive manner. With Tableau, data engineers can drag and drop data elements to create visualizations, apply filters, and add interactivity to enhance data exploration.

Tool Description
Snowflake A cloud-based data warehouse that is known for its scalability, performance, and ease of use.
Amazon Redshift Another popular cloud-based data warehouse. Amazon Redshift is known for its high performance and cost-effectiveness.
Google BigQuery A cloud-based data warehouse that is known for its scalability and flexibility.
Apache Hadoop An open-source framework for distributed storage and processing of large datasets.
Apache Spark An open-source unified analytics engine for large-scale data processing.
Airflow An open-source platform for building and scheduling data pipelines.
dbt (Data Build Tool) An open-source tool for building and maintaining data pipelines.
Fivetran A cloud-based ETL tool that is used to move data from a variety of sources into a data warehouse or data lake.
Looker A business intelligence platform that is used to visualize and analyze data.
Tableau A business intelligence platform that is used to visualize and analyze data.

Benefits of Data Engineering Tools

  • Efficient Data Management: Extract, consolidate, and store large datasets with improved data quality and consistency.
  • Streamlined Data Transformation: Convert raw data into usable formats at scale, automate tasks, and apply business rules.
  • Workflow Orchestration: Schedule and manage data pipelines for smooth flow and automation.
  • Scalability and Performance: Handle large data volumes with optimized processing capabilities.
  • Seamless Data Integration: Connect and integrate data from diverse sources easily.
  • Data Governance and Security: Ensure compliance and protect sensitive data.
  • Collaborative Workflows: Enable team collaboration and maintain organized workflows.


 Wrapping up

In summary, data engineering tools play a crucial role in managing, processing, and transforming data effectively and efficiently. They provide the necessary functionalities and features to handle big data challenges, streamline data engineering workflows, and ensure the availability of high-quality, well-prepared data for analysis and decision-making.

Data Science Dojo
Safia Faiz
| June 12

Heatmaps are a type of data visualization that uses color to represent data values. For the unversed,
data visualization is the process of representing data in a visual format. This can be done through charts, graphs, maps, and other visual representations.

What are heatmaps?

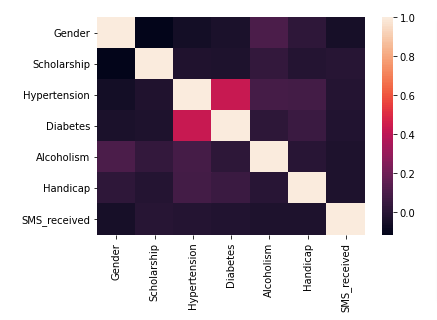
A heatmap is a graphical representation of data in which values are represented as colors on a two-dimensional plane. Typically, heatmaps are used to visualize data in a way that makes it easy to identify patterns and trends.  

Heatmaps are often used in fields such as data analysis, biology, and finance. In data analysis, heatmaps are used to visualize patterns in large datasets, such as website traffic or user behavior.

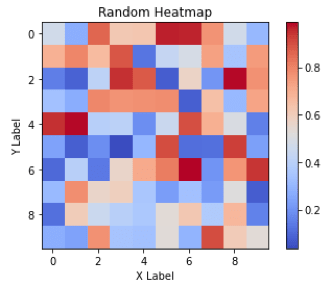
In biology, heatmaps are used to visualize gene expression data or protein-protein interaction networks. In finance, heatmaps are used to visualize stock market trends and performance. This diagram shows a random 10×10 heatmap using `NumPy` and `Matplotlib`.  

Heatmaps
Heatmaps

Advantages of heatmaps

  1. Visual representation: Heatmaps provide an easily understandable visual representation of data, enabling quick interpretation of patterns and trends through color-coded values.
  2. Large data visualization: They excel at visualizing large datasets, simplifying complex information and facilitating analysis.
  3. Comparative analysis: They allow for easy comparison of different data sets, highlighting differences and similarities between, for example, website traffic across pages or time periods.
  4. Customizability: They can be tailored to emphasize specific values or ranges, enabling focused examination of critical information.
  5. User-friendly: They are intuitive and accessible, making them valuable across various fields, from scientific research to business analytics.
  6. Interactivity: Interactive features like zooming, hover-over details, and data filtering enhance the usability of heatmaps.
  7. Effective communication: They offer a concise and clear means of presenting complex information, enabling effective communication of insights to stakeholders.

Creating heatmaps using “Matplotlib” 

We can create heatmaps using Matplotlib by following the aforementioned steps: 

  • To begin, we import the necessary libraries, namely Matplotlib and NumPy.
  • Following that, we define our data as a 3×3 NumPy array.
  • Afterward, we utilize Matplotlib’s imshow function to create a heatmap, specifying the color map as ‘coolwarm’.
  • To enhance the visualization, we incorporate a color bar by employing Matplotlib’s colorbar function.
  • Subsequently, we set the title and axis labels using Matplotlib’s set_title, set_xlabel, and set_ylabel functions.
  • Lastly, we display the plot using the show function.

Bottom line: This will create a simple 3×3 heatmap with a color bar, title, and axis labels. 

Customizations available in Matplotlib for heatmaps 

Following is a list of the customizations available for Heatmaps in Matplotlib: 

  1. Changing the color map 
  2. Changing the axis labels 
  3. Changing the title 
  4. Adding a color bar 
  5. Adjusting the size and aspect ratio 
  6. Setting the minimum and maximum values
  7. Adding annotations 
  8. Adjusting the cell size
  9. Masking certain cells 
  10. Adding borders 

These are just a few examples of the many customizations that can be done in heatmaps using Matplotlib. Now, let’s see all the customizations being implemented in a single example code snippet: 

In this example, the heatmap is customized in the following ways: 

  1. Set the colormap to ‘coolwarm’
  2. Set the minimum and maximum values of the colormap using `vmin` and `vmax`
  3. Set the size of the figure using `figsize`
  4. Set the extent of the heatmap using `extent`
  5. Set the linewidth of the heatmap using `linewidth`
  6. Add a colorbar to the figure using the `colorbar`
  7. Set the title, xlabel, and ylabel using `set_title`, `set_xlabel`, and `set_ylabel`, respectively
  8. Add annotations to the heatmap using `text`
  9. Mask certain cells in the heatmap by setting their values to `np.nan`
  10. Show the frame around the heatmap using `set_frame_on(True)`

Creating heatmaps using “Seaborn” 

We can create heatmaps using Seaborn by following the aforementioned steps: 

  • First, we import the necessary libraries: seaborn, matplotlib, and numpy.
  • Next, we generate a random 10×10 matrix of numbers using NumPy’s rand function and store it in the variable data.
  • We create a heatmap by using Seaborn’s heatmap function. It takes the data as input and specifies the color map using the cmap parameter. Additionally, we set the annot parameter to True to display the values in each cell of the heatmap.
  • To enhance the plot, we add a title, x-label, and y-label using Matplotlib’s title, xlabel, and ylabel functions.
  • Finally, we display the plot using the show function from Matplotlib.

Overall, the code generates a random heatmap using Seaborn with a color map, annotations, and labels using Matplotlib. 

Customizations available in Seaborn for heatmaps:

Following is a list of the customizations available for Heatmaps in Seaborn: 

  1. Change the color map 
  2. Add annotations to the heatmap cells
  3. Adjust the size of the heatmap 
  4. Display the actual numerical values of the data in each cell of the heatmap
  5. Add a color bar to the side of the heatmap
  6. Change the font size of the heatmap 
  7. Adjust the spacing between cells 
  8. Customize the x-axis and y-axis labels
  9. Rotate the x-axis and y-axis tick labels

Now, let’s see all the customizations being implemented in a single example code snippet:

In this example, the heatmap is customized in the following ways: 

  1. Set the color palette to “Blues”.
  2. Add annotations with a font size of 10.
  3. Set the x and y labels and adjust font size.
  4. Set the title of the heatmap.
  5. Adjust the figure size.
  6. Show the heatmap plot.

Limitations of heatmaps:

Heatmaps are a useful visualization tool for exploring and analyzing data, but they do have some limitations that you should be aware of: 

  • Limited to two-dimensional data: They are designed to visualize two-dimensional data, which means that they are not suitable for visualizing higher-dimensional data.
  • Limited to continuous data: They are best suited for continuous data, such as numerical values, as they rely on a color scale to convey the information. Categorical or binary data may not be as effectively visualized using heatmaps.
  • May be affected by color blindness: Some people are color blind, which means that they may have difficulty distinguishing between certain colors. This can make it difficult for them to interpret the information in a heatmap.


  • Can be sensitive to scaling: The color mapping in a heatmap is sensitive to the scale of the data being visualized. Therefore, it is important to carefully choose the color scale and to consider normalizing or standardizing the data to ensure that the heatmap accurately represents the underlying data.
  • Can be misleading: They can be visually appealing and highlight patterns in the data, but they can also be misleading if not carefully designed. For example, choosing a poor color scale or omitting important data points can distort the visual representation of the data.

It is important to consider these limitations when deciding whether or not to use a heatmap for visualizing your data. 

Conclusion

Heatmaps are powerful tools for visualizing data patterns and trends. They find applications in various fields, enabling easy interpretation and analysis of large datasets. Matplotlib and Seaborn offer flexible options to create and customize heatmaps. However, it’s essential to understand their limitations, such as two-dimensional data representation and sensitivity to color perception. By considering these factors, heatmaps can be a valuable asset in gaining insights and communicating information effectively.

Mubashir Rizvi - Author
Syed Muhammad Mubashir Rizvi
| May 29

Unlock the full potential of your data with the power of data visualization! Go through this blog and discover why visualizations are crucial in Data Science and explore the most effective and game-changing types of visualizations that will revolutionize the way you interpret and extract insights from your data. Get ready to take your data analysis skills to the next level! 

What is data visualization?

Data visualization involves using different charts, graphs, and other visual elements to represent data and information graphically and the purpose of it is to make complex and hard to understand and complex datasets easily understandable, accessible, and interpretable.

This powerful tool enables businesses to explore, analyze and identify trends, patterns and relationships from the raw data that are usually hidden by just looking at the data itself or its statistics. 

Data visualization guide

By mastering the ability of data visualization, businesses and organizations can make effective and important decisions and actions based on the data and the insights gained. These decisions are additionally referred to as ‘Data-Driven Decisions’. By presenting data in a visual format, analysts can effectively communicate their findings to their team and to their clients, which is a challenging task as clients sometimes can’t interpret raw data and need a medium that they can interpret easily. 

Importance of data visualization

Here is a list of some benefits data visualization offers that make us understand its importance and its usefulness: 

1. Simplifying complex data: It enables complex data to be presented in a simplified and understandable manner. By using visual representations such as graphs and charts, data can be made more accessible to individuals who are not familiar with the underlying data. 

2. Enhancing insights: It can help to identify patterns and trends that might not be immediately apparent from raw data. By presenting data visually, it is easier to identify correlations and relationships between variables, enabling analysts to draw insights and make more informed decisions. 

3. Enhanced communication: It makes it easier to communicate complex data to a wider audience, including non-technical stakeholders in a way that is easy to understand and engage with. Visualizations can be used to tell a story, convey complex information, and facilitate collaboration among stakeholders, team members, and decision makers. 

4. Increasing efficiency: It can save time and increase efficiency by enabling analysts to quickly identify patterns and relationships in raw data. This can help to streamline the analysis process and enable analysts to focus their efforts on areas that are most likely to yield insights. 

5. Identifying anomalies and errors: It can help to identify errors or anomalies in the data. By presenting data visually, it is easier to spot outliers or unusual patterns that might indicate errors in data collection or processing. This can help analysts to clean and refine the data, ensuring that the insights derived from the data are accurate and reliable. 

6. Faster and more effective decision-making: It can help you make more informed and data-driven decisions by presenting information in a way that is easy to digest and interpret. Visualizations can help you identify key trends, outliers, and insights that can inform your decision-making, leading to faster and more effective outcomes. 

7. Improved data exploration and analysis: It enables you to explore and analyze your data in a more intuitive and interactive way. By visualizing data in different formats and at different levels of detail, you can gain new insights and identify areas for further exploration and analysis. 

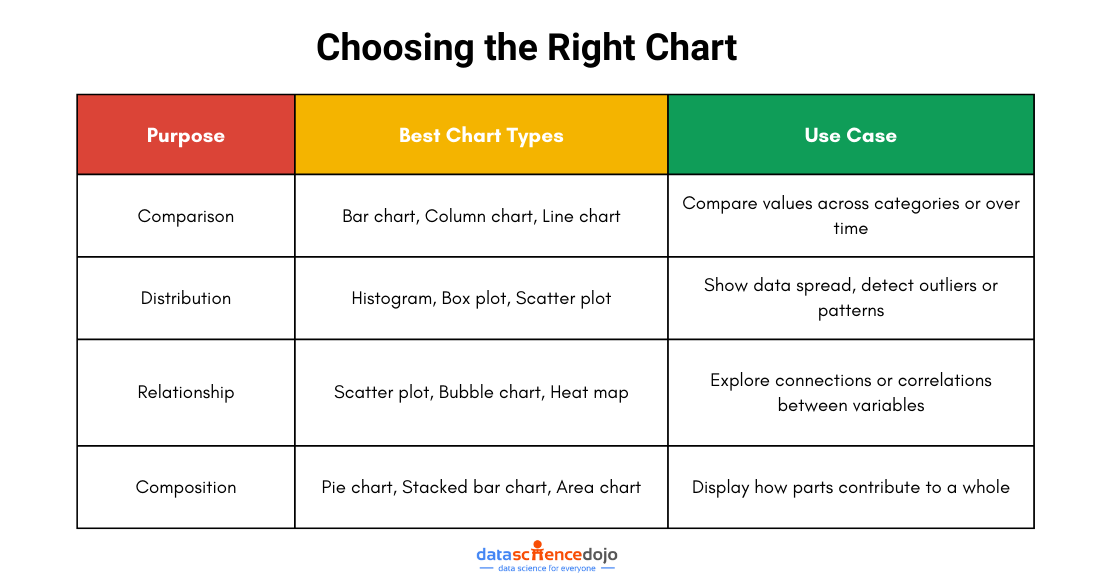
Choosing the right type of visualization 

This is the only challenge faced when working with data visualizations, and to master this skill completely, you must have a clear idea about choosing the right type of visual for creating amazing, clear, attractive, and pleasing visuals. Keeping the following points in mind will help you in this: 

Identify purpose  

Before starting to create your visualization, it’s important to identify what your purpose is. Your purpose may include comparing different values and examining distributions, relationships, or compositions of variables. This step is important as each purpose has a different type of visualization that suits it best.

Understanding audience  

You can get help in choosing the best type of visualization for your message if you know about your audience, their preferences, and in which context they will view your visualization. This is useful as different visualizations are more effective with different audiences. 

Types of data visualization

Selecting the appropriate visual

Once you have identified your purpose and your audience, the final step is choosing the appropriate visualization to convey your message, some common visuals include: 

  1. Comparison Charts: compare different groups/categories. 
  2. Distribution Charts: show distributions of a variable. 
  3. Relationship Charts: show the relationship between two or more variables. 
  4. Composition Charts: show how a whole part is divided into its parts.

Ethics of data visualization & avoiding misleading representations 

In many cases, data visualization may also be used to misinterpret information intentionally or unintentionally. An example includes manipulating data by using specific scales or omitting specific data points to support a particular narrative and not showing the actual view of the data. Some considerations regarding the ethics of data visualization include: 

  1. Accuracy of data: Data should be accurate and should not be presented in a way to misinterpret information. 
  2. Appropriateness of visualization type: The type of visual selected should be appropriate for the data being presented and the message being conveyed. 
  3. Clarity of message: The message conveyed through visualization should be clear and easy to understand. 
  4. Avoiding bias and discrimination: Each data visualization should be clear of bias and discrimination. 

Avoiding misleading representations 

You want to represent your data in the most efficient way possible which can be easily interpreted and free of ambiguities, now that’s not always the case, there are times when your data can mislead your visualization and convey the wrong message. In those cases, you can take help from the following points to avoid misleadingness: 

  • Use consistent scales and axes in your charts and graphs. 
  • Avoid using truncated axes and skewed data ranges which cause data to appear less significant. 
  • Label your data points and axes properly for clarity. 
  • Avoid cherry-picking the data to support a particular narrative. 
  • Provide clear and concise context for the data you are presenting. 

Types of data visualizations

There are numerous visualizations available, each with its own use and importance, and the choice of a visual depends on your need i.e., what kind of data you want to analyze, and what type of insight are you looking for. Nonetheless, here are some most common visuals used in data science:

  • Bar Charts: Bar charts are normally used to compare categorical data, such as the frequency or proportion of different categories. They are used to visualize data that can be organized or split into different discrete groups or categories.
  • Line Graphs: Line graphs are a type of visualization that uses lines to represent data values. They are typically used to represent continuous data.
  • Scatter Plots: Scatter plot is a type of data visualization that displays the relationship between two quantitative (numerical) variables.  They are used to explore and analyze the correlation or association between two continuous variables.
  • Histograms: A histogram graph represents the distribution of a continuous numerical variable by dividing it into intervals and counting the number of observations. They are used to visualize the shape and spread of data.


  • Heatmaps: Heatmaps are commonly used to show the relationships between two variables, such as the correlation between different features in a dataset. 
  • Box and Whisker Plots:  They are also known as boxplots and are used to display the distribution of a dataset. A box plot consists of a box that spans the first quartile (Q1) to the third quartile (Q3) of the data, with a line inside the box representing the median.
  • Count Plots: A count plot is a type of bar chart that displays the number of occurrences of a categorical variable. The x-axis represents the categories, and the y-axis represents the count or frequency of each category.
  • Point Plots: A point plot is a type of line graph that displays the mean (or median) of a continuous variable for each level of a categorical variable. They are useful for comparing the values of a continuous variable across different levels.
  • Choropleth Maps: Choropleth map is a type of geographical visualization that uses color to represent data values for different geographic regions, such as countries, states, or counties.
  • Tree Maps: This visualization is used to display hierarchical data as nested rectangles, with each rectangle representing a node in the hierarchy. Treemaps are useful for visualizing complex hierarchical data in a way that highlights the relative sizes and values of different nodes. 


Conclusion

So, this blog was all about introducing you to this powerful tool in the world of data science. Now you have a clear idea about what data visualization is, and what is its importance for analysts, businesses, and stakeholders.

You also learned about how you can choose the right type of visual, the ethics of data visualization and got familiar with 10 new different data visualizations and how they look like. The next step for you is to learn about how you can create these visuals using Python libraries such as matplotlib, seaborn and plotly. 

Data Science Dojo
Safia Faiz
| May 23

Researchers, statisticians, and data analysts rely on histograms to gain insights into data distributions, identify patterns, and detect outliers. Data scientists and machine learning practitioners use histograms as part of exploratory data analysis and feature engineering. Overall, anyone working with numerical data and seeking to gain a deeper understanding of data distributions can benefit from information on histograms.

Defining histograms

A histogram is a type of graphical representation of data that shows the distribution of numerical values. It consists of a set of vertical bars, where each bar represents a range of values, and the height of the bar indicates the frequency or count of data points falling within that range.   

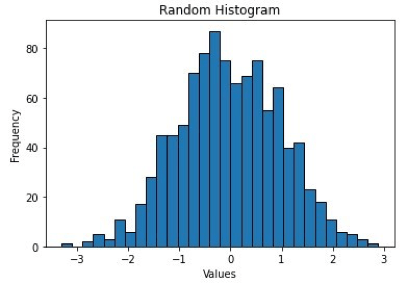
Histograms
Histograms

Histograms are commonly used in statistics and data analysis to visualize the shape of a data set and to identify patterns, such as the presence of outliers or skewness. They are also useful for comparing the distribution of different data sets or for identifying trends over time. 

The picture above shows how 1000 random data points from a normal distribution with a mean of 0 and standard deviation of 1 are plotted in a histogram with 30 bins and black edges.  

Advantages of histograms

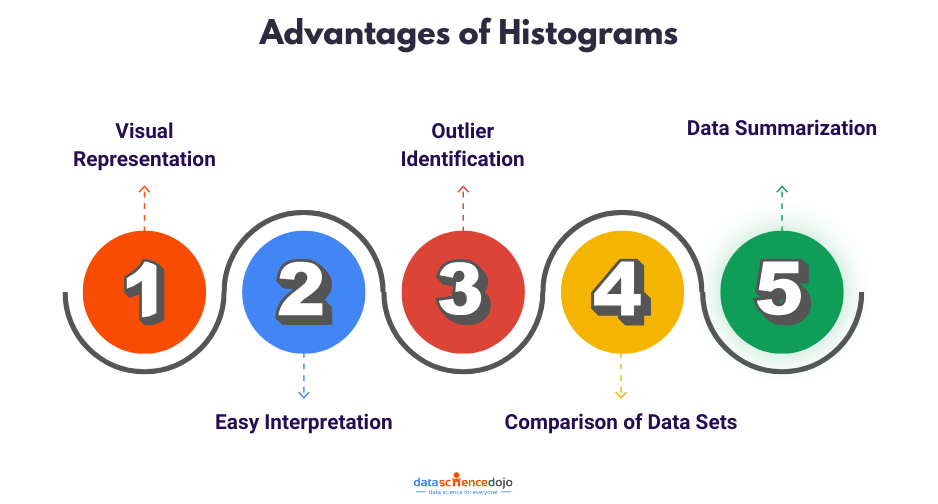
  • Visual Representation: Histograms provide a visual representation of the distribution of data, enabling us to observe patterns, trends, and anomalies that may not be apparent in raw data.
  • Easy Interpretation: Histograms are easy to interpret, even for non-experts, as they utilize a simple bar chart format that displays the frequency or proportion of data points in each bin.
  • Outlier Identification: Histograms are useful for identifying outliers or extreme values, as they appear as individual bars that significantly deviate from the rest of the bars.
  • Comparison of Data Sets: Histograms facilitate the comparison of distribution between different data sets, enabling us to identify similarities or differences in their patterns.
  • Data Summarization: Histograms are effective for summarizing large amounts of data by condensing the information into a few key features, such as the shape, center, and spread of the distribution.

Creating a histogram using Matplotlib library

We can create histograms using Matplotlib by following a series of steps. Following the import statements of the libraries, the code generates a set of 1000 random data points from a normal distribution with a mean of 0 and standard deviation of 1, using the `numpy.random.normal()` function. 

  1. The plt.hist() function in Python is a powerful tool for creating histograms. By providing the data, number of bins, bar color, and edge color as input, this function generates a histogram plot.
  2. To enhance the visualization, the xlabel(), ylabel(), and title() functions are utilized to add labels to the x and y axes, as well as a title to the plot.
  3. Finally, the show() function is employed to display the histogram on the screen, allowing for detailed analysis and interpretation.

Overall, this code generates a histogram plot of a set of random data points from a normal distribution, with 30 bins, blue bars, black edges, labeled axes, and a title. The histogram shows the frequency distribution of the data, with a bell-shaped curve indicating the normal distribution.  

Customizations available in Matplotlib for histograms  

In Matplotlib, there are several customizations available for histograms. These include:

  1. Adjusting the number of bins.
  2. Changing the color of the bars.
  3. Changing the opacity of the bars.
  4. Changing the edge color of the bars.
  5. Adding a grid to the plot.
  6. Adding labels and a title to the plot.
  7. Adding a cumulative density function (CDF) line.
  8. Changing the range of the x-axis.
  9. Adding a rug plot.

Now, let’s see all the customizations being implemented in a single example code snippet: 

In this example, the histogram is customized in the following ways: 

  • The number of bins is set to `20` using the `bins` parameter.
  • The transparency of the bars is set to `0.5` using the `alpha` parameter.
  • The edge color of the bars is set to `black` using the `edgecolor` parameter.
  • The color of the bars is set to `green` using the `color` parameter.
  • The range of the x-axis is set to `(-3, 3)` using the `range` parameter.
  • The y-axis is normalized to show density using the `density` parameter.
  • Labels and a title are added to the plot using the `xlabel()`, `ylabel()`, and `title()` functions.
  • A grid is added to the plot using the `grid` function.
  • A cumulative density function (CDF) line is added to the plot using the `cumulative` parameter and `histtype=’step’`.
  • A rug plot showing individual data points is added to the plot using the `plot` function.

Creating a histogram using ‘Seaborn’ library: 

We can create histograms using Seaborn by following the steps: 

  • First and foremost, importing the libraries: `NumPy`, `Seaborn`, `Matplotlib`, and `Pandas`. After importing the libraries, a toy dataset is created using `pd.DataFrame()` of 1000 samples that are drawn from a normal distribution with mean 0 and standard deviation 1 using NumPy’s `random.normal()` function. 
  • We use Seaborn’s `histplot()` function to plot a histogram of the ‘data’ column of the DataFrame with `20` bins and a `blue` color. 
  • The plot is customized by adding labels, and a title, and changing the style to a white grid using the `set_style()` function. 
  • Finally, we display the plot using the `show()` function from matplotlib. 


Overall, this code snippet demonstrates how to use Seaborn to plot a histogram of a dataset and customize the appearance of the plot quickly and easily. 

Customizations available in Seaborn for histograms

Following is a list of the customizations available for Histograms in Seaborn: 

  1. Change the number of bins.
  2. Change the color of the bars.
  3. Change the color of the edges of the bars.
  4. Overlay a density plot on the histogram.
  5. Change the bandwidth of the density plot.
  6. Change the type of histogram to cumulative.
  7. Change the orientation of the histogram to horizontal.
  8. Change the scale of the y-axis to logarithmic.

Now, let’s see all these customizations being implemented here as well, in a single example code snippet: 

In this example, we have done the following customizations:

  1. Set the number of bins to `20`.
  2. Set the color of the bars to `green`.
  3. Set the `edgecolor` of the bars to `black`.
  4. Added a density plot overlaid on top of the histogram using the `kde` parameter set to `True`.
  5. Set the bandwidth of the density plot to `0.5` using the `kde_kws` parameter.
  6. Set the histogram to be cumulative using the `cumulative` parameter.
  7. Set the y-axis scale to logarithmic using the `log_scale` parameter.
  8. Set the title of the plot to ‘Customized Histogram’.
  9. Set the x-axis label to ‘Values’.
  10. Set the y-axis label to ‘Frequency’.

Limitations of Histograms: 

Histograms are widely used for visualizing the distribution of data, but they also have limitations that should be considered when interpreting them. These limitations are jotted down below: 

  1. They can be sensitive to the choice of bin size or the number of bins, which can affect the interpretation of the distribution. Choosing too few bins can result in a loss of information while choosing too many bins can create artificial patterns and noise.
  2. They can be influenced by outliers, which can skew the distribution or make it difficult to see patterns in the data.
  3. They are typically univariate and cannot capture relationships between multiple variables or dimensions of data.
  4. Histograms assume that the data is continuous and does not work well with categorical data or data with large gaps between values.
  5. They can be affected by the choice of starting and ending points, which can affect the interpretation of the distribution.
  6. They do not provide information on the shape of the distribution beyond the binning intervals.

 It’s important to consider these limitations when using histograms and to use them in conjunction with other visualization techniques to gain a more complete understanding of the data. 

 Wrapping up

In conclusion, histograms are powerful tools for visualizing the distribution of data. They provide valuable insights into the shape, patterns, and outliers present in a dataset. With their simplicity and effectiveness, histograms offer a convenient way to summarize and interpret large amounts of data.

By customizing various aspects such as the number of bins, colors, and labels, you can tailor the histogram to your specific needs and effectively communicate your findings. So, embrace the power of histograms and unlock a deeper understanding of your data.

Data Science Dojo
Yogini Kuyate
| May 22

Data visualization is the art of presenting complex information in a way that is easy to understand and analyze. With the explosion of data in today’s business world, the ability to create compelling data visualizations has become a critical skill for anyone working with data.

Whether you’re a business analyst, data scientist, or marketer, the ability to communicate insights effectively is key to driving business decisions and achieving success. 

In this article, we’ll explore the art of data visualization and how it can be used to tell compelling stories with business analytics. We’ll cover the key principles of data visualization and provide tips and best practices for creating stunning visualizations. So, grab your favorite data visualization tool, and let’s get started! 

Data visualization in business analytics  
Data visualization in business analytics

Importance of data visualization in business analytics  

Data visualization is the process of presenting data in a graphical or pictorial format. It allows businesses to quickly and easily understand large amounts of complex information, identify patterns, and make data-driven decisions. Good data visualization can spot the difference between an insightful analysis and a meaningless spreadsheet. It enables stakeholders to see the big picture and identify key insights that may have been missed in a traditional report. 

Benefits of data visualization 

Data visualization has several advantages for business analytics, including 

1. Improved communication and understanding of data 

Visualizations make it easier to communicate complex data to stakeholders who may not have a background in data analysis. By presenting data in a visual format, it is easier to understand and interpret, allowing stakeholders to make informed decisions based on data-driven insights. 

2. More effective decision making 

Data visualization enables decision-makers to identify patterns, trends, and outliers in data sets, leading to more effective decision-making. By visualizing data, decision-makers can quickly identify correlations and relationships between variables, leading to better insights and more informed decisions. 

3. Enhanced ability to identify patterns and trends 

Visualizations enable businesses to identify patterns and trends in their data that may be difficult to detect using traditional data analysis methods. By identifying these patterns, businesses can gain valuable insights into customer behavior, product performance, and market trends. 

4. Increased engagement with data 

Visualizations make data more engaging and interactive, leading to increased interest and engagement with data. By making data more accessible and interactive, businesses can encourage stakeholders to explore data more deeply, leading to a deeper understanding of the insights and trends 

5. Principles of effective data visualization 

Effective data visualization is more than just putting data into a chart or graph. It requires careful consideration of the audience, the data, and the message you are trying to convey. Here are some principles to keep in mind when creating effective data visualizations: 

6. Know your audience

Understanding your audience is critical to creating effective data visualizations. Who will be viewing your visualization? What are their backgrounds and areas of expertise? What questions are they trying to answer? Knowing your audience will help you choose the right visualization format and design a visualization that is both informative and engaging. 

7. Keep it simple 

Simplicity is key when it comes to data visualization. Avoid cluttered or overly complex visualizations that can confuse or overwhelm your audience. Stick to key metrics or data points, and choose a visualization format that highlights the most important information. 

8. Use the right visualization format 

Choosing the right visualization format is crucial to effectively communicate your message. There are many different types of visualizations, from simple bar charts and line graphs to more complex heat maps and scatter plots. Choose a format that best suits the data you are trying to visualize and the story you are trying to tell. 

9. Emphasize key findings 

Make sure your visualization emphasizes the key findings or insights that you want to communicate. Use color, size, or other visual cues to draw attention to the most important information. 

10. Be consistent 

Consistency is important when creating data visualizations. Use a consistent color palette, font, and style throughout your visualization to make it more visually appealing and easier to understand. 

Tools and techniques for data visualization 

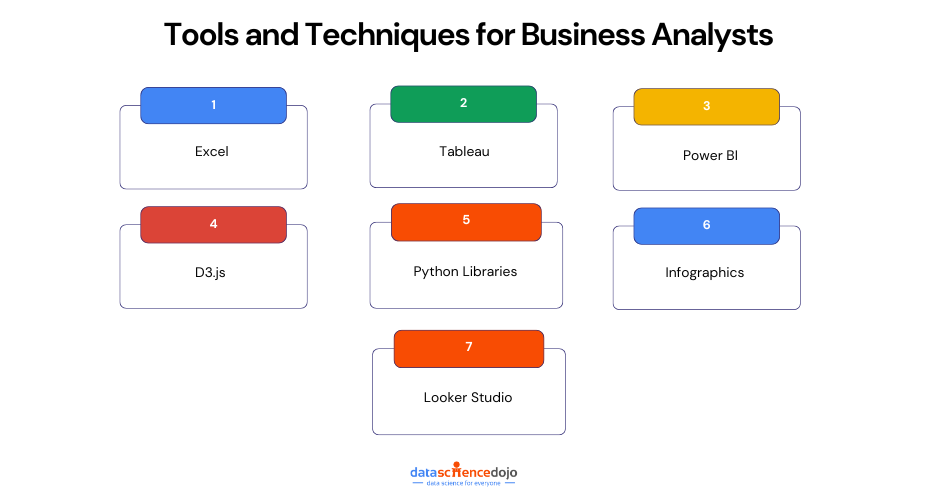
There are many tools and techniques available to create effective data visualizations. Some of them are:

1. Excel 

Microsoft Excel is one of the most commonly used tools for data visualization. It offers a wide range of chart types and customization options, making it easy to create basic visualizations.

2. Tableau 

Tableau is a powerful data visualization tool that allows users to connect to a wide range of data sources and create interactive dashboards and visualizations. Tableau is easy to use and provides a range of visualization options that are customizable to suit different needs. 

3. Power BI 

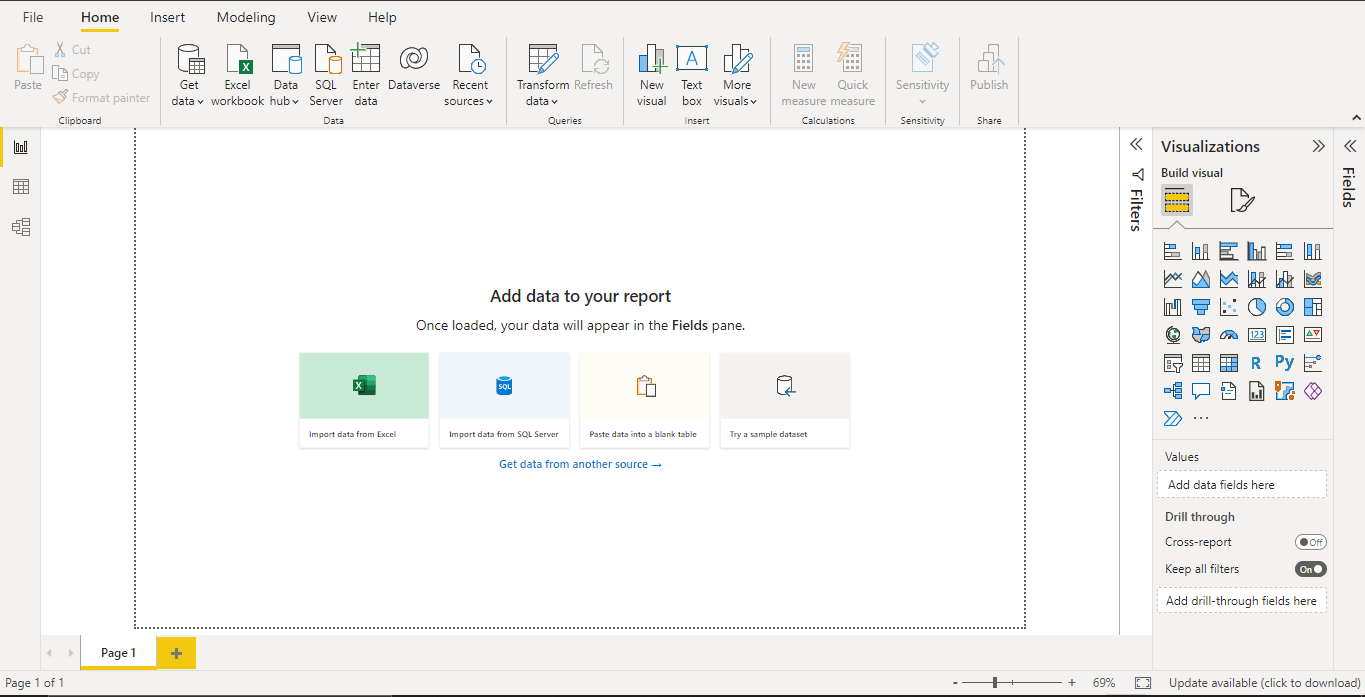
Microsoft Power BI is another popular data visualization tool that allows you to connect to various data sources and create interactive visualizations, reports, and dashboards. It offers a range of customizable visualization options and is easy to use for beginners.  

4. D3.js 

D3.js is a JavaScript library used for creating interactive and customizable data visualizations on the web. It offers a wide range of customization options and allows for complex visualizations. 

5. Python Libraries 

Python libraries such as Matplotlib, Seaborn, and Plotly can be used for data visualization. These libraries offer a range of customizable visualization options and are widely used in data science and analytics. 

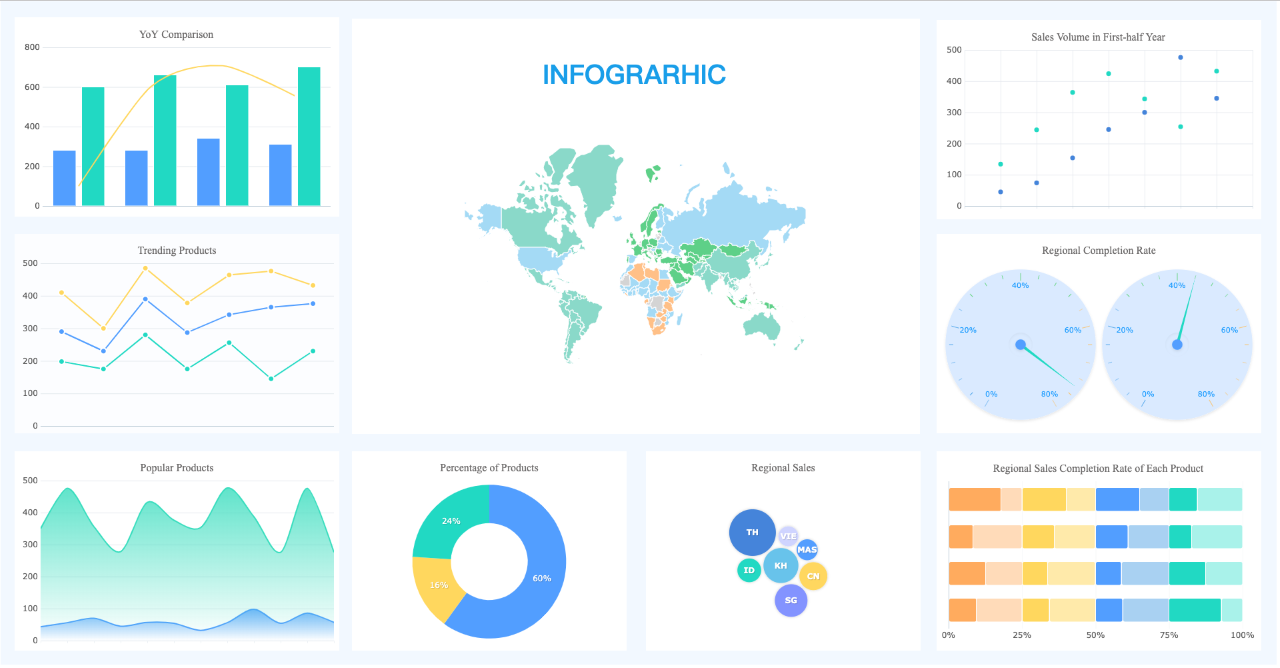
6. Infographics 

Infographics are a popular tool for visual storytelling and data visualization. They combine text, images, and data visualizations to communicate complex information in a visually appealing and easy-to-understand way. 

7. Looker Studio 

Looker Studio is a free data visualization tool that allows users to create interactive reports and dashboards using a range of data sources. Looker Studio is known for its ease of use and its integration with other Google products. 

Data Visualization in action: Examples from business analytics 

To illustrate the power of data visualization in business analytics, let’s take a look at a few examples: 

  1. Sales Performance Dashboard

A sales performance dashboard is a visual representation of sales data that provides insight into sales trends, customer behavior, and product performance. The dashboard may include charts and graphs that show sales by region, product, and customer segment. By analyzing this data, businesses can identify opportunities for growth and optimize their sales strategy. 

  1. Website analytics dashboard

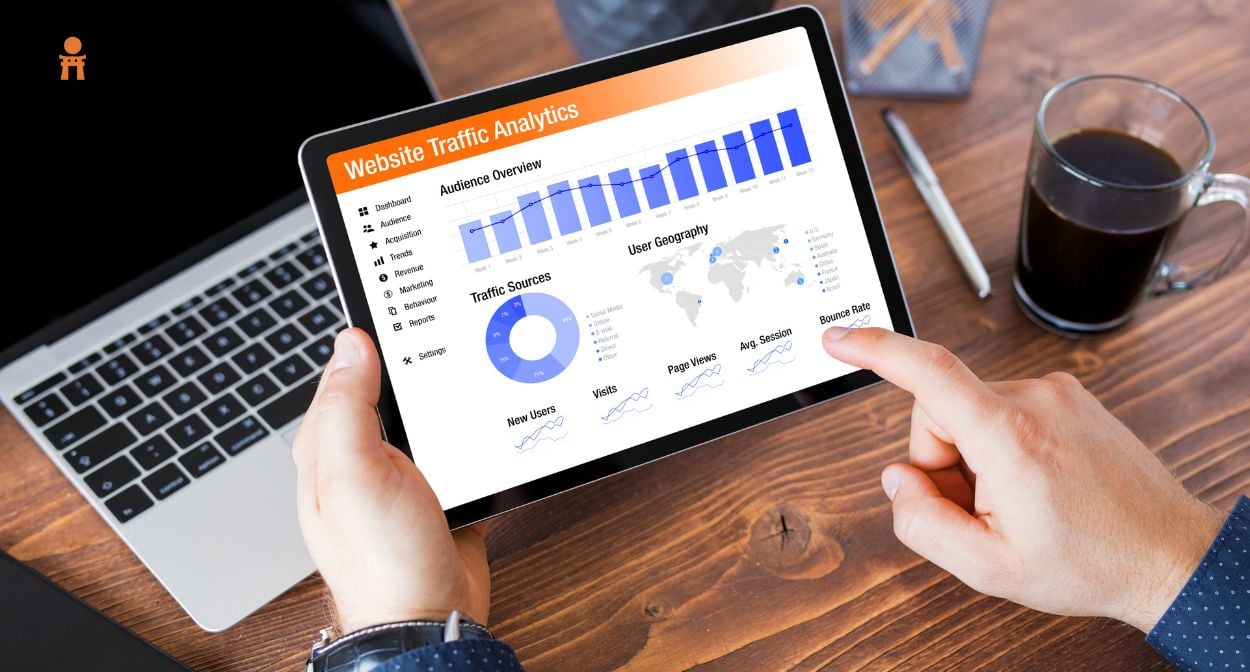
A website analytics dashboard is a visual representation of website performance data that provides insight into visitor behavior, content engagement, and conversion rates. The dashboard may include charts and graphs that show website traffic, bounce rates, and conversion rates. By analyzing this data, businesses can optimize their website design and content to improve user experience and drive conversions. 

  1. Social media analytics dashboard

A social media analytics dashboard is a visual representation of social media performance data that provides insight into engagement, reach, and sentiment. The dashboard may include charts and graphs that show engagement rates, follower growth, and sentiment analysis. By analyzing this data, businesses can optimize their social media strategy and improve engagement with their audience. 

Frequently Asked Questions (FAQs) 

Q: What is data visualization? 

A: Data visualization is the process of transforming complex data into visual representations that are easy to understand. 

Q: Why is data visualization important in business analytics?

A: Data visualization is important in business analytics because it enables businesses to communicate insights, trends, and patterns to key stakeholders in a way that is both clear and engaging. 

Q: What are some common mistakes in data visualization? 

A: Common mistakes in data visualization include overloading with data, using inappropriate visualizations, ignoring the audience, and being too complicated. 

Conclusion 

In conclusion, the art of data visualization is an essential skill for any business analyst who wants to tell compelling stories via data. Through effective data visualization, you can communicate complex information in a clear and concise way, allowing stakeholders to understand and act upon the insights provided. By using the right tools and techniques, you can transform your data into a compelling narrative that engages your audience and drives business growth. 

Safa Rizwan - Author Image
Safa Rizwan
| April 28

Line plots or line graphs are a fundamental type of chart used to represent data points connected by straight lines. They are widely used to illustrate trends or changes in data over time or across categories. Line plots are easy to understand, versatile, and can be used to visualize different types of data, making them useful tools in data analysis and communication.

Advantages of line plots:

Line plots can be useful for visualizing many different types of data, including:

  1. Time series data visualization: They are useful for visualizing time series data, which refers to data that is collected over time. By plotting data points on a line, trends and patterns over time can be easily identified and communicated.
  2. Continuous data representation: They can be used to represent continuous data, which is data that can take on any value within a range. By plotting the values along a continuous scale, the line plot can show the progression of the data and highlight any trends.
  3. Discrete data representation: They can also be used to represent discrete data, which is data that can only take on certain values. By plotting the values as individual points along the x-axis, the line plot can show how the values are distributed and any outliers.
  4. Easy to understand: They are simple and easy to read, making them an effective way to communicate trends in data to a wide audience. The basic format of a line plot, with data points connected by a line, is intuitive and requires little explanation.
  5. Versatility: They can be used to visualize a wide variety of data types, including both quantitative and qualitative data. They can also be customized to suit different needs, such as by changing the scale, adding labels or annotations, and adjusting the color scheme.
  6. Identifying patterns and trends: They can be useful for identifying patterns and trends in data, such as upward or downward trends, cyclical patterns, or seasonal trends. By visually representing the data in a line plot, it becomes easier to spot trends and make predictions about future outcomes.

Creating line plots:

When it comes to creating line plots in Python, you have two primary libraries to choose from: `Matplotlib` and `Seaborn`.

Using “Matplotlib”:

`Matplotlib` is a highly customizable library that can produce a wide range of plots, including line plots. With Matplotlib, you can specify the appearance of your line plots using a variety of options such as line style, color, marker, and label.

1. “Single” line plot:

A single-line plot is used to display the relationship between two variables, where one variable is plotted on the x-axis and the other on the y-axis. This type of plot is best used for displaying trends over time, as it allows you to see how one variable changes in response to the other over a continuous period.

In this example, two lists named x and y are defined to hold the data points to be plotted. The plt.plot() function is used to plot the points on a line graph, and plt.show() function is used to display the plot.

This creates a simple line plot with the x-axis displaying the values [1, 2, 3, 4, 5] and the y-axis displaying the values [2, 4, 6, 8, 10].

2. “Multiple” lines on one plot:

A plot with multiple lines is useful for comparing trends between different groups or categories. Multiple lines can be plotted on the same graph using different colors. This type of plot is particularly useful for analyzing data with multiple variables or for comparing data across different groups.

In this example, we have two lists y1 and y2 containing data points for two different lines. We use the plt.plot() function twice to plot both lines on the same graph. We add a legend using the plt.legend() function to distinguish between the two lines.

The legend is created by providing a list of labels for each line, and the loc parameter is used to position the legend on the graph. Additionally, we add x-axis and y-axis labels and a title to the graph using the plt.xlabel(), plt.ylabel(), and plt.title() functions.

3. “Customized” line plot:

`Matplotlib` is a popular data visualization library in Python that allows you to create both single-line plots and plots with multiple lines. With `Matplotlib`, you can customize your plots with various colors, line styles, and markers to make them more visually appealing and informative.

In this code snippet, x and y lists are defined as before, and then a line plot is created using the plt.plot() function with customized settings.

The line color is set to green using the color parameter, and the line style is set to dashed using the linestyle parameter. The linewidth parameter is set to 2 to make the line thicker.

Markers are added to each data point using the marker parameter, which is set to 'o' to create circular markers. The face color of the markers is set to blue using the markerfacecolor parameter, and the size of the markers is set to 8 using the markersize parameter.

Finally, x-axis and y-axis labels are added to the plot using the plt.xlabel() and plt.ylabel() functions, and a title is added using the plt.title() function.

4. Adding a regression line:

It is possible to plot a regression line using the `Matplotlib` library in Python. Although `Seaborn` offers convenient functions for regression plot, `Matplotlib` has the capability to create various types of visualizations, including regression plots.

  • This code begins by importing the necessary libraries, numpy and matplotlib.pyplot.
  • Next, it generates a set of 100 random data points and stores them in the variables x and y.
  • A scatter plot is created using the scatter function from matplotlib, which takes x and y as inputs.
  • To fit a linear regression line to the data points, the polyfit function from numpy is used to calculate the coefficients of the line.
  • The plot function from matplotlib is then used to plot the regression line using the coefficients m and b along with x and m*x+b.
  • To improve the readability of the plot, the title, xlabel, and ylabel functions are used to set the title and axis labels.
  • Finally, the show function is called to display the plot on the screen.

Using “Seaborn”:

`Seaborn` is a library that specializes in statistical visualization. Seaborn provides several types of line plots, including those with regression lines, confidence intervals, and error bars.

1. “Single” line plot:

Visualizing data with a single line plot and multiple lines on one plot using `Seaborn` are two ways of representing data in a graphical format. A single-line plot is useful when the data being presented involves only one variable, such as time series data. It allows for the visualization of trends and patterns over time, making it an effective tool for analyzing data.

The code provided loads the tips dataset from Seaborn library and generates a basic line plot. The total_bill variable is plotted on the x-axis and the tip variable is plotted on the y-axis.

2. “Multiple” lines on one plot:

When there are multiple variables involved, a line plot with multiple lines using `Seaborn` can be more effective. This method allows for the comparison of different variables on the same graph, making it easier to identify patterns and relationships between them.

The code shown loads the exercise dataset from Seaborn and generates a line plot using time on the x-axis and pulse on the y-axis. The hue parameter is used to group the data by the kind variable, which creates multiple lines on the plot, with each line representing a different exercise activity.

3. “Customized” line plot:

`Seaborn` also provides various customization options, including color schemes and markers, which can be used to make the graph more visually appealing and informative.

The code loads the fmri dataset from Seaborn and creates a line plot with timepoint on the x-axis and signal on the y-axis. The hue parameter is used to group the data by the region variable, while the style parameter is used to group the data by the event variable.

Moreover, the markers parameter is set to True, which causes the plot to display markers at each data point, while dashes parameter is set to False, causing the plot to display solid lines. These parameter settings are useful for visualizing the data clearly and making it easier to interpret.

4. Adding a regression line:

`Seaborn` provides a wide range of tools to create stunning and informative plots. One of its key features is the ability to add a regression line to a plot, which can help to identify the relationship between two variables and make predictions based on that relationship.

The code above loads the anscombe dataset from Seaborn, which contains four different datasets. It then creates a set of line plots with x on the x-axis and y on the y-axis, one for each dataset.

The col parameter is used to create a separate plot for each dataset, which means that each dataset will have its own subplot in the figure. The hue parameter is used to color the lines by the dataset, so that each dataset’s line will be a different color.
The lmplot() function is used to add a regression line to each plot. This line represents the linear relationship between x and y in the dataset.

The other parameters, such as col_wrap, ci, palette, and scatter_kws, are used to customize the appearance of the plot. For example, col_wrap specifies how many subplots should be shown per row, ci controls the confidence interval for the regression line, palette specifies the color palette to use, and scatter_kws specifies additional keyword arguments for the scatter plot.

Limitations of line plots:

Line plots have some limitations that need to be considered when using them for data visualization. These include:

  1. Limited data types: Line plots are not suitable for all types of data. For example, they may not work well with data that has multiple categories or data with nonlinear relationships.
  2. Can be misleading: If the scale of the y-axis is not carefully chosen, line plots can be misleading. It is important to choose appropriate scales to avoid misinterpretation of the data.
  3. Lack of context: Line plots only show the relationship between two variables, and do not provide context about other factors that may be influencing the data.
  4. Limited visual impact: Line plots may not be as visually impactful as other types of data visualizations, such as bar charts or scatter plots.
  5. Difficulty comparing multiple datasets: When using multiple line plots to compare different datasets, it can be difficult to visually compare the lines if they are not plotted on the same scale or with the same y-axis limits

Wrapping up

In conclusion, line plots are a useful tool in data analysis and communication. They are easy to understand, versatile, and can visualize different types of data. Python provides two primary libraries, Matplotlib and Seaborn, for creating line plots. Both libraries offer different features and customization options. By providing examples of creating line plots using both libraries, we hope this article has been helpful in illustrating how to create line plots effectively.

Data Science Dojo
Prasad D Wilagama
| March 17

In today’s digital age, with a plethora of tools available at our fingertips, researchers can now collect and analyze data with greater ease and efficiency. These research tools not only save time but also provide more accurate and reliable results. In this blog post, we will explore some of the essential research tools that every researcher should have in their toolkit.

From data collection to data analysis and presentation, this blog will cover it all. So, if you’re a researcher looking to streamline your work and improve your results, keep reading to discover the must-have tools for research success.

Revolutionize your research: The top 20 must-have research tools

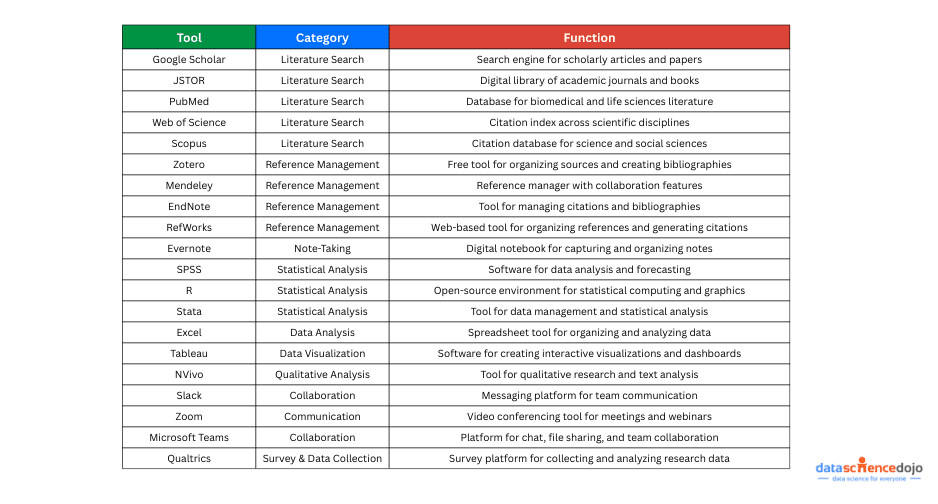
Research requires various tools to collect, analyze and disseminate information effectively. Some essential research tools include search engines like Google Scholar, JSTOR, and PubMed, reference management software like Zotero, Mendeley, and EndNote, statistical analysis tools like SPSS, R, and Stata, writing tools like Microsoft Word and Grammarly, and data visualization tools like Tableau and Excel.  

Essential Research Tools for Researchers

1. Google Scholar – Google Scholar is a search engine for scholarly literature, including articles, theses, books, and conference papers.

2. JSTOR – JSTOR is a digital library of academic journals, books, and primary sources.

3.PubMedPubMed is a free search engine accessing primarily the MEDLINE database of references and abstracts on life sciences and biomedical topics. 

4. Web of Science: Web of Science is a citation index that allows you to search for articles, conference proceedings, and books across various scientific disciplines. 

5. Scopus – Scopus citation database that covers scientific, technical, medical, and social sciences literature. 

6. Zotero: Zotero is a free, open-source citation management tool that helps you organize your research sources, create bibliographies, and collaborate with others.

7. Mendeley – Mendeley is a reference management software that allows you to organize and share your research papers and collaborate with others.

8. EndNote – EndNoted is a software tool for managing bibliographies, citations, and references on the Windows and macOS operating systems. 

9. RefWorks – RefWorks is a web-based reference management tool that allows you to create and organize a personal database of references and generate citations and bibliographies.

10. Evernote – Evernote is a digital notebook that allows you to capture and organize your research notes, web clippings, and documents.

11. SPSS – SPSS is a statistical software package used for data analysis, data mining, and forecasting.

12. R – R is a free, open-source software environment for statistical computing and graphics.

13. Stata – Stata is a statistical software package that provides a suite of applications for data management and statistical analysis.

Other helpful tools for collaboration and organization include NVivo, Slack, Zoom, and Microsoft Teams. With these tools, researchers can effectively find relevant literature, manage references, analyze data, write research papers, create visual representations of data, and collaborate with peers. 

14. Excel – Excel is spreadsheet software used for organizing, analyzing, and presenting data.

15. Tableau – Tableau is a data visualization software that allows you to create interactive visualizations and dashboards.

16. NVivo – Nviva is a software tool for qualitative research and data analysis.

17. Slack – Slack is a messaging platform for team communication and collaboration.

18. Zoom – Zoom is a video conferencing software that allows you to conduct virtual meetings and webinars.

19. Microsoft Teams – Microsoft Teams is a collaboration platform that allows you to chat, share files, and collaborate with your team.

20. Qualtrics – Qualtrics is an online survey platform that allows researchers to design and distribute surveys, collect and analyze data, and generate reports.

Maximizing accuracy and efficiency with research tools

Research is a vital aspect of any academic discipline, and it is critical to have access to appropriate research tools to facilitate the research process. Researchers require access to various research tools and software to conduct research, analyze data, and report research findings. Some standard research tools researchers use include search engines, reference management software, statistical analysis tools, writing tools, and data visualization tools.

Specialized research tools are also available for researchers in specific fields, such as GIS software for geographers and geneticist gene sequence analysis tools. These tools help researchers organize data, collaborate with peers, and effectively present research findings.

It is crucial for researchers to choose the right tools for their research project, as these tools can significantly impact the accuracy and reliability of research findings.

Conclusion

Summing it up, researchers today have access to an array of essential research tools that can help simplify the research process. From data collection to analysis and presentation, these tools make research more accessible, efficient, and accurate. By leveraging these tools, researchers can improve their work and produce more high-quality research.

Author image - Ayesha
Ayesha Saleem
| February 21

Have you ever heard a story told with numbers? That’s the magic of data storytelling, and it’s taking the world by storm. If you’re ready to captivate your audience with compelling data narratives, you’ve come to the right place.

what is data storytelling
What is data storytelling – Detailed analysis by Data Science Dojo


Everyone loves data—it’s the reason your organization is able to make informed decisions on a regular basis. With new tools and technologies becoming available every day, it’s easy for businesses to access the data they need rather than search for it. Unfortunately, this also means that increasingly people are seeing the ins and outs of presenting data in an understandable way.

The rise in social media has allowed people to share their experiences with a product or service without having to look them up first. As a result, businesses are being forced to present data in a more refined way than ever before if they want to retain customers, generate leads, and retain brand loyalty. 

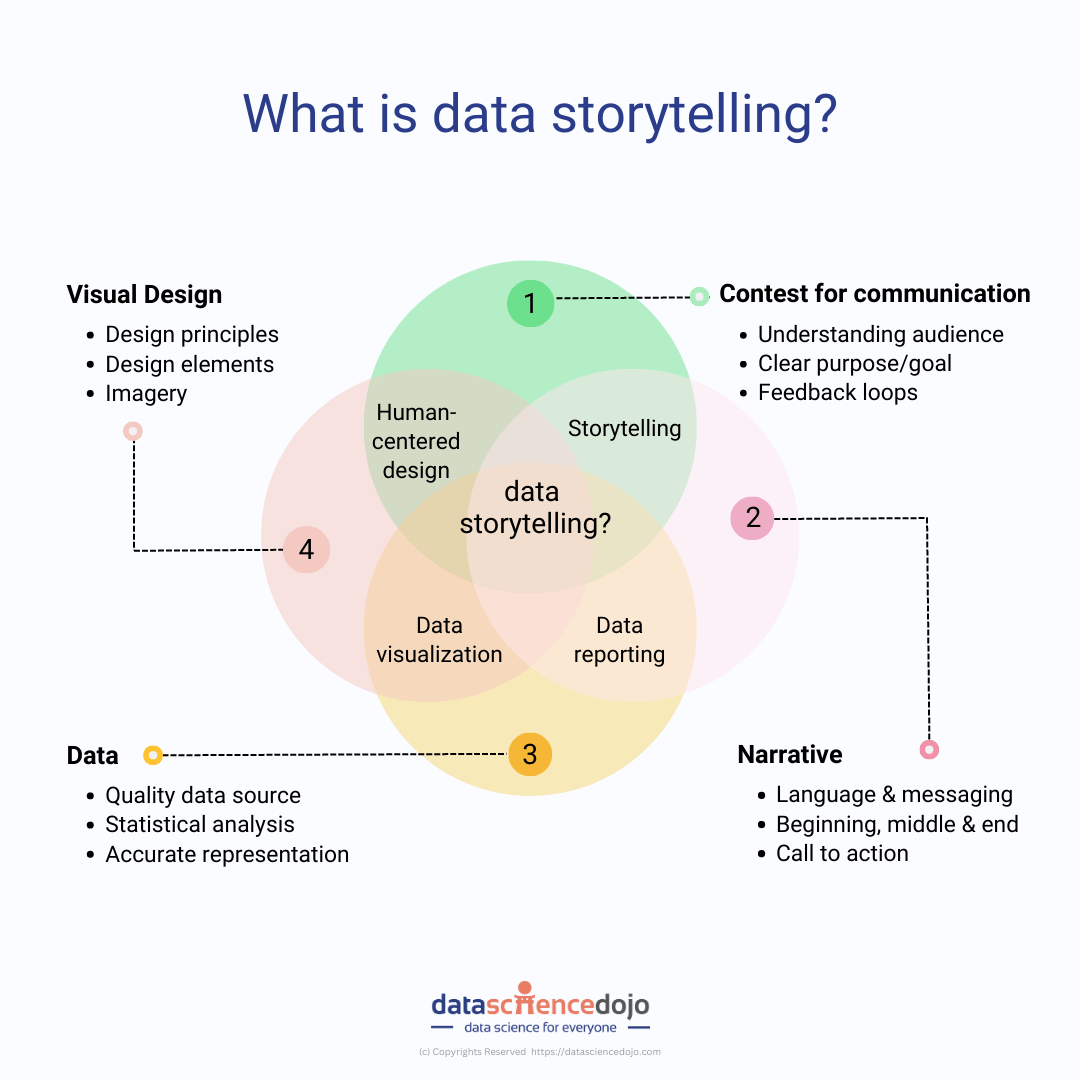
What is data storytelling? 

Data storytelling is the process of using data to communicate the story behind the numbers—and it’s a process that’s becoming more and more relevant as more people learn how to use data to make decisions. In the simplest terms, data storytelling is the process of using numerical data to tell a story. A good data story allows a business to dive deeper into the numbers and delve into the context that led to those numbers.

For example, let’s say you’re running a health and wellness clinic. A patient walks into your clinic, and you diagnose that they have low energy, are stressed out, and have an overall feeling of being unwell. Based on this, you recommend a course of treatment that addresses the symptoms of stress and low energy. This data story could then be used to inform the next steps that you recommend for the patient.   

Why is data storytelling important in three main fields: Finance, healthcare, and education? 

Finance – With online banking and payment systems becoming more common, the demand for data storytelling is greater than ever. Data can be used to improve a customer journey, improve the way your organization interacts with customers, and provide personalized services. Healthcare – With medical information becoming increasingly complex, data storytelling is more important than ever. In education – With more and more schools turning to data to provide personalized education, data storytelling can help drive outcomes for students. 


The importance of authenticity in data storytelling 

Authenticity is key when it comes to data storytelling. The best way to understand the importance of authenticity is to think about two different data stories. Imagine that in one, you present the data in a way that is true to the numbers, but the context is lost in translation. In the other example, you present the data in a more simplified way that reflects the situation, but it also leaves out key details. This is the key difference between data storytelling that is authentic and data storytelling that is not.

As you can imagine, the data store that is not authentic will be much less impactful than the first example. It may help someone, but it likely won’t have the positive impact that the first example did. The key to authenticity is to be true to the facts, but also to be honest with your readers. You want to tell a story that reflects the data, but you also want to tell a story that is true to the context of the data. 


Register for our conferenceFuture of Data and AI to learn from esteemed leaders and discover how to put data storytelling into action. Don’t miss out!


How to do data storytelling in action?

Start by gathering all the relevant data together. This could include figures from products, services, and your business as a whole; it could also include data about how your customers are currently using your product or service. Once you have your data together, you’ll want to begin to create a content outline.

This outline should be broken down into paragraphs and sentences that will help you tell your story more clearly. Invest time into creating an outline that is thorough but also easy for others to follow.

Next, you’ll want to begin to find visual representations of your data. This could be images, infographics, charts, or graphs. The visuals you choose should help you to tell your story more clearly.

Once you’ve finished your visual content, you’ll want to polish off your data stories. The last step in data storytelling is to write your stories and descriptions. This will give you an opportunity to add more detail to your visual content and polish off your message. 


The need for strategizing before you start 

While the process of data storytelling is fairly straightforward, the best way to begin is by strategizing. This is a key step because it will help you to create a content outline that is thorough, complete, and engaging. You’ll also want to strategize by thinking about who you are writing your stories for. This could be a specific section of your audience, or it could be a wider audience. Once you’ve identified your audience, you’ll want to think about what you want to achieve.

This will help you to create a content outline that is targeted and specific. Next, you’ll want to think about what your content outline will look like. This will help you to create a content outline that is detailed and engaging. You’ll also want to consider what your content outline will include. This will help you to ensure that your content outline is complete, and that it includes everything you want to include. 

Planning your content outline 

There are a few key things that you’ll want to include in your content outline. These include audience pain points, a detailed overview of your content, and your strategy. With your strategy, you’ll want to think about how you plan to present your data. This will help you to create a content outline that is focused, and it will also help you to make sure that you stay on track. 

Watch this video to know what your data tells you


Researching your audience and understanding their pain points 

With the planning complete, you’ll want to start to research your audience. This will help you to create a content outline that is more focused and will also help you to understand your audience’s pain points. With pain points in mind, you’ll want to create a content outline that is more detailed, engaging, and honest. You’ll also want to make sure that you’re including everything that you want to include in your content outline.   

Next, you’ll want to start to research your pain points. This will help you to create a content outline that is more detailed and engaging. 

Before you begin to create your content outline, you’ll want to start to think about your audience. This will help you to make connections and to start creating your content outline. With your audience in mind, you’ll want to think about how to present your information. This will help you to create a content outline that is more detailed, engaging, and focused. 

The final step in creating your content outline is to decide where you’re going to publish your data stories. If you’re going to publish your content on a website, you should think about the layout that you want to use. You’ll want to think about the amount of text and the number of images you want to include. 


The need for strategizing before you start 

Just as a good story always has a beginning, a middle, and an end, so does a good data story. The best way to start is by gathering all the relevant data together and creating a content outline. Once you’ve done this, you can begin to strategize and make your content more engaging, and you’ll want to make sure that you stay on track. 


Mastering your message: How to create a winning content outline

The first thing that you’ll want to think about when it comes to planning your content outline is your strategy. This will help you to make sure that you stay on track with your content outline. Next, you’ll want to think about your audience’s pain points. This will help you to make sure that you stay focused on the most important aspects of your content.  


Researching your audience and understanding their pain points 

The final thing that you’ll want to do before you begin to create your content outline is to research your audience. This will help you to make sure that you stay focused on the most important aspects of your content. With pain points in mind, you’ll want to make sure that you stay focused on the most important aspects of your content.  

Next, you’ll want to start to research your audience. This will help you to make sure that you stay focused on the most important aspects of your content. 

By approaching data storytelling in this way, you should be able to create engaging, detailed, and targeted content. 


The bottom line: What we’ve learned

In conclusion, data storytelling is a powerful tool that allows businesses to communicate complex data in a simple, engaging, and impactful way. It can help to inform and persuade customers, generate leads, and drive outcomes for students. Authenticity is a key component of effective data storytelling, and it’s important to be true to the facts while also being honest with your readers.

With careful planning and a thorough content outline, anyone can create powerful and effective data stories that engage and inspire their audience. As data continues to play an increasingly important role in decision-making across a wide range of industries, mastering the art of data storytelling is an essential skill for businesses and individuals alike.

Nathan 500x500 web
Nathan Piccini
| February 13

Are you geared to create a sales dashboard on Power BI and track key performance indicators to drive sales success? This step-by-step guide will show you through connecting to the data source, build the dashboard, and add interactivity and filters.

Creating a sales dashboard in Power BI is a straightforward process that can help your sales team to track key performance indicators (KPIs) and make data-driven decisions. Here’s a step-by-step guide on how to create a sales dashboard using the above-mentioned KPIs in Power BI: 

sales dashboard on Power BI 
Creating a sales dashboard on Power BI – Data Science Dojo

Step 1: Connect to your data source 

The first step is to connect to your data source in Power BI. This can be done by clicking on the “Get Data” button in the Home ribbon, and then selecting the appropriate connection type (e.g., Excel, SQL Server, etc.). Once you have connected to your data source, you can import the data into Power BI for analysis. 

Step 2: Create a new report 

Once you have connected to your data source, you can create a new report by clicking on the “File” menu and selecting “New” -> “Report.” This will open a new report canvas where you can begin to build your dashboard. 

Step 3: Build the dashboard 

To build the dashboard, you will need to add visualizations to the report canvas. You can do this by clicking on the “Visualizations” pane on the right-hand side of the screen, and then selecting the appropriate visualization type (e.g., bar chart, line chart, etc.). Once you have added a visualization to the report canvas, you can use the “Fields” pane on the right-hand side to add data to the visualization. 

Read more about maximizing sales success with dashboards by clicking on this link.

Step 4: Add the KPIs to the dashboard 

To add the KPIs to the dashboard, you will need to create a new card visualization for each KPI. Then, use the “Fields” pane on the right-hand side of the screen to add the appropriate data to each card. 

Sales Revenue:

To add this KPI, you’ll need to create a card visualization and add the “Total Sales Revenue” column from your data source. 

Sales Quota Attainment:

To add this KPI, you’ll need to create a card visualization and add the “Sales Quota Attainment” column from your data source. 

Lead Conversion Rate:

To add this KPI, you’ll need to create a card visualization and add the “Lead Conversion Rate” column from your data source. 

Customer Retention Rate:

To add this KPI, you’ll need to create a card visualization and add the “Customer Retention Rate” column from your data source. 

Average Order Value:

To add this KPI, you’ll need to create a card visualization and add the “Average Order Value” column from your data source. 

Step 5: Add filters and interactivity 

Once you have added all the KPIs to the dashboard, you can add filters and interactivity to the visualizations. You can do this by clicking on the “Visualizations” pane on the right-hand side of the screen and selecting the appropriate filter or interactivity option. For example, you can add a time filter to your chart to show sales data over a specific period, or you can add a hover interaction to your diagram to show more data when the user moves their mouse over a specific point.

Check out this course and learn Power BI today!

Step 6: Publish and share the dashboard 

Once you’ve completed your dashboard, you can publish it to the web or share it with specific users. To do this, click on the “File” menu and select “Publish” -> “Publish to Web” (or “Share” -> “Share with specific users” if you are sharing the dashboard with specific users). This will generate a link that can be shared with your team, or you can also publish the dashboard to the Power BI service where it can be accessed by your sales team from anywhere, at any time. You can also set up automated refresh schedules so that the dashboard is updated with the latest data from your data source.

Ready to transform your sales strategy with a custom dashboard in Power BI?

By creating a sales dashboard in Power BI, you can bring all your sales data together in one place, making it easier for your team to track key performance indicators and make informed decisions. The process is simple and straightforward, and the end result is a custom dashboard that can be customized to fit the specific needs of your sales team.

Whether you are looking to track sales revenue, sales quota attainment, lead conversion rate, customer retention rate, or average order value, Power BI has you covered. So why wait? Get started today and see how Power BI can help you drive growth and success for your sales team! 

Hudaiba Soomro - Author
Hudaiba Soomro
| January 31

Big data is conventionally understood in terms of its scale. This one-dimensional approach, however, runs the risk of simplifying the complexity of big data. In this blog, we discuss the 10 Vs as metrics to gauge the complexity of big data. 

When we think of “big data,” it is easy to imagine a vast, intangible collection of customer information and relevant data required to grow your business. But the term “big data” isn’t about size – it’s also about the potential to uncover valuable insights by considering a range of other characteristics. In other words, it’s not just about the amount of data we have, but also how we use and analyze it. 

10 vs of big data
10 vs of big data

Volume 

The most obvious feature is the volume that captures the sheer scale of a certain dataset. Consider, for example, 40,000 apps added to the app store each year. Similarly, 1 in 40,000 searches are made over Google every second. 

Big numbers carry the immediate appeal of big data. Whether it is the 2.2 billion active monthly users on Facebook or the 2.2 billion cups of coffee that are consumed in single day, big numbers capture qualities about large swathes of population, conveying insights that can feel universal in their scale.  

As another example, consider the 294 billion emails being sent every day. In comparison, there are 300 billion stars in the Milky Way. Somehow, the largeness of these numbers in a human context can help us make better sense of otherwise unimaginable quantities like the stars in the Milky Way! 


Velocity 

In nearly all the examples considered above, velocity of the data was also an important feature. Velocity adds to volume, allowing us to grapple with data as a dynamic quantity. In big data it refers to how quickly data is generated and how fast it moves. It is one of the three Vs of big data, along with volume and variety. Velocity is important for businesses that need their data to be quickly available for making informed decisions. 


Variety 

Variety, here, refers to the several types of data that are constantly in circulation and is an integral quality of big data. Different data sets are unstructured. This includes data shared over social media and instant messaging regularly such as videos, audio, and phone recordings. 

Then, there is the 10% semi-structured data in circulation including emails, webpages, zipped files, etc. Lastly, there is the rarity of structured data such as financial transactions. 

Data types are a defining feature of big data as unstructured data needs to be cleaned and structured before it can be used for data analytics. In fact, the availability of clean data is among the top challenges facing data scientists. According to Forbes, most data scientists spend 60% of their time cleaning data.  


Variability 

Variability is a measure of the inconsistencies in data and is often confused with variety. To understand variability, let us consider an example. You go to a coffee shop every day and purchase the same latte each day. However, it may smell or taste slightly or significantly different each day.  

This kind of inconsistency in data is an important feature as it places limits on the reproducibility of data. This is particularly relevant in sentiment analysis which is much harder for AI models as compared to humans. Sentiment analysis requires an additional level of input, i.e., context.  

An example of variability in big data can be seen when investigating the amount of time spent on phones daily by diverse groups of people. The data collected from different samples (high school students, college students, and adult full-time employees) can vary, resulting in variability. Another example could be a soda shop offering different blends of soda but having different taste every day, which is variability. 

Variability also accounts for the inconsistent speed at which data is downloaded and stored across various systems, creating a unique experience for customers consuming the same data.  


Veracity 

Veracity refers to the reliability of the data source. Numerous factors can contribute to the reliability of the input they provide at a particular time in a particular situation. 

Veracity is particularly important for making data-driven decisions for businesses as reproducibility of patterns relies heavily on the credibility of initial data inputs. 


Validity 

Validity pertains to the accuracy of data for its intended use. For example, you may acquire a dataset pertaining to data related to your subject of inquiry, increasing the task of forming a meaningful relationship and inquiry. Registered charity data contact lists 


Volatility

Volatility refers to the time considerations placed on a particular data set. It involves considering if data acquired a year ago would be relevant for analysis for predictive modeling today. This is specific to the analyses being performed. Similarly, volatility also means gauging whether a particular data set is historic or not. Usually, data volatility comes under data governance and is assessed by data engineers.  


Learn practical data science today!


Vulnerability 

Big data is often about consumers. We often overlook the potential harm in sharing our shopping data, but the reality is that it can be used to uncover confidential information about an individual. For instance, Target accurately predicted a teenage girl’s pregnancy before her own parents knew it. To avoid such consequences, it’s important to be mindful of the information we share online. 


Visualization  

With a new data visualization tool being released every month or so, visualizing data is key to insightful results. The traditional x-y plot no longer suffices for the kind of complex detailing that goes into categorizations and patterns across various parameters obtained via big data analytics.  


Value 

BIG data is nothing if it cannot produce meaningful value. Consider, again, the example of Target using a 16-year-old’s shopping habits to predict her pregnancy. While in this case, it violates privacy, in most other cases, it can generate incredible customer value by bombarding them with the specific product advertisement they require. 


Learn about 10 Vs of big data by George Firican

10 Vs of Big Data 


Enable smart decision making with big data visualization

The 10 Vs of big data are Volume, Velocity, Variety, Veracity, Variability, Value, Viscosity, Volume growth rate, Volume change rate, and Variance in volume change rate. These are the characteristics of big data and help to understand its complexity.

The skills needed to work with big data involve coding, although the level of knowledge required for coding is not as deep as that of a programmer. Big Data and Data Science are two concepts that play a crucial role in enabling data-driven decision making. 90% of the world’s data has been created in the last two years, providing an incredible amount of data being created daily.

Companies employ data scientists to use data mining and big data to learn more about consumers and their behaviors. Both Data Mining and Big Data Analysis are major elements of data science. 

Small Data, on the other hand, is collected in a more controlled manner,  whereas Big Data refers to data sets that are too large or complex to be processed by traditional data processing applications. 

Nathan 500x500 web
Nathan Piccini
| January 28

Dashboarding has become an increasingly popular tool for sales teams and for good reason. A well-designed dashboard can help sales teams to track key performance indicators (KPIs) in real time, which can provide valuable insights into sales performance and help teams to make data-driven decisions.

In this blog post, we’ll explore the importance of dashboarding for sales teams, and highlight five KPIs that every sales team should track. 


Sales revenue:

This is the most basic KPI for a sales team, and it simply represents the total amount of money generated from sales. Tracking sales revenue can help teams to identify trends in sales performance and can be used to set and track sales goals. It’s also important to track sales revenue by individual product, category, or sales rep to understand the performance of different areas of the business. 

Sales quota attainment:

Sales quota attainment measures how well a sales team performs against its goals. It is typically expressed as a percentage and is calculated by dividing the total sales by the sales quota. Tracking this KPI can help sales teams to understand how they are performing against their goals and can identify areas that need improvement. 


Read more about: Data science to boost eCommerce sakes


Lead conversion rate:

The lead conversion rate is a measure of how effectively a sales team is converting leads into paying customers. It is calculated by dividing the number of leads that are converted into sales by the total number of leads generated. Tracking this KPI can help sales teams understand how well their lead generation efforts are working and can identify areas where improvements can be made. 


Customer retention rate:

The customer retention rate is a measure of how well a company is retaining its customers over time. It is calculated by dividing the number of customers at the end of a given period by the number of customers at the beginning of that period, multiplied by 100. By tracking customer retention rate over time, sales teams can identify patterns in customer behavior, and use that data to develop strategies for improving retention.  


Average order value:

Average order value (AOV) is a measure of the amount of money a customer spends on each purchase. It is calculated by dividing the total revenue by the total number of orders. AOV can be used to identify trends in customer buying behavior and can help sales teams identify which products or services are most popular among customers. 

All these KPIs are important for a sales team as they allow them to measure their performance and how they are doing against the set goals.

Sales revenue is important to understand the total money generated from sales, sales quota attainment gives a measure of how well the team is doing against their set targets, lead conversion rate helps understand the effectiveness of lead generation, the customer retention rate is important to understand the patterns of customer behavior and the average order value helps understand which products are most popular among the customers. 


Read about: Big data problem, its impact, and a solution for it


All of these KPIs can provide valuable insights into sales performance and can help sales teams to make data-driven decisions. By tracking these KPIs, sales teams can identify areas that need improvement, and develop strategies for increasing sales, improving lead conversion, and retaining customers.

A dashboard can be a great way to visualize this data, providing an easy-to-use interface for tracking and analyzing KPIs. By integrating these KPIs into a sales dashboard, teams can see a clear picture of performance in real-time and make more informed decisions. 


Take data-driven decisions today with dashboarding!

In conclusion, dashboarding is an essential tool for sales teams as it allows them to track key performance indicators and provides a clear picture of their performance in real-time. It can help them identify areas of improvement and make data-driven decisions. Sales revenue, sales quota attainment, lead conversion rate, customer retention rate, 

Shehryar Author - Data Science
Shehryar Mallick
| January 21

In this blog, we will discuss exploratory data analysis, also known as EDA, and why it is important. We will also be sharing code snippets so you can try out different analysis techniques yourself. So, without any further ado let’s dive right in. 

What is Exploratory Data Analysis (EDA)? 

“The greatest value of a picture is when it forces us to notice what we never expected to see.”  John Tukey, American Mathematician 

A core skill to possess for someone who aims to pursue data science, data analysis or affiliated fields as a career is exploratory data analysis (EDA). To put it simply, the goal of EDA is to discover underlying patterns, structures, and trends in the datasets and drive meaningful insights from them that would help in driving important business decisions. 

The data analysis process enables analysts to gain insights into the data that can inform further analysis, modeling, and hypothesis testing.  

EDA is an iterative process of conglomerative activities which include data cleaning, manipulation and visualization. These activities together help in generating hypotheses, identifying potential data cleaning issues, and informing the choice of models or modeling techniques for further analysis. The results of EDA can be used to improve the quality of the data, to gain a deeper understanding of the data, and to make informed decisions about which techniques or models to use for the next steps in the data analysis process. 

Often it is assumed that EDA is to be performed only at the start of the data analysis process, however the reality is in contrast to this popular misconception, as stated EDA is an iterative process and can be revisited numerous times throughout the analysis life cycle if need may arise.  

In this blog while highlighting the importance and different renowned techniques of EDA we will also show you examples with code so you can try them out yourselves and better comprehend what this interesting skill is all about. 


Note: the dataset used for this purpose can be found at: https://www.kaggle.com/datasets/raniahelmy/no-show-investigate-dataset  

Want to see some exciting visuals that we can create from this dataset? DSD got you covered! Visit the link  

Importance of EDA: 

One of the key advantages of EDA is that it allows you to develop a deeper understanding of your data before you begin modelling or building more formal, inferential models. This can help you identify  

  • Important variables,  
  • Understand the relationships between variables, and  
  • Identify potential issues with the data, such as missing values, outliers, or other problems that might affect the accuracy of your models. 

Another advantage of EDA is that it helps in generating new insights which may incur associated hypotheses, those hypotheses then can be tested and explored to gain a better understanding of the dataset. 

Finally, EDA helps you uncover hidden patterns in a dataset that were not comprehensible to the naked eye, these patterns often lead to interesting factors that one couldn’t even think would affect the target variable. 

Want to start your EDA journey, well you can always get yourself registered at Data Science Bootcamp.  

Common EDA techniques: 

The technique you employ for EDA is intertwined with the task at hand, many times you would not require implementing all the techniques, on the other hand there would be times that you’ll need accumulation of the techniques to gain valuable insights. To familiarize you with a few we have listed some of the popular techniques that would help you in EDA. 

Visualization:  

One of the most popular and effective ways to explore data is through visualization. Some popular types of visualizations include histograms, pie charts, scatter plots, box plots and much more. These can help you understand the distribution of your data, identify patterns, and detect outliers. 

Below are a few examples on how you can use visualization aspect of EDA to your advantage: 

Histogram: 

The histogram is a kind of visualization that shows the frequencies of each category in a dataset. 

Data- Histogram

Histogram
Histogram

The above graph shows us the number of responses belonging to different age groups and they have been partitioned based on how many came to the appointment and how many did not show up. 

Pie Chart: 

A pie chart is a circular image, it is usually used for a single feature to indicate how the data of that feature are distributed, commonly represented in percentages. 

Pie chart- Data

Pie chart
Pie Chart


The pie chart shows the distribution that 20.2% of the total data comprises of individuals who did not show up for the appointment while 79.8% of individuals did show up. 

Box Plot: 

Box plot is also an important kind of visualization that is used to check how the data is distributed, it shows the five number summary of the dataset, which is quite useful in many aspects such as checking if the data is skewed, or detecting the outliers etc.  

box plot - data

Box plot
Box Plot


The box plot shows the distribution of the Age column, segregated on the basis of individuals who showed and did not show up for the appointments. 

Descriptive statistics:  

Descriptive statistics are a set of tools for summarizing data in a way that is easy to understand. Some common descriptive statistics include mean, median, mode, standard deviation, and quartiles. These can provide a quick overview of the data and can help identify the central tendency and spread of the data.

data frame - descriptive statistics

descriptive statistics
Descriptive statistics


Grouping and aggregating:  

One way to explore a dataset is by grouping the data by one or more variables, and then aggregating the data by calculating summary statistics. This can be useful for identifying patterns and trends in the data. 

groupby - data

grouping and aggregation of data
Grouping and Aggregation of Data


Data cleaning:  

Exploratory data analysis also includes cleaning data, it may be necessary to handle missing values, outliers, or other data issues before proceeding with further analysis.  

data cleaning - data frame Data Cleaning


As you can see, fortunately this dataset did not have any missing value. 

Correlation analysis: 

Correlation analysis is a technique for understanding the relationship between two or more variables. You can use correlation analysis to determine the degree of association between variables, and whether the relationship is positive or negative. 

correlation analysis - data frame

correlation analysis
Correlation Analysis

The heatmap indicates to what extent different features are correlated to each other, with 1 being highly correlated and 0 being no correlation at all. 

Types of EDA: 

There are a few different types of exploratory data analysis (EDA) that are commonly used, depending on the nature of the data and the goals of the analysis. Here are a few examples: 

Univariate EDA:  

Univariate EDA, short for univariate exploratory data analysis, examines the properties of a single variable by techniques such as histograms, statistics of central tendency and dispersion, and outliers detection. This approach helps understand the basic features of the variable and uncover patterns or trends in the data. 

Pie 2 - data frame

Alcoholism - pie chart
Alcoholism – Pie Chart


The pie chart indicates what percentage of individuals from the total data are identified as alcoholic. 

data frame alcoholism

alcoholism data
Alcoholism data

Bivariate EDA:  

This type of EDA is used to analyse the relationship between two variables. It includes techniques such as creating scatter plots and calculating correlation coefficients and can help you understand how two variables are related to each other.
bivariate data frame

Bivariate data chart


The bar chart shows what percentage of individuals are alcoholic or not and whether they showed up for the appointment or not. 

Multivariate EDA:  

This type of EDA is used to analyze the relationships between three or more variables. It can include techniques such as creating multivariate plots, running factor analysis, or using dimensionality reduction techniques such as PCA to identify patterns and structure in the data.

Multivariate data frame

Multivariate data chart

The above visualization is distplot of kind, bar, it shows what percentage of individuals belong to one of the possible four combinations diabetes and hypertension, moreover they are segregated on the basis of gender and whether they showed up for appointment or not.  

Time-series EDA:  

This type of EDA is used to understand patterns and trends in data that are collected over time, such as stock prices or weather patterns. It may include techniques such as line plots, decomposition, and forecasting. 

time series data frame

Time series data chart
Time Series Data Chart


This kind of chart helps us gain insight of the time when most appointments were scheduled to happen, as you can see around 80k appointments were made for the month of May.

Spatial EDA:  

This type of EDA deals with data that have a geographic component, such as data from GPS or satellite imagery. It can include techniques such as creating choropleth maps, density maps, and heat maps to visualize patterns and relationships in the data.

Spatial data frame

Spatial data chart
Spatial data chart


In the above map, the size of the bubble indicates the number of appointments booked in a particular neighborhood while the hue indicates the percentage of individuals who did not show up for the appointment.  

Popular libraries for EDA: 

Following is a list of popular libraries that python has to offer which you can use for Exploratory Data Analysis.   

  1. Pandas: This library offers efficient, adaptable, and clear data structures meant to simplify handling “relational” or “labelled” data. It is a useful tool for manipulating and organizing data. 
  2. NumPy: This library provides functionality for handling large, multi-dimensional arrays and matrices of numerical data. It also offers a comprehensive set of high-level mathematical operations that can be applied to these arrays. It is a dependency for various other libraries, including Pandas, and is considered a foundational package for scientific computing using Python. 
  3. Matplotlib: Matplotlib is a Python library used for creating plots and visualizations, utilizing NumPy. It offers an object-oriented interface for integrating plots into applications using various GUI toolkits such as Tkinter, wxPython, Qt, and GTK. It has a diverse range of options for creating static, animated, and interactive plots. 
  4. Seaborn: This library is built on top of Matplotlib and provides a high-level interface for drawing statistical graphics. It’s designed to make it easy to create beautiful and informative visualizations, with a focus on making it easy to understand complex datasets. 
  5. Plotly: This library is a data visualization tool that creates interactive, web-based plots. It works well with the pandas library and it’s easy to create interactive plots with zoom, hover, and other features. 
  6. Altair: is a declarative statistical visualization library for Python. It allows you to quickly and easily create statistical graphics in a simple, human-readable format. 


Conclusion: 

In conclusion, Exploratory Data Analysis (EDA) is a crucial skill for data scientists and analysts, which includes data cleaning, manipulation, and visualization to discover underlying patterns and trends in the data. It helps in generating new insights, identifying potential issues and informing the choice of models or techniques for further analysis.

It is an iterative process that can be revisited throughout the data analysis life cycle. Overall, EDA is an important skill that can inform important business decisions and generate valuable insights from data. 


Hudaiba Soomro - Author
Hudaiba Soomro
| December 22

Data visualization is key to effective communication across all organizations. In this blog, we briefly introduce 33 tools to visualize data. 


Data-driven enterprises are evidently the new normal. Not only does this require companies to wrestle with data for internal and external decision-making challenges, but also requires effective communication. This is where data visualization comes in. 


Without visualization results found via rigorous data analytics procedures, key analyses could be forgone. Here’s where data visualization methods such as charts, graphs, scatter plots, 3D visualization, and so on, simplify the task. Visual data is far easier to absorb, retain, and recall.  


And so, we describe a total of 33 data visualization tools that offer a plethora of possibilities.  


Recommended data visualization tools you must know about  

Data visualization - 33 ways


Using these along with data visualization tips ensures healthy communication of results across organizations. 


1. Visual.ly 


Popular for its incredible distribution network which allows data import and export to third parties, Visual.ly is a great data visualization tool in the market.  


2. Sisense 


Known for its agility, Sisense provides immediate data analytics by means of effective data visualization. This tool identifies key patterns and summarizes data statistics, assisting data-driven strategies. 


3. Data wrapper 


Data Wrapper, a popular and free data visualization tool, produces quick charts and other graphical presentations of the statistics of big data.  


4. Zoho reports 


Zoho Reports is a straightforward data visualization tool that provides online reporting services on business intelligence. 


5. Highcharts 


The Highcharts visualization tool is used by many global top companies and works seamlessly in visualizing big data analytics.  


6. Qlikview 


Providing solutions to around 40,000 clients across a hundred countries, Qlickview’s data visualization tools provide features such as customized visualization and enterprise reporting for business intelligence. 


7. Sigma.js 


A JavaScript library for creating graphs, Sigma uplifts developers by making it easier to publish networks on websites.  


8. JupyteR 


A strongly rated, web-based application, JupyteR allows users to share and create documents with equations, code, text, and other visualizations.  


9. Google charts 


Another major data visualization tool, Google charts is popular for its ability to create graphical and pictorial data visualizations. 


10. Fusioncharts 


Fusioncharts is a Javascript-based data visualization tool that provides up to ninety chart-building packages that seamlessly integrate with significant platforms and frameworks.  


11. Infogram 


Infogram is a popular web-based tool used for creating infographics and visualizing data.  


12. Polymaps 


A free Javascript-based library, Polymaps allows users to create interactive maps in web browsers such as real-time display of datasets. 


13. Tableau 


Tableau allows its users to connect with various data sources, enabling them to create data visualization by means of maps, dashboards, stories, and charts, via a simple drag-and-drop interface. Its applications are far-reaching such as exploring healthcare data 


14. Klipfolio 


Klipfolio provides immediate data from hundreds of services by means of pre-built instant metrics. It’s ideal for businesses that require custom dashboards 


15. Domo 


Domo is especially great for small businesses thanks to its accessible interface allowing users to create advanced charts, custom apps, and other data visualizations that assist them in making data-driven decisions.  


16. Looker 


A versatile data visualization tool, Looker provides a directory of various visualization types from bar gauges to calendar heat maps.  


17. Qlik sense 


Qlik Sense uses artificial intelligence to make data more understandable and usable. It provides greater interactivity, quick calculations, and the option to integrate data from hundreds of sources. 


18. Grafana 


Allowing users to create dynamic dashboards and offering other visualizations, Grafana is a great open-source visualization software.  


19. Chartist.js 


This free, open-source Javascript library allows users to create basic responsive charts that offer both customizability and compatibility across multiple browsers.  


20. Chart.js 


A versatile Javascript library, Chart.js is open source and provides a variety of 8 chart types while allowing animation and interaction.  


21. D3.js 


Another Javascript library, D3.js requires some Javascript knowledge and is used to manipulate documents via data.  


22. ChartBlocks 


ChartBlocks allows data import from nearly any source. It further provides detailed customization of visualizations created. 


23. Microsoft Power BI 


Used by nearly 200K+ organizations, Microsoft Power BI is a data visualization tool used for business intelligence datatypes. However, it can be used for educational data exploration as well.  


24. Plotly 


Used for interactive charts, maps, and graphs, Plotly is a great data visualization tool whose visualization products can be shared further on social media platforms. 


25. Excel 


The old-school Microsoft Exel is a data visualization tool that provides an easy interface and offers visualizations such as scatter plots, which establish relationships between datasets. 


26. IBM watson analytics 


IBM’s cloud-based investigation administration, Watson Analytics allows users to discover trends in information quickly and is among their top free tools. 


27. FushionCharts 


A product of InfoSoft Global, FusionCharts is used by nearly 80% of Fortune 500 companies across the globe. It provides over ninety diagrams and outlines that are both simple and sophisticated.  


28. Dundas BI 


This data visualization tool offers highly customizable visualization with interactive maps, charts, scorecards. Dundas BI provides a simplified way to clean, inspect, and transform large datasets by giving users full control over the visual elements.  


29. RAW 


RAW, or RawGraphs, works as a link between spreadsheets and data visualization. Providing a variety of both conventional and non-conventional layouts, RAW offers quality data security. 


30. Redash 


An open-source web application, Redas is used for database cleaning and visualizing results.  


31. Dygraphs 


A fast, open-source, Javascript-based charting library, Dygraphs allows users to interpret and explore dense data sets.  


32. RapidMiner 


A data science platform for companies, RapidMiner allows analyses of the overall impact of organizations’ employees, data, and expertise. This platform supports many analytics users.  


33. Gephi 


Among the top open-source and free visualizations and exploration softwares, Gephi provides users with all kinds of charts and graphs. It’s great for users working with graphs for simple data analysis.  


Ayesha Saleem - Digital content creator - Author
Ayesha Saleem
| December 5

This blog highlights healthcare data exploration with Tableau’s visualization techniques. We will learn how it presents an integrated view and evidence for making healthcare decisions.

According to Statista, the amount of healthcare data generated by the end of 2020, had increased to the colossal amount of 2,314 exabytes. 

Big data analysis is booming in every industry. Similarly, modernization and achieving data are key imperatives in healthcare. Visualization provides an intuitive way to present and understand user data.  

Tableau helped the healthcare sector to optimize challenges such as during the COVID-19 crisis and pushed healthcare professionals to be more predictive in how they use their resources going forward. 

Data visualization objective in healthcare 

Medical institutes deal with big data regularly. They require extensive data handling support to interpret information and understand its implications. You must have seen the patient’s heartbeat visualization in tv series and dramas. That is one example of how significant it is to visually realize the dataset for everyone.  

Moreover, it improves the management’s decisions on healthcare policies and services by presenting an integrated view and evidence to take healthcare decisions.  

Data visualization - tableau
Data visualization –  Tableau

It is indeed challenging to figure out a meaningful conclusion from the above data set. Even for a medical professional, it gets tedious to read complicated data. 

In that case, how is data visualization used in healthcare? Data visualization eases the data reading task for medical assistants by simplifying the datasets. It transforms and then visually displays medical data points that synthesize the analysis of data points. As a result, it gets easier to process, visualize, and understand for the layman as well. 

Watch this event, we will cover how to design a dashboard and more in Tableau. This crash course is intended for beginners. By the end of the session, you will know: 

Crash course on designing a dashboard in Tableau 


It is important for healthcare because it can help to identify patterns, trends, and correlations between different types of data. Data visualization can also be used to make complex information easier to understand, which helps improve the quality of care. 

The upward trend of data gathered globally by healthcare professionals shows the need for advanced visualization tools to analyze and explore more efficiently.  

Use of data visualization tools for clinical assessment 


healthcare data visualization and exploration
healthcare data visualization and exploration – Source, Demigos.com


To develop high-quality visualizations, healthcare organizations will require open-source and commercial data visualization libraries, as well as open-source libraries. They will also benefit from the ability to render data sets with high performance.  

Powerful data visualization libraries:

There are several differences between the open-source and commercial data visualization libraries. Numerous open-source libraries are available to the public. These libraries provide simple, but effective data exploration.  

However, several commercial libraries are capable of processing data in real-time and can render hundreds of thousands of data points in a single render. Healthcare organizations must be prepared to visualize all of their data to create high-quality visualizations at a rapid render. 

Rendering performances:

These are available in several languages, including JavaScript, Python, and, NET. The libraries’ purposes and rendering capabilities vary. Open-source libraries are constrained in resources and perform poorly, while commercial libraries are there to resolve that issue and can render millions of data points in real-time without problems.  

Resource optimization:

The healthcare sector is committed to visualizing all its data, but is it fully prepared? It is preparing for and using GPU-accelerated libraries to deliver higher-quality visualizations at a faster render time, regardless of the health sector’s computing power. 


Using Tableau to manage health data exploration

Tableau connects users with a variety of data sources and enables them to create data visualizations by making charts, maps, dashboards, and stories through a simple drag-and-drop interface. It is possible to create a simple view to explore sample data using Tableau for beginners.  

It offers several visualization techniques including tables, maps, bar charts, heatmaps, tree maps, line charts, bubble charts, etc. Often, we require customizations in data, such as radar charts with user intention. In this scenario, it allows the users to create interactive visualizations and add engaging views to express the desired format using filters, drop-down lists, calculated fields so on.   

Read this blog to learn about how data science benefits healthcare systems 


Features offered by Tableau for healthcare professionals 

Let’s shed some light on the core healthcare features offered by Tableau to help medical institutes. 

Payer analysis:

The data about payers’ operations, plans, and claims provided by healthcare payer analytics are used to derive insights into current healthcare patterns. Also, payer analytics software drives optimal patient experiences and provides doctors with data-driven care outcomes by using the world’s leading healthcare analytics platform 

Provider analytics:

A provider data analysis monitors payment for services rendered in a facility, such as a hospital or skilled nursing facility, to ensure that duplicate payments are not being made through both a facility and professional claim submission for the same service. 

Medical device analytics:

Optimize virtual sales, improve supply chain management, and realize end-to-end business transformation with the world’s leading analytics platform. It allows health institutes to visualize patient journeys over time. 

Benefits of Tableau in different industries

Tableau is a data visualization software that is used to create interactive, informative, and data-driven graphs. The software has multiple features that make it an ideal tool for visualizing different types of data. 

 Tableau has been used by various industries including healthcare, finance, and retail. It’s also being used in the entertainment industry to visualize statistics about movies and TV shows. 

Tableau helps organizations with big data problems by making it easy to work with large amounts of information. It provides a way for people to find insights into their data without having any programming skills or knowledge of SQL.

This makes it an ideal tool for people who want to explore their data on their own without having to rely on IT experts or developers all the time. Tableau also provides a good way for companies to share their insights by making visualizations public.

Ebad Ullah Khan-LLMs-Generative AI
Ebad Ullah Khan
| November 28

In this blog, we will look into different methods of data transformation, data exploration, and data visualization using Power BI.

Prerequisites to work with Power BI: 

  • Download Dataset 
  • Install Power BI 


Downloading Data: 

 We will use an open-source dataset available on Kaggle. This link contains several other datasets, but we will use “states_all.csv” in this blog. The link contains all the column descriptions. 

Watch this video to learn Power BI end-to-end


Moving forward, let us first see how to install it on our desktop: 


Installing Power BI: 


You can download Power BI for any OS from here. The installation is relatively easier, you can click on next for every prompt you get. After you have installed it, let us open it. 


This will be the screen you will land on after opening it. 

Power BI
Power BI


The data we have is in a CSV file so, we can use “Import data from Excel” to view it in Power BI (remember to select All Files from the file explorer). Just navigate to the file and click on open. A new screen will open which will preview the data you selected. First, we need to do some transformations on this data, for that click on Transform data at the bottom right of this screen.  

Transformation: 

There are some columns that have null values, so we can remove them. We can do this by clicking on individual columns and then selecting Remove Columns from the upper tab. Do the same for other columns 

  • OTHER_EXPENDITURE 
  • GRADES_1_8_G 
  • GRADES_9_12_G 
  • AVG_READING_8_SCORE 

We can also remove the PRIMARY_KEY column as it is of no importance to us in the later steps.  

After doing all this, click on Close & Apply at the top left.  

Column - Power BI
Column – Power BI


Data visualization: 

Now we are ready to visualize the data. On the right, you can see all the imported columns from the CSV file. 


Data visuals - Power BI
Data visuals – Power BI


1. Clustered column chart:


Let us create a clustered column chart to visualize 4th grade scores per year. To do this first select clustered column chart from the Visualizations pane. After that, drag down the Year column to the X-axis and GRADES_4_G to the y-axis. 

Graph - Power BI
Graph – Power BI

As we can see from the graph above, the sum of all the grades lies in the same range every year 


2. Line chart:


Now Let us make a line chart showing local revenue affected every year. For that, we can select a line chart from the Visualizations pane. Select Year as the x-axis and LOCAL_REVENUE as the y-axis.  

Graph, Line chart - Power BI
Graph, Line chart – Power BI

From the above graph, we can see the local revenue increasing every year 


3. Pie chart:


If we want to see the Revenue generated by each; Local, Federal, and State. We can use a Pie Chart for that. We can select Pie Chart from the pane and drag LOCAL_REVENUE, FEDERAL_REVENUE and STATE_REVENUE to the values tab. 

Pie chart - Power BI
Pie chart – Power BI

The pie chart shows the sum of different amounts of revenue  


4. Area chart:


At last, we can compare any two grades to see their revenue changes during the past years. For this purpose, we can use the Area Chart from the visualizations pane and use GRADES_4_G as the y-axis and GRADES_12_G as the secondary y-axis. Drag YEAR to the x-axis.  

Pie chart - Power BI
Pie chart – Power BI

The Area chart shows the difference in grades of class 4 and 12 on top of each other. 

Finally, we have this report to showcase to our colleagues or friends. 


Conclusion: 

In this blog, we saw how to use the tool for data transformation and what are some different graphs we can use to visualize academic data. Learn more about Power BI in the course offered by Data Science Dojo and enable yourself to emulate these learnings at work. 

register button


Ayesha Saleem - Digital content creator - Author
Ayesha Saleem
| November 9

Power BI transforms your data into visually immersive and interactive insights. It connects your multiple sources of data with the help of apps, software services, and connectors.

Whether you save your data on an excel spreadsheet, on cloud premises, or on on-premises data warehouses, Power BI gathers and shares your data easily with anyone whenever you want. 

Learn Power BI
4 key steps of learning Power BI – Data Science Dojo


Who uses Power BI? 

The use of it may vary depending on the purpose you need to fulfill. Mostly, the software is used for presenting reports and viewing data dashboards and presentations. If you are responsible for creating reports, presenting weekly datasheets, or even being involved in data analysis then probably you might make extensive use of Power BI Desktop or Report Builder to create reports. Also, it allows you to publish your report to its service where you can view and share it later.   

Whereas developers use Power BI APIs to push data into datasets or to embed dashboards and reports into their own custom applications. 


Let’s learn how Power BI works step by step: 

 Loading dataset in Power BI 

On the dashboard, there are a number of options to use for uploading or importing your dataset. So, the first step is to import your dataset. The software supports a number of data reports formats that we discussed earlier. Let’s say you add an excel sheet to Power BI, for that click on excel workbook on the main screen and simply select the file you want to upload.  

As your data is visible now, first you need to perform data pre-processing which requires cleaning up your data and then transforming your data. As you click on transform data, you will be taken to the power query editor. 

Power Query Editor 

Power Query is the engine behind Power BI. All the data pre-processing is going to be done in this window. It cleans and import millions of rows into the data model to help you perform data analysis after. 

The tool is simple to use and requires no code to do any task. With the help of Power Query, it is possible to Extract, Transform, and Load the data. The tool offers the following benefits and simplify the tasks you perform regularly: 

  • In order to access and transform data regularly, you enter a repeatable query that just needs to be refreshed in the future to get up to data.  
  • Power Query provides connectivity to hundreds of data sources and over 350 different types of data transformations 
  • Equipped with a number of pre-built transformation functions as simple as adding or deleting rows 

Build visuals with your data 

You can check out a number of Power BI visualizations that you can choose from the visualization pane. Simply choose from the range of visuals available in the panel. 

You can create custom data visualizations if you can’t find the visual you want in AppSource. To differentiate your organization and build something distinctive, personalize data visualizations. When they’re ready, you can share what you’ve created with your team or publish it to its community. 

Working with the eye-catching visuals increase comprehension, retention, and appeal that help you interact with your data and make informed decisions quickly. 

Watch this video to learn each step of developing visuals for your specific industry and business: 

Number of visualizations options offered by Power BI 

It is a data visualization and analysis tool that offers different types of visualizations. The most popular and useful ones are Charts, Maps, Tables, and Data Bars. 

Charts are a simple way to present data in an easy-to-understand format. They can be used for showing trends, comparisons or changes over time. A map is a great way to show the geographical location of certain events or how they relate to each other on a map. A table provides detailed information that can be sorted by columns and rows so it’s easier to analyze the information in the table. Data bars are used to show progress towards goals or targets with their height representing the amount of progress made. 

Career opportunities with Power BI

Power BI:

Analyst
Software Engineer
Senior Business Intelligence Analyst

Business Analyst
Data Analyst
Developer

Senior Software Engineer

Recently, the use of this tool has increased and has been adopted widely in multiple industries. It includes IT, healthcare, financial services, insurance, staffing & recruiting, and computer software. Some of the major companies that use the tool include:

Adobe (USA)
Conde Nast (USA)
Dell (USA)
Hospital Montfort (Canada)
Kraft Heinz Co (USA)
Meijer (USA)
Nestle (China)
Rolls-Royce Holdings PLC (UK)

The average annual salary of a Power BI professional in Unites States is $100,726 /yr.

Begin learning Power BI now!

The advantage of this visualization tool is its ease of use, even by people who don’t consider themselves to be very technologically proficient. As long as you have access to the data sources, the dashboard, and a working network connection, you can use it to process the information, create the necessary reports, and send them off to the right teams or individuals.

Start learning Power BI today with Data Science Dojo and excel your career

register button
 
Author - Fatima
Fatima Rafique
| November 3

In this blog, we will discuss the key ingredients for a great chart. We will highlight the Data Science Dojo session held by Nick Desbarats.

(more…)

Data Science Dojo
Guest blog
| September 6

The current world relies on data visualization for things to run smoothly. There have been multiple research projects on nonverbal communication and many researchers came to comparable results that 93% of all communication is nonverbal. Whether you are scrolling on social media or watching television, you are consuming data. Data scientists strongly believe that data can create or break your business brand.  

The concept of content marketing strategy requires you to have a unique operating model to attain your business objective. Remember that everybody is busy, and no one has time to read dull content on the internet.

This is where the art of data visualization comes in to help the dreams of many digital marketers come true. Below are some practical data visualization techniques that you can use to supercharge your content strategy!  

Data visualization tips

1. Invest in accurate data  

Everybody loves to read the information they can rely on and use in decision-making. When you present data to your audience in the form of visualization make sure the data is accurate and mention its source to gain the trust of your audience. You need to ensure that all the information you have is highly accurate and can be utilized in decision-making.  

If your business brand presents inaccurate data, you are likely to lose many potential clients who depend on your Company. Obviously, customers are likely to come and view your visual content, but they won’t be happy because your data is inaccurate. Remember that there is no harm in gathering information from a third-party source. You only need to ensure that the information is accurate.

According to the ERP-information data can never be 100% accurate but it can be more or less accurate depending on how close it adheres to reality. The closer that data sticks to reality, the higher its accuracy.  

2. Use real-time data to be unique  

Posting real-time data is an excellent way of attracting a significant number of potential customers. Many people opt for brands that present data on time, depending on the market situation. This strategy proved to be efficient during the black Friday season, whereby companies recorded a significant number of sales within the shortest time.  

In addition, real-time data plays a critical role in building trust between a brand and its customers. When customers realize that you are posting things that are just happening, their level of true skyrockets. 

3. Create a story 

Once you have decided about including visual content in your content strategy, you also need to find out an exciting story that the visual will present to the audience. Before you start authoring the story, think about the ins and outs of your content to ensure that you have nailed everything in your head.  

You can check out the types of visual content that have been created by some of the big brands on the internet. Try to mimic how these brands present their stories to the audience.  

4. Promote visualizations perfectly 

Promoting imagery content does not mean that you need to spend the whole day working on a single visual. Create simpler and more interactive excel charts (Bar chart, Line chart, Sankey diagram, and Box and Whisker Plot, etc.) to encourage your audience. This is not what promoting means! It means that you need to communicate to your audience directly through different social media platforms.  

Also, you can opt to send direct emails, given the fact that you have their contact details. The ultimate goal of this campaign is to make your visual go viral across the internet and reach as many people as possible. Ensure that you know your target audience to make your efforts yield profit.  

5. Gather and present unique data  

Representation of data plays a fundamental role when developing a unique identity for your brand.  You have the power to use visuals to make your brand stand out from your competitors. Collecting and presenting unique data gives you an added advantage in business that makes you unique. 

To achieve this level of big data, you need to conduct in-depth research and dig down across different variables to find unique data. Even though it may sound simple, this is not the case. Also, selecting big data is simple, but the complexity comes with selecting the most appropriate data points.  

6. Know your audience 

Getting to know your audience is a fundamental aspect that you should always consider. It gives you detailed insights not about understanding the nature of your content but also about promoting your visualization. To be able to encourage your visualization ideally, you need to understand your audience. 

When designing different visualization types, you should also channel all your eyes to the platform you are targeting. Decide on the media where you are sharing various types of content depending on the nature of the audience available on the respective platforms. 

7. Understand your craft 

Conduct in-depth research to understand what works for you and what doesn’t work. For instance, one of the benefits of data visualization is that it reduces the time it takes to read through loads of content. If you are mainly writing content for your readers to share across the market audience, a maximum of two hundred and thirty words is enough. 

It is an art and science that requires you to conduct remarkable research to uncover essential information. Once you uncover the necessary information, you will definitely get to know your craft.  

8. Learn from the best  

The digital marketing world involves continuous learning to remain at the top of the game. The best way to learn in business is to monitor what the developed brands are doing to succeed. You can learn the content strategy used by international companies such as Netflix to get a test of what it means to promote your brand across its target market.  

 9. Gather the respective data visualization tool 

After conducting your research and settling on a story that reciprocates your brand, you have to gather the Respective tools necessary to generate the story you need. You would acquire creative tools with a successful track record of developing quality output. 

There are multiple data visualization tools on the web that you can choose and use. However, some people recommend starting from scratch, depending on the nature of the output they want. Some famous data visualization tools are Tableau, Microsoft Excel, Power BI, ChartExpo, and Plotly.  

10. Research and testing  

Do not forget about the power of research and testing. Acquire different tools to help you conduct research and test different elements to check if they can work and generate the desired results. You should be keen to analyze what can work for your business and what cannot.  

Need for data visualization

The business world is in dire need of representing data to enhance competitive content strategies. A study done by the Wharton School of Business has revealed that appealing visuals of  complex data can shorten a business meeting by 24% since all the essential elements are outlined clearly. However, to grab the attention of your target market, you need to come up with something unique to be successful. 

Related Topics

Statistics
Resources
Programming
Machine Learning
LLM
Generative AI
Data Visualization
Data Security
Data Science
Data Engineering
Data Analytics
Computer Vision
Career
Artificial Intelligence