Price as low as $4499 | Learn to build custom large language model applications

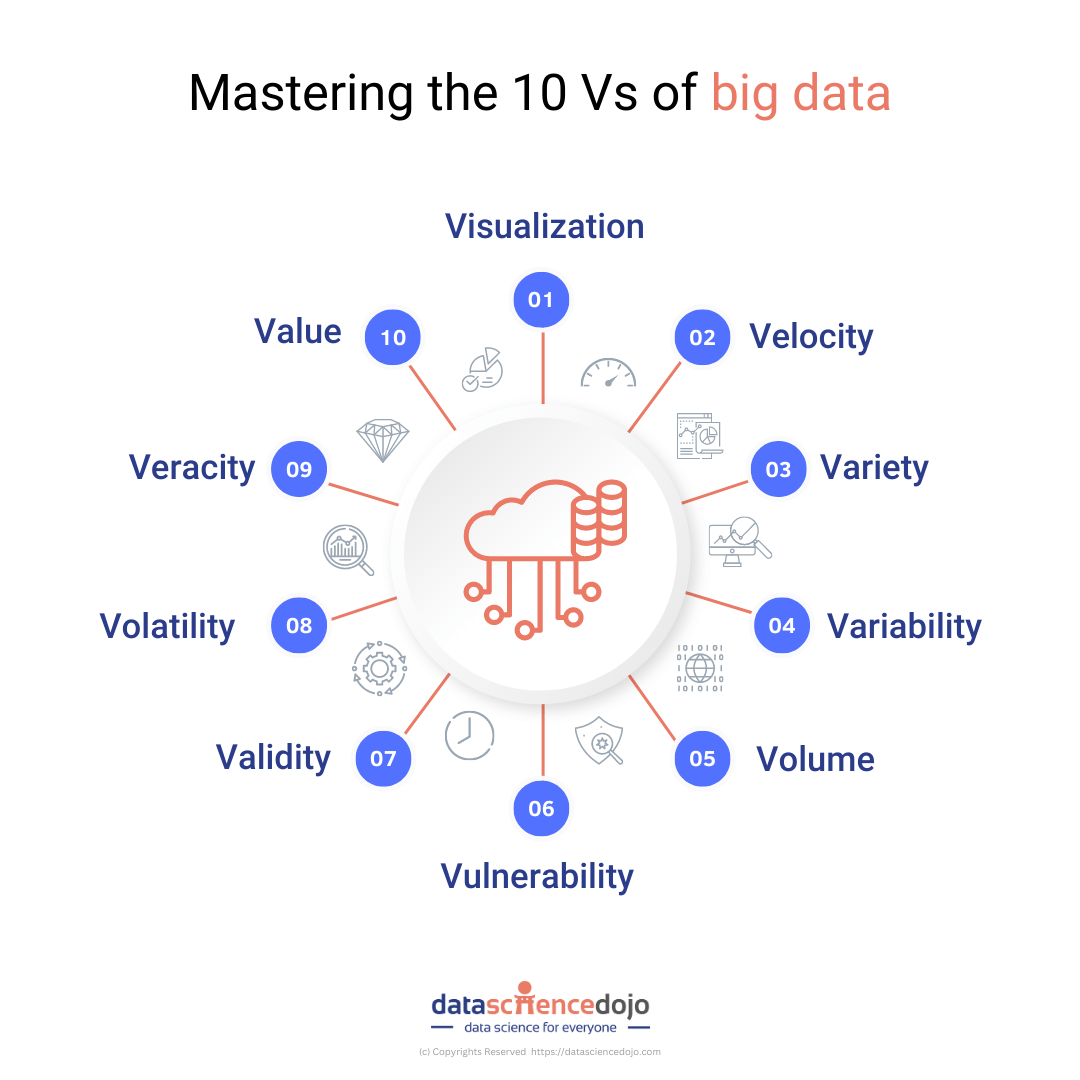
Big data is conventionally understood in terms of its scale. This one-dimensional approach, however, runs the risk of simplifying the complexity of big data. In this blog, we discuss the 10 Vs as metrics to gauge the complexity of big data. 

When we think of “big data,” it is easy to imagine a vast, intangible collection of customer information and relevant data required to grow your business. But the term “big data” isn’t about size – it’s also about the potential to uncover valuable insights by considering a range of other characteristics. In other words, it’s not just about the amount of data we have, but also how we use and analyze it. 

10 vs of big data
10 vs of big data

Volume 

The most obvious feature is the volume that captures the sheer scale of a certain dataset. Consider, for example, 40,000 apps added to the app store each year. Similarly, 1 in 40,000 searches are made over Google every second. 

Big numbers carry the immediate appeal of big data. Whether it is the 2.2 billion active monthly users on Facebook or the 2.2 billion cups of coffee that are consumed in single day, big numbers capture qualities about large swathes of population, conveying insights that can feel universal in their scale.  

As another example, consider the 294 billion emails being sent every day. In comparison, there are 300 billion stars in the Milky Way. Somehow, the largeness of these numbers in a human context can help us make better sense of otherwise unimaginable quantities like the stars in the Milky Way! 


Velocity 

In nearly all the examples considered above, velocity of the data was also an important feature. Velocity adds to volume, allowing us to grapple with data as a dynamic quantity. In big data it refers to how quickly data is generated and how fast it moves. It is one of the three Vs of big data, along with volume and variety. Velocity is important for businesses that need their data to be quickly available for making informed decisions. 


Variety 

Variety, here, refers to the several types of data that are constantly in circulation and is an integral quality of big data. Different data sets are unstructured. This includes data shared over social media and instant messaging regularly such as videos, audio, and phone recordings. 

Then, there is the 10% semi-structured data in circulation including emails, webpages, zipped files, etc. Lastly, there is the rarity of structured data such as financial transactions. 

Data types are a defining feature of big data as unstructured data needs to be cleaned and structured before it can be used for data analytics. In fact, the availability of clean data is among the top challenges facing data scientists. According to Forbes, most data scientists spend 60% of their time cleaning data.  


Variability 

Variability is a measure of the inconsistencies in data and is often confused with variety. To understand variability, let us consider an example. You go to a coffee shop every day and purchase the same latte each day. However, it may smell or taste slightly or significantly different each day.  

This kind of inconsistency in data is an important feature as it places limits on the reproducibility of data. This is particularly relevant in sentiment analysis which is much harder for AI models as compared to humans. Sentiment analysis requires an additional level of input, i.e., context.  

An example of variability in big data can be seen when investigating the amount of time spent on phones daily by diverse groups of people. The data collected from different samples (high school students, college students, and adult full-time employees) can vary, resulting in variability. Another example could be a soda shop offering different blends of soda but having different taste every day, which is variability. 

Variability also accounts for the inconsistent speed at which data is downloaded and stored across various systems, creating a unique experience for customers consuming the same data.  


Veracity 

Veracity refers to the reliability of the data source. Numerous factors can contribute to the reliability of the input they provide at a particular time in a particular situation. 

Veracity is particularly important for making data-driven decisions for businesses as reproducibility of patterns relies heavily on the credibility of initial data inputs. 


Validity 

Validity pertains to the accuracy of data for its intended use. For example, you may acquire a dataset pertaining to data related to your subject of inquiry, increasing the task of forming a meaningful relationship and inquiry. Registered charity data contact lists 


Volatility

Volatility refers to the time considerations placed on a particular data set. It involves considering if data acquired a year ago would be relevant for analysis for predictive modeling today. This is specific to the analyses being performed. Similarly, volatility also means gauging whether a particular data set is historic or not. Usually, data volatility comes under data governance and is assessed by data engineers.  


Learn practical data science today!


Vulnerability 

Big data is often about consumers. We often overlook the potential harm in sharing our shopping data, but the reality is that it can be used to uncover confidential information about an individual. For instance, Target accurately predicted a teenage girl’s pregnancy before her own parents knew it. To avoid such consequences, it’s important to be mindful of the information we share online. 
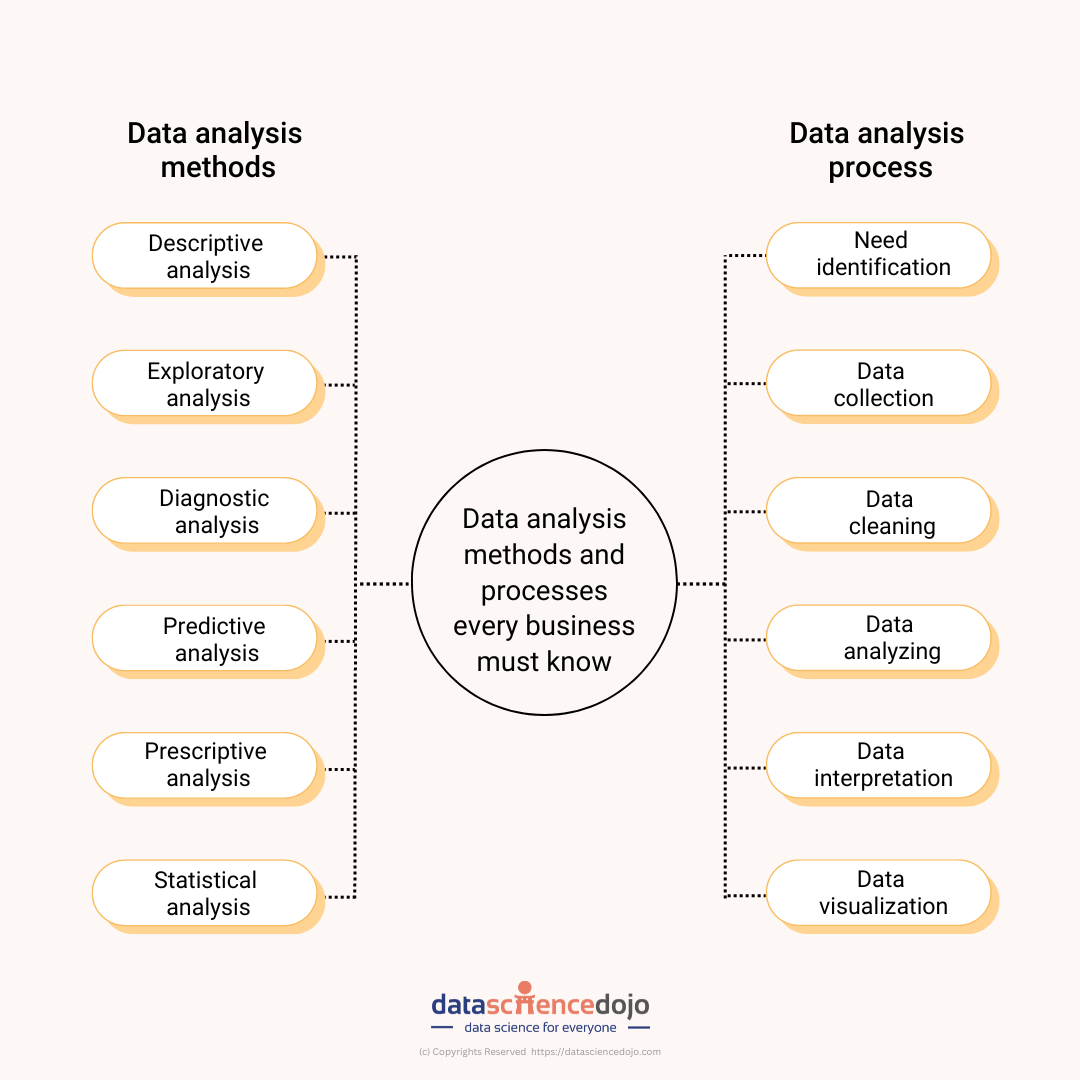
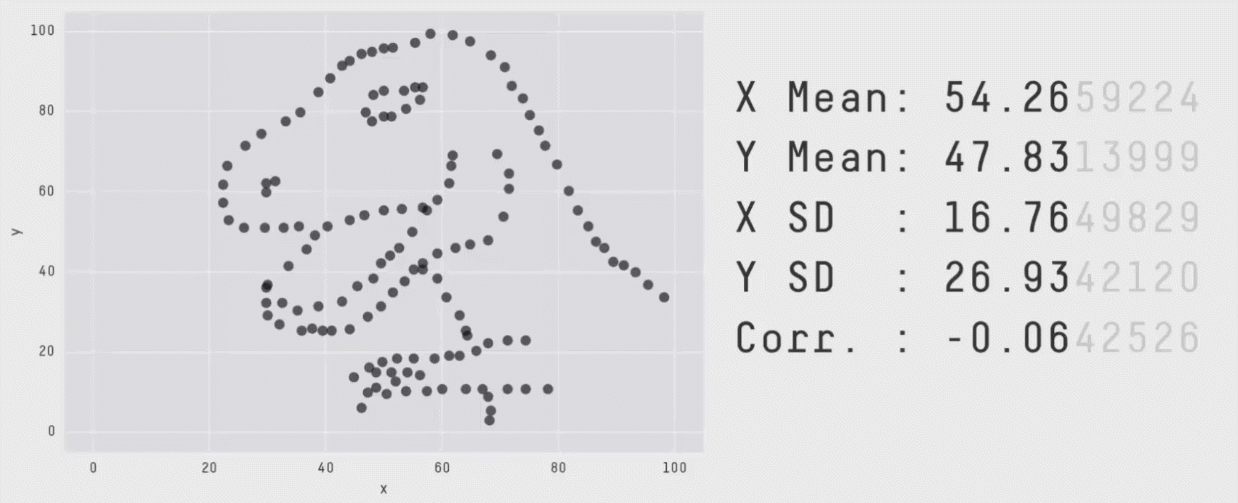
 

Visualization  

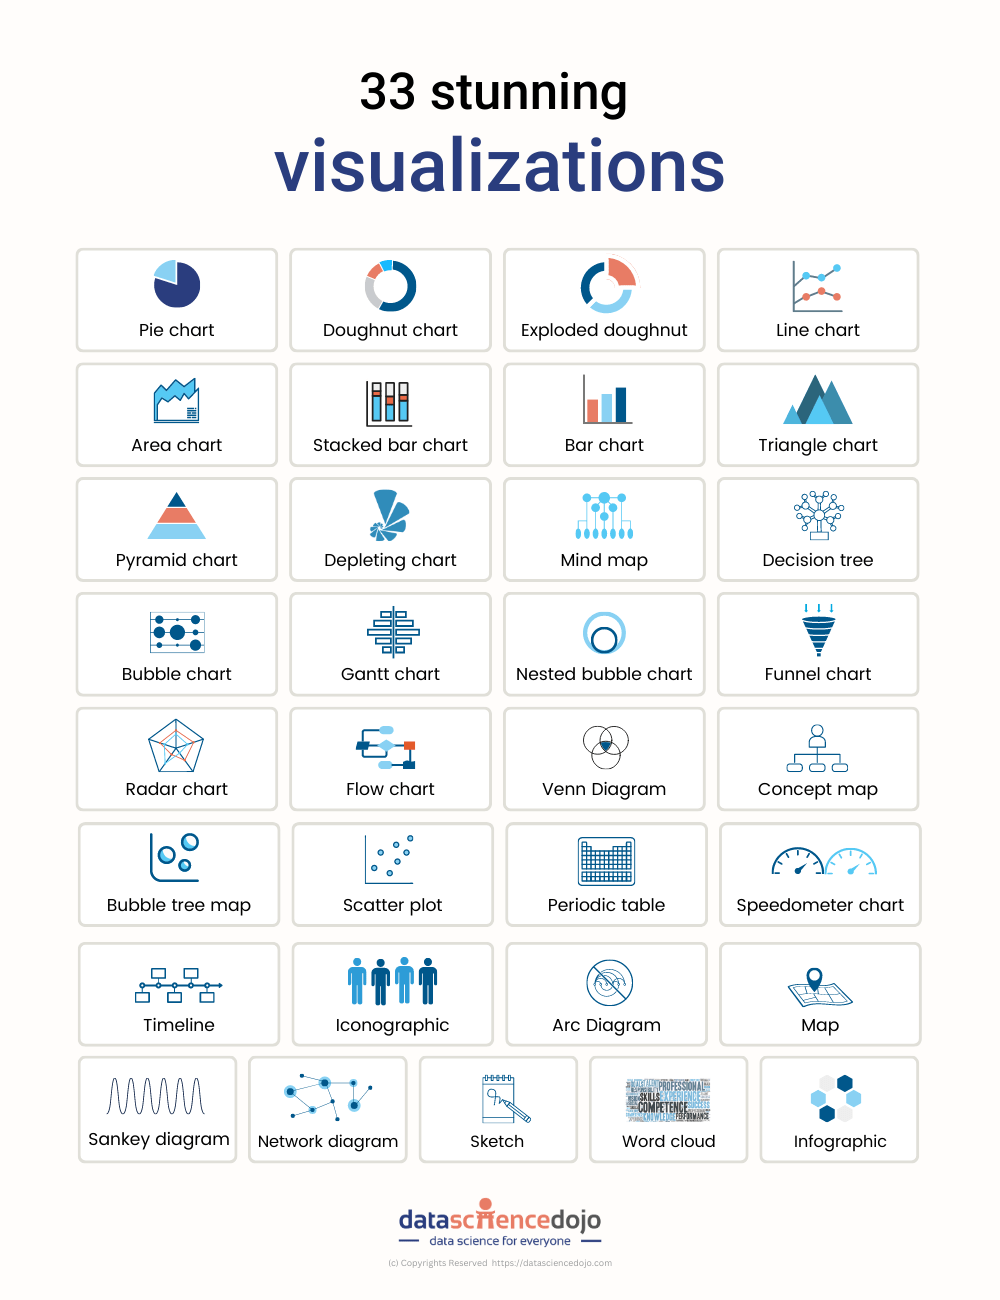
With a new data visualization tool being released every month or so, visualizing data is key to insightful results. The traditional x-y plot no longer suffices for the kind of complex detailing that goes into categorizations and patterns across various parameters obtained via big data analytics.  


Value 

BIG data is nothing if it cannot produce meaningful value. Consider, again, the example of Target using a 16-year-old’s shopping habits to predict her pregnancy. While in this case, it violates privacy, in most other cases, it can generate incredible customer value by bombarding them with the specific product advertisement they require. 


Learn about 10 Vs of big data by George Firican

10 Vs of Big Data 


Enable smart decision making with big data visualization

The 10 Vs of big data are Volume, Velocity, Variety, Veracity, Variability, Value, Viscosity, Volume growth rate, Volume change rate, and Variance in volume change rate. These are the characteristics of big data and help to understand its complexity.

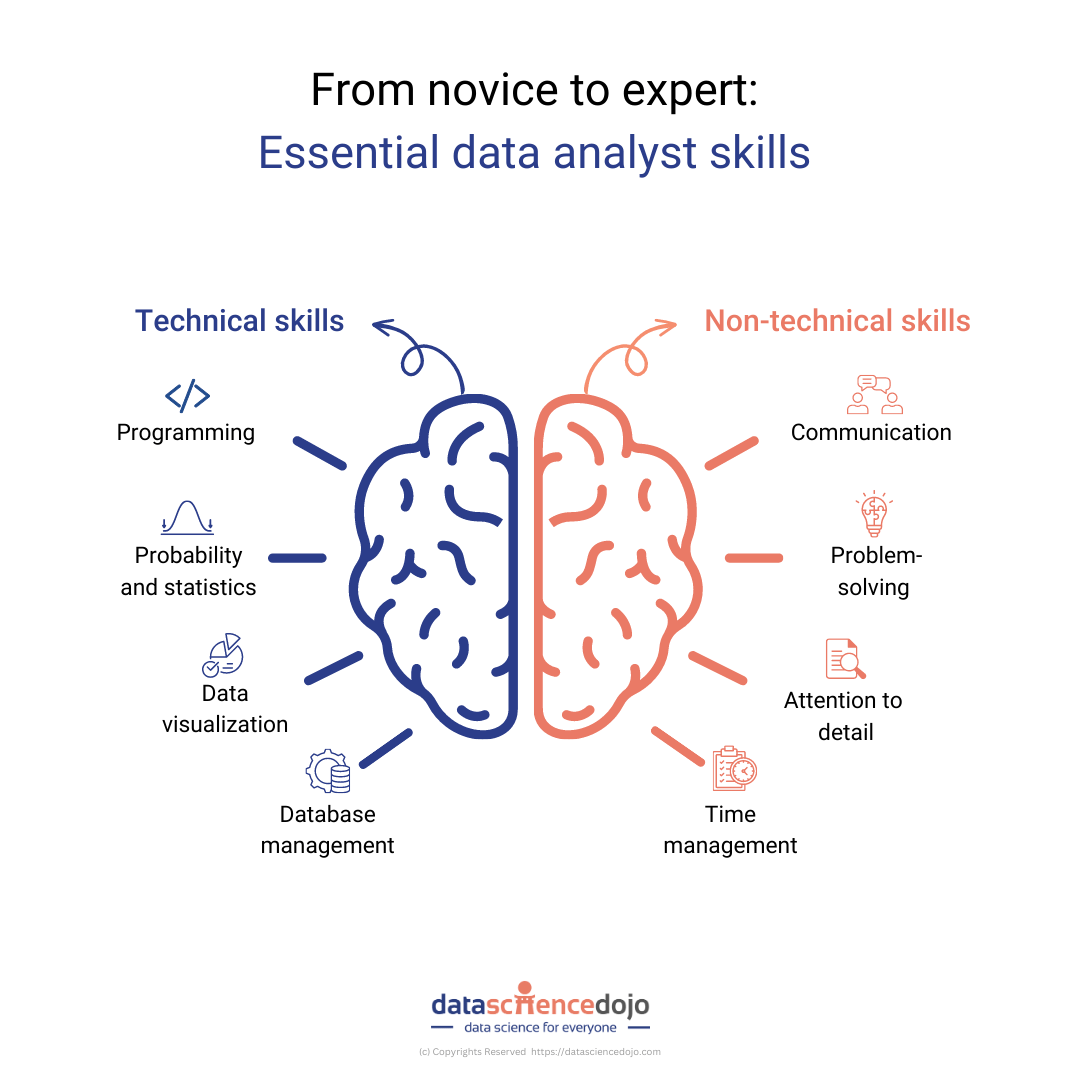
The skills needed to work with big data involve coding, although the level of knowledge required for coding is not as deep as that of a programmer. Big Data and Data Science are two concepts that play a crucial role in enabling data-driven decision making. 90% of the world’s data has been created in the last two years, providing an incredible amount of data being created daily.

Companies employ data scientists to use data mining and big data to learn more about consumers and their behaviors. Both Data Mining and Big Data Analysis are major elements of data science. 

Small Data, on the other hand, is collected in a more controlled manner,  whereas Big Data refers to data sets that are too large or complex to be processed by traditional data processing applications. 

Despite major layoffs in 2022, there are many optimistic fintech trends to look out for in 2023. Every crisis bespells new opportunities. In this blog, let’s see what the future holds for fintech trends in 2023.  (more…)

An overview of data analysis, the data analysis methods, its process, and implications for modern corporations. 


Studies show that 73% of corporate executives believe that companies failing to use data analysis on big data lack long-term sustainability. While data analysis can guide enterprises to make smart decisions, it can also be useful for individual decision-making 

Let’s consider an example of using data analysis at an intuitive individual level. As consumers, we are always choosing between products offered by multiple companies. These decisions, in turn, are guided by individual past experiences. Every individual analysis the data obtained via their experience to generate a final decision.  

Put more concretely, data analysis involves sifting through data, modeling it, and transforming it to yield information that guides strategic decision-making. For businesses, data analytics can provide highly impactful decisions with long-term yield. 


Data analysis methods and data analysis process
Data analysis methods and data analysis processes – Data Science Dojo


 So, let’s dive deep and look at how data analytics tools can help businesses make smarter decisions. 

The data analysis process 

The process includes five key steps:  

1. Identify the need

Companies use data analytics for strategic decision-making regarding a specific issue. The first step, therefore, is to identify the particular problem. For example, a company decides it wants to reduce its production costs while maintaining product quality. To do so effectively, the company would need to identify step(s) of the workflow pipeline it should implement cost cuts. 

Similarly, the company might also have a hypothetical solution to its question. Data analytics can be used to judge the falsifiability of the hypothesis, allowing the decision-maker to reach the optimized solution. 

A specific question or hypothesis determines the subsequent steps of the process. Hence, this must be as clear and specific as possible. 


2. Collect the data 

Once the data analysis need is identified, the subsequent kind of data is also determined. Data collection can involve data entered in different types and formats. One broad classification is based on structure and includes structured and unstructured data. 

 Structured data, for example, is the data a company obtains from its users via internal data acquisition methods such as marketing automation tools. More importantly, it follows the usual row-column database and is suited to the company’s exact needs. 

Unstructured data, on the other hand, need not follow any such formatting. It is obtained via third parties such as Google Trends, census bureaus, world health bureaus, and so on. Structured data is easier to work with as it’s already tailored to the company’s needs. However, unstructured data can provide a significantly larger data volume. 

There are many other data types to consider as well. For example, metadata, big data, real-time data, and machine data.  


3. Clean the data 

The third step, data cleaning, ensures that error-free data is used for the data analysis. This step includes procedures such as formatting data correctly and consistently, removing any duplicate or anomalous entries, dealing with missing data, and fixing cross-set data errors.  

 Performing these tasks manually is tedious and hence, various tools exist to smoothen the data-cleaning process. These include open-source data tools such as OpenRefine, desktop applications like Trifacta Wrangler, cloud-based software as a service (SaaS) like TIBCO Clarity, and other data management tools such as IBM Infosphere quality stage especially used for big data. 


4. Perform data analysis 

Data analysis includes several methods as described earlier. The method to be implemented depends closely on the research question to be investigated. Data analysis methods are discussed in detail later in this blog. 


5. Present the results 

Presentation of results defines how well the results are to be communicated. Visualization tools such as charts, images, and graphs effectively convey findings, establishing visual connections in the viewer’s mind. These tools emphasize patterns discovered in existing data and shed light on predicted patterns, assisting the results’ interpretation. 


Listen to the Data Analysis challenges in cybersecurity


Data analysis methods

Data analysts use a variety of approaches, methods, and tools to deal with data. Let’s sift through these methods from an approach-based perspective: 


1. Descriptive analysis 

Descriptive analysis involves categorizing and presenting broader datasets in a way that allows emergent patterns to be observed from them to see if there are any obvious patterns. Data aggregation techniques are one way of performing descriptive analysis. This involves first collecting the data and then sorting it to ease manageability. 

This can also involve performing statistical analysis on the data to determine, say, the measures of frequency, dispersion, and central tendencies that provide a mathematical description for the data.
 

2. Exploratory analysis 

Exploratory analysis involves consulting various data sets to see how certain variables may be related, or how certain patterns may be driving others. This analytic approach is crucial in framing potential hypotheses and research questions that can be investigated using data analytic techniques.  

Data mining, for example, requires data analysts to use exploratory analysis to sift through big data and generate hypotheses to be tested. 


3. Diagnostic analysis 

Diagnostic analysis is used to answer why a particular pattern exists in the first place. For example, this kind of analysis can assist a company in understanding why its product is performing in a certain way in the market. 

Diagnostic analytics includes methods such as hypothesis testing, determining correlations v/s causation, and diagnostic regression analysis. 


4. Predictive analysis 

Predictive analysis answers the question of what will happen. This type of analysis is key for companies in deciding new features or updates on existing products, and in determining what products will perform well in the market.  

 For predictive analysis, data analysts use existing results from the earlier described analyses while also using results from machine learning and artificial intelligence to determine precise predictions for future performance. 


5. Prescriptive analysis 

Prescriptive analysis involves determining the most effective strategy for implementing the decision arrived at. For example, an organization can use prescriptive analysis to sift through the best way to unroll a new feature. This component of data analytics actively deals with the consumer end, requiring one to work with marketing, human resources, and so on.  

 Prescriptive analysis makes use of machine learning algorithms to analyze large amounts of big data for business intelligence. These algorithms can assess large amounts of data by working through them via “if” and “else” statements and making recommendations accordingly. 


6. Quantitative and qualitative analysis 

Quantitative analysis computationally implements algorithms testing out a mathematical fit to describe correlation or causation observed within datasets. This includes regression analysis, null analysis, hypothesis analysis, etc.  

Qualitative analysis, on the other hand, involves non-numerical data such as interviews and pertains to answering broader social questions. It involves working closely with textual data to derive explanations.  


7. Statistical analysis 

Statistical techniques provide answers to essential decision challenges. For example, they can accurately quantify risk probabilities, predict product performance, establish relationships between variables, and so on. These techniques are used by both qualitative and quantitative analysis methods. Some of the invaluable statistical techniques for data analysts include linear regression, classification, resampling methods, and subset selection.  

Statistical analysis, more importantly, lies at the heart of data analysis, providing the essential mathematical framework via which analysis is conducted. 


Data-driven businesses

Data-driven businesses use the data analysis methods described above. As a result, they offer many advantages and are particularly suited to modern needs. Their credibility relies on them being evidence-based and using precise mathematical models to determine decisions.

Some of these advantages include stronger customer needs, precise identification of business needs, devising effective strategy decisions, and performing well in a competitive market. Data-driven businesses are the way forward. 

Data science myths are one of the main obstacles preventing newcomers from joining the field. In this blog, we bust some of the biggest myths shrouding the field. 


The US Bureau of Labor Statistics predicts that data science jobs will grow up to 36% by 2031. There’s a clear market need for the field, and its popularity only increases by the day. Despite the overwhelming interest data science has generated, there are many myths preventing new entry into the field.  

data science myths
Top 7 data science myths


Data science myths, at their heart, follow misconceptions about the field at large. So, let’s dive into unveiling these myths. 


1. All data roles are identical 

 It’s a common data science myth that all data roles are the same. So, let’s distinguish between some common data roles: data engineer, data scientist, and data analyst. A data engineer focuses on implementing infrastructure for data acquisition and data transformation to ensure data availability for other roles. 

A data analyst, however, uses data to report any observed trends and patterns. Using both the data and the analysis provided by a data engineer and a data analyst, a data scientist works on predictive modeling, distinguishing signals from noise, and deciphering causation from correlation.  

Finally, these are not the only data roles. Other specialized roles, such as data architects and business analysts, also exist in the field. Hence, a variety of roles exist under the umbrella of data science, catering to a variety of individual skill sets and market needs. 


2. Graduate studies are essential 

 Another myth preventing entry into the data science field is that you need a master’s or Ph.D. degree. This is also completely untrue.  

In busting the last myth, we saw how data science is a diverse field, welcoming various backgrounds and skill sets. As such, a Ph.D. or master’s degree is only valuable for specific data science roles. For instance, higher education is useful in pursuing research in data.  

However, if you’re interested in working on real-life complex data problems using data analytics methods such as deep learning, only knowledge of those methods is necessary. And so, rather than a master’s or Ph.D. degree, acquiring specific valuable skills can come in handy in kickstarting your data science career.  


3. Data scientists will be replaced by artificial intelligence   

As artificial intelligence advances, a common misconception arises that AI will replace all human intelligent labor. This misconception has also found its way into the field, forming one of the most popular myths that AI will replace data scientists.  

This is far from the truth because. Today’s AI systems, even the most advanced ones, require human guidance to work. Moreover, the results produced by them are only useful when analyzed and interpreted in the context of real-world phenomena, which requires human input. 

So, even as data science methods head towards automation, it’s data scientists who shape the research questions, devise the analytic procedures to be followed, and lastly, interpret the results.  

Read about: 2023 AI and Machine Learning trends


4. Data scientists are expert coders 

 Being a data scientist does not translate into being an expert programmer! Programming tasks are only one component of the data science field, and these too, vary from one data science subfield to another.  

For example, a business analyst would require a strong understanding of business, and familiarity with visualization tools, while minimal coding knowledge would suffice. At the same time, a machine learning engineer would require extensive knowledge of Python.  

In conclusion, the extent of programming knowledge depends on where you want to work across the broad spectrum of the data field.  


5. Learning a tool is enough to become a data scientist  

Knowing a particular programming language, or a data visualization tool is not all you need to become a data scientist. While familiarity with tools and programming languages certainly helps, this is not the foundation of what makes a data scientist. 

So, what makes a good data science profile? That, really, is a combination of various skills, both technical and non-technical. On the technical end, there are mathematical concepts, algorithms, data structures, etc. On the non-technical end, there are business skills and understandings of various stakeholders in a particular situation.  

To conclude, a tool can be an excellent way to implement data skills. However, it isn’t what will teach you the foundations or the problem-solving aspect of data science. 


6. Data scientists only work on predictive modeling 

Another myth! Very few people would know that data scientists spend nearly 80% of their time on data cleaning and transforming before working on data modeling. In fact, bad data is the major cause of productivity levels not being up to par in data science companies. This requires significant focus on producing good quality data in the first place. 

This is especially true when data scientists work on problems involving big data. These problems involve multiple steps of which data cleaning and transformations are key. Similarly, data from multiple sources and raw data can contain junk that needs to be carefully removed so that the model runs smoothly.   

So, unless we find a quick-fix solution to data cleaning and transformation, it’s a total myth that data scientists only work on predictive modeling.  


7. Transitioning to data science is impossible 

Data science is a diverse and versatile field, welcoming a multitude of background skill sets. While technical knowledge of algorithms, probability, calculus, and machine learning can be great, non-technical knowledge such as business skills or social sciences can also be useful for a career. 

Any data science myths we missed?

 At its heart, data science involves complex problem solving involving multiple stakeholders. For a data-driven company, a data scientist from a purely technical background could be valuable, but so could one from a business background who can better interpret results or shape research questions. 

 And so, it’s a total myth that transitioning to data science from another field is impossible. 


It is no surprise that the demand for a skilled data analyst grows across the globe. In this blog, we will explore eight key competencies that aspiring data analysts should focus on developing. 


Data analysis is a crucial skill in today’s data-driven business world. Companies rely on data analysts to help them make informed decisions, improve their operations, and stay competitive. And so, all healthy businesses actively seek skilled data analysts. 


Technical skills and non-technical skills for data analyst


Becoming a skilled data analyst does not just mean that you acquire important technical skills. Rather, certain soft skills such as creative storytelling or effective communication can mean a more all-rounded profile. Additionally, these non-technical skills can be key in shaping how you make use of your data analytics skills. 

Technical skills to practice as a data analyst: 

Technical skills are an important aspect of being a data analyst. Data analysts are responsible for collecting, cleaning, and analyzing large sets of data, so a strong foundation in technical skills is necessary for them to be able to do their job effectively.

Some of the key technical skills that are important for a data analyst include:

1. Probability and statistics:  

A solid foundation in probability and statistics ensures your ability to identify patterns in data, prevent any biases and logical errors in the analysis, and lastly, provide accurate results. All these abilities are critical to becoming a skilled data analyst. 

 Consider, for example, how various kinds of probabilistic distributions are used in machine learning. Other than a strong understanding of these distributions, you will need to be able to apply statistical techniques, such as hypothesis testing and regression analysis, to understand and interpret data. 


2. Programming:  

As a data analyst, you will need to know how to code in at least one programming language, such as Python, R, or SQL. These languages are the essential tools via which you will be able to clean and manipulate data, implement algorithms and build models. 

Moreover, statistical programing languages like Python and R allow advanced analysis that interfaces like Excel cannot provide. Additionally, both Python and R are open source.  

3. Data visualization 

A crucial part of a data analyst’s job is effective communication both within and outside the data analytics community. This requires the ability to create clear and compelling data visualizations. You will need to know how to use tools like Tableau, Power BI, and D3.js to create interactive charts, graphs, and maps that help others understand your data. 


Dataset
The progression of the Datasaurus Dozen dataset through all of the target shapes – Source


4. Database management:  

Managing and working with large and complex datasets means having a solid understanding of database management. This includes everything from methods of collecting, arranging, and storing data in a secure and efficient way. Moreover, you will also need to know how to design and maintain databases, as well as how to query and manipulate data within them. 

Certain companies may have roles particularly suited to this task such as data architects. However, most will require data analysts to perform these duties as data analysts responsible for collecting, organizing, and analyzing data to help inform business decisions. 

Organizations use different data management systems. Hence, it helps to gain a general understanding of database operations so that you can later specialize them to a particular management system.  

Non-technical skills to adopt as a data analyst:  

Data analysts work with various members of the community ranging from business leaders to social scientists. This implies effective communication of ideas to a non-technical audience in a way that drives informed, data-driven decisions. This makes certain soft skills like communication essential.  

Similarly, there are other non-technical skills that you may have acquired outside a formal data analytics education. These skills such as problem-solving and time management are transferable skills that are particularly suited to the everyday work life of a data analyst. 

1. Communication 

As a data analyst, you will need to be able to communicate your findings to a wide range of stakeholders. This includes being able to explain technical concepts concisely and presenting data in a visually compelling way.  

Writing skills can help you communicate your results to wider members of population via blogs and opinion pieces. Moreover, speaking and presentation skills are also invaluable in this regard. 


Read about Data Storytelling and its importance

2. Problem-solving:   

Problem-solving is a skill that individuals pick from working in different fields ranging from research to mathematics, and much more. This, too, is a transferable skill and not unique to formal data analytics training. This also involves a dash of creativity and thinking of problems outside the box to come up with unique solutions. 

Data analysis often involves solving complex problems, so you should be a skilled problem-solver who can think critically and creatively. 

3. Attention to detail: 

Working with data requires attention to detail and an elevated level of accuracy. You should be able to identify patterns and anomalies in data and be meticulous in your work. 

4. Time management:  

Data analysis projects can be time-consuming, so you should be able to manage your time effectively and prioritize tasks to meet deadlines. Time management can also be implemented by tracking your daily work using time management tools.  


Final word 

Overall, being a data analyst requires a combination of technical and non-technical skills. By mastering these skills, you can become an invaluable member of any team and make a real impact with your data analysis. 


Data visualization is key to effective communication across all organizations. In this blog, we briefly introduce 33 tools to visualize data. 


Data-driven enterprises are evidently the new normal. Not only does this require companies to wrestle with data for internal and external decision-making challenges, but also requires effective communication. This is where data visualization comes in. 


Without visualization results found via rigorous data analytics procedures, key analyses could be forgone. Here’s where data visualization methods such as charts, graphs, scatter plots, 3D visualization, and so on, simplify the task. Visual data is far easier to absorb, retain, and recall.  


And so, we describe a total of 33 data visualization tools that offer a plethora of possibilities.  


Recommended data visualization tools you must know about  

Data visualization - 33 ways


Using these along with data visualization tips ensures healthy communication of results across organizations. 


1. Visual.ly 


Popular for its incredible distribution network which allows data import and export to third parties, Visual.ly is a great data visualization tool in the market.  


2. Sisense 


Known for its agility, Sisense provides immediate data analytics by means of effective data visualization. This tool identifies key patterns and summarizes data statistics, assisting data-driven strategies. 


3. Data wrapper 


Data Wrapper, a popular and free data visualization tool, produces quick charts and other graphical presentations of the statistics of big data.  


4. Zoho reports 


Zoho Reports is a straightforward data visualization tool that provides online reporting services on business intelligence. 


5. Highcharts 


The Highcharts visualization tool is used by many global top companies and works seamlessly in visualizing big data analytics.  


6. Qlikview 


Providing solutions to around 40,000 clients across a hundred countries, Qlickview’s data visualization tools provide features such as customized visualization and enterprise reporting for business intelligence. 


7. Sigma.js 


A JavaScript library for creating graphs, Sigma uplifts developers by making it easier to publish networks on websites.  


8. JupyteR 


A strongly rated, web-based application, JupyteR allows users to share and create documents with equations, code, text, and other visualizations.  


9. Google charts 


Another major data visualization tool, Google charts is popular for its ability to create graphical and pictorial data visualizations. 


10. Fusioncharts 


Fusioncharts is a Javascript-based data visualization tool that provides up to ninety chart-building packages that seamlessly integrate with significant platforms and frameworks.  


11. Infogram 


Infogram is a popular web-based tool used for creating infographics and visualizing data.  


12. Polymaps 


A free Javascript-based library, Polymaps allows users to create interactive maps in web browsers such as real-time display of datasets. 


13. Tableau 


Tableau allows its users to connect with various data sources, enabling them to create data visualization by means of maps, dashboards, stories, and charts, via a simple drag-and-drop interface. Its applications are far-reaching such as exploring healthcare data 


14. Klipfolio 


Klipfolio provides immediate data from hundreds of services by means of pre-built instant metrics. It’s ideal for businesses that require custom dashboards 


15. Domo 


Domo is especially great for small businesses thanks to its accessible interface allowing users to create advanced charts, custom apps, and other data visualizations that assist them in making data-driven decisions.  


16. Looker 


A versatile data visualization tool, Looker provides a directory of various visualization types from bar gauges to calendar heat maps.  


17. Qlik sense 


Qlik Sense uses artificial intelligence to make data more understandable and usable. It provides greater interactivity, quick calculations, and the option to integrate data from hundreds of sources. 


18. Grafana 


Allowing users to create dynamic dashboards and offering other visualizations, Grafana is a great open-source visualization software.  


19. Chartist.js 


This free, open-source Javascript library allows users to create basic responsive charts that offer both customizability and compatibility across multiple browsers.  


20. Chart.js 


A versatile Javascript library, Chart.js is open source and provides a variety of 8 chart types while allowing animation and interaction.  


21. D3.js 


Another Javascript library, D3.js requires some Javascript knowledge and is used to manipulate documents via data.  


22. ChartBlocks 


ChartBlocks allows data import from nearly any source. It further provides detailed customization of visualizations created. 


23. Microsoft Power BI 


Used by nearly 200K+ organizations, Microsoft Power BI is a data visualization tool used for business intelligence datatypes. However, it can be used for educational data exploration as well.  


24. Plotly 


Used for interactive charts, maps, and graphs, Plotly is a great data visualization tool whose visualization products can be shared further on social media platforms. 


25. Excel 


The old-school Microsoft Exel is a data visualization tool that provides an easy interface and offers visualizations such as scatter plots, which establish relationships between datasets. 


26. IBM watson analytics 


IBM’s cloud-based investigation administration, Watson Analytics allows users to discover trends in information quickly and is among their top free tools. 


27. FushionCharts 


A product of InfoSoft Global, FusionCharts is used by nearly 80% of Fortune 500 companies across the globe. It provides over ninety diagrams and outlines that are both simple and sophisticated.  


28. Dundas BI 


This data visualization tool offers highly customizable visualization with interactive maps, charts, scorecards. Dundas BI provides a simplified way to clean, inspect, and transform large datasets by giving users full control over the visual elements.  


29. RAW 


RAW, or RawGraphs, works as a link between spreadsheets and data visualization. Providing a variety of both conventional and non-conventional layouts, RAW offers quality data security. 


30. Redash 


An open-source web application, Redas is used for database cleaning and visualizing results.  


31. Dygraphs 


A fast, open-source, Javascript-based charting library, Dygraphs allows users to interpret and explore dense data sets.  


32. RapidMiner 


A data science platform for companies, RapidMiner allows analyses of the overall impact of organizations’ employees, data, and expertise. This platform supports many analytics users.  


33. Gephi 


Among the top open-source and free visualizations and exploration softwares, Gephi provides users with all kinds of charts and graphs. It’s great for users working with graphs for simple data analysis.