

Power BI transforms your data into visually immersive and interactive insights. It connects your multiple sources of data with the help of apps, software services, and connectors.
Whether you save your data on an excel spreadsheet, on cloud premises, or on on-premises data warehouses, Power BI gathers and shares your data easily with anyone whenever you want.
Who uses Power BI?
The use of it may vary depending on the purpose you need to fulfill. Mostly, the software is used for presenting reports and viewing data dashboards and presentations. If you are responsible for creating reports, presenting weekly datasheets, or even being involved in data analysis then probably you might make extensive use of Power BI Desktop or Report Builder to create reports. Also, it allows you to publish your report to its service where you can view and share it later.
Whereas developers use Power BI APIs to push data into datasets or to embed dashboards and reports into their own custom applications.
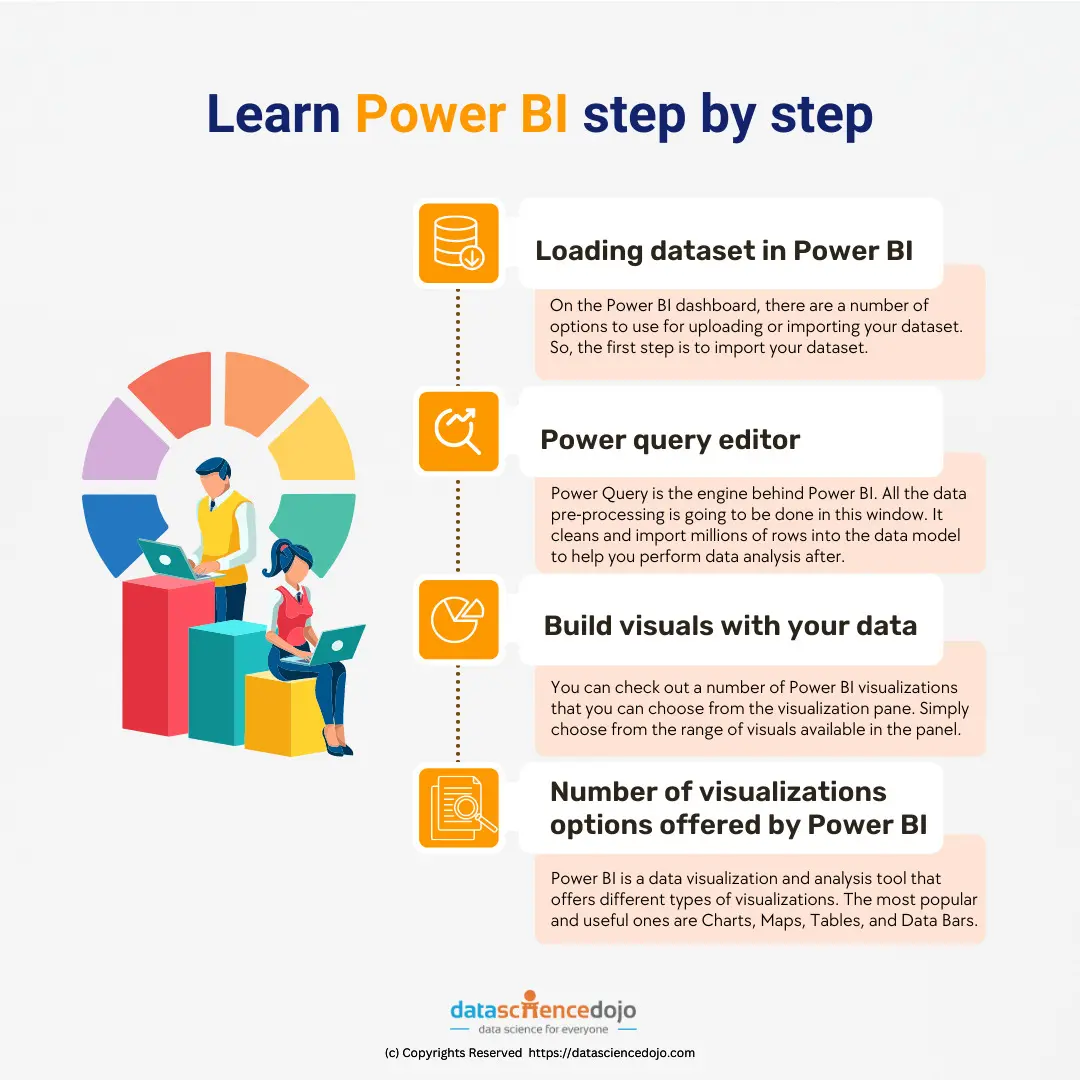
Let’s learn how Power BI works step by step:
Loading dataset in Power BI
On the dashboard, there are a number of options to use for uploading or importing your dataset. So, the first step is to import your dataset. The software supports a number of data reports formats that we discussed earlier. Let’s say you add an excel sheet to Power BI, for that click on excel workbook on the main screen and simply select the file you want to upload.
As your data is visible now, first you need to perform data pre-processing which requires cleaning up your data and then transforming your data. As you click on transform data, you will be taken to the power query editor.
Power Query Editor
Power Query is the engine behind Power BI. All the data pre-processing is going to be done in this window. It cleans and import millions of rows into the data model to help you perform data analysis after.
The tool is simple to use and requires no code to do any task. With the help of Power Query, it is possible to Extract, Transform, and Load the data. The tool offers the following benefits and simplify the tasks you perform regularly:
- In order to access and transform data regularly, you enter a repeatable query that just needs to be refreshed in the future to get up to data.
- Power Query provides connectivity to hundreds of data sources and over 350 different types of data transformations
- Equipped with a number of pre-built transformation functions as simple as adding or deleting rows
Build visuals with your data
You can check out a number of Power BI visualizations that you can choose from the visualization pane. Simply choose from the range of visuals available in the panel.
You can create custom data visualizations if you can’t find the visual you want in AppSource. To differentiate your organization and build something distinctive, personalize data visualizations. When they’re ready, you can share what you’ve created with your team or publish it to its community.
Working with the eye-catching visuals increase comprehension, retention, and appeal that help you interact with your data and make informed decisions quickly.
Watch this video to learn each step of developing visuals for your specific industry and business:
Number of visualizations options offered by Power BI
It is a data visualization and analysis tool that offers different types of visualizations. The most popular and useful ones are Charts, Maps, Tables, and Data Bars.
Charts are a simple way to present data in an easy-to-understand format. They can be used for showing trends, comparisons or changes over time. A map is a great way to show the geographical location of certain events or how they relate to each other on a map. A table provides detailed information that can be sorted by columns and rows so it’s easier to analyze the information in the table. Data bars are used to show progress towards goals or targets with their height representing the amount of progress made.
Career opportunities with Power BI
Power BI:
Analyst
Software Engineer
Senior Business Intelligence Analyst
Business Analyst
Data Analyst
Developer
Senior Software Engineer
Recently, the use of this tool has increased and has been adopted widely in multiple industries. It includes IT, healthcare, financial services, insurance, staffing & recruiting, and computer software. Some of the major companies that use the tool include:
Adobe (USA)
Conde Nast (USA)
Dell (USA)
Hospital Montfort (Canada)
Kraft Heinz Co (USA)
Meijer (USA)
Nestle (China)
Rolls-Royce Holdings PLC (UK)
The average annual salary of a Power BI professional in Unites States is $100,726 /yr.
Begin learning Power BI now!
The advantage of this visualization tool is its ease of use, even by people who don’t consider themselves to be very technologically proficient. As long as you have access to the data sources, the dashboard, and a working network connection, you can use it to process the information, create the necessary reports, and send them off to the right teams or individuals.
Start learning Power BI today with Data Science Dojo and excel your career