Interested in a hands-on learning experience for developing LLM applications?
Join our LLM Bootcamp today and Get 5% Off for a Limited Time!

data visualization

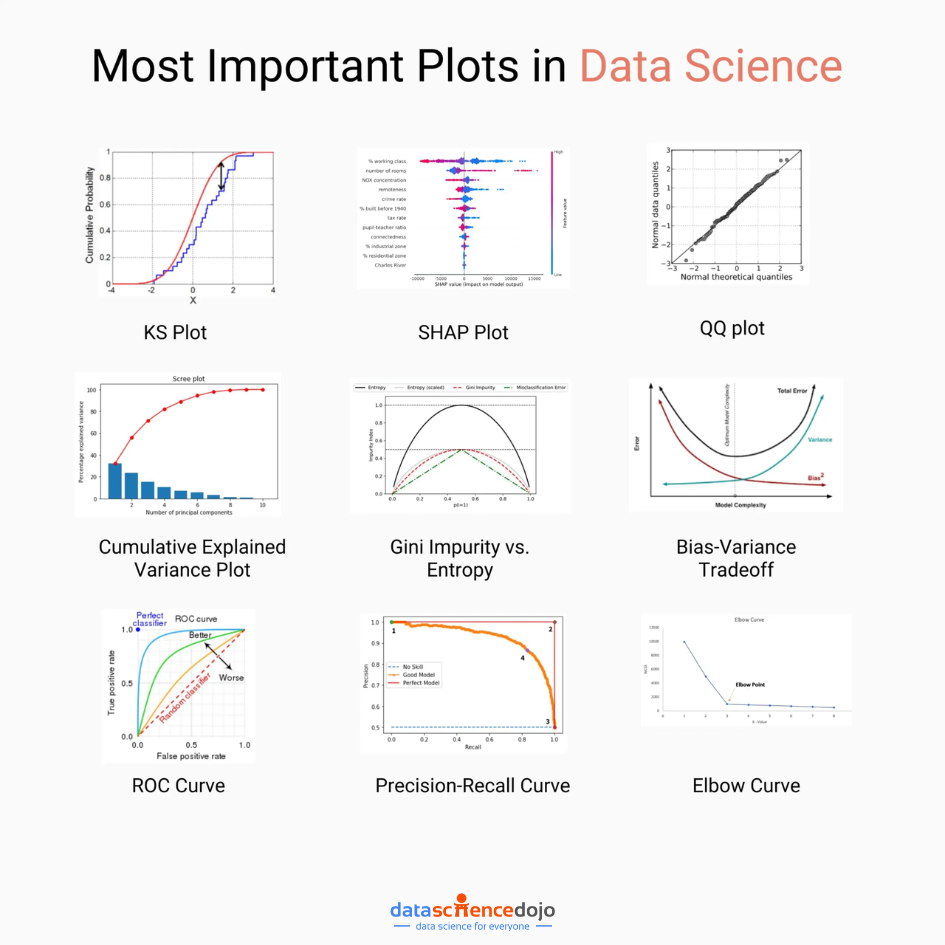
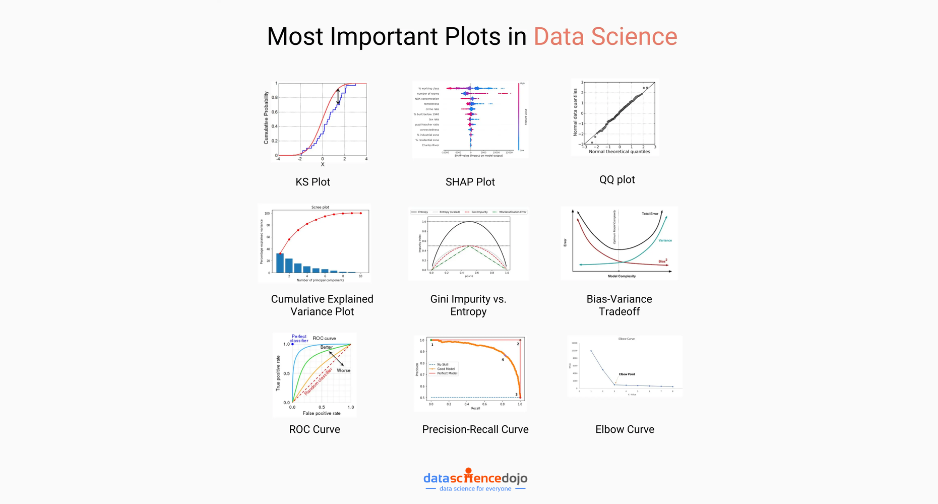
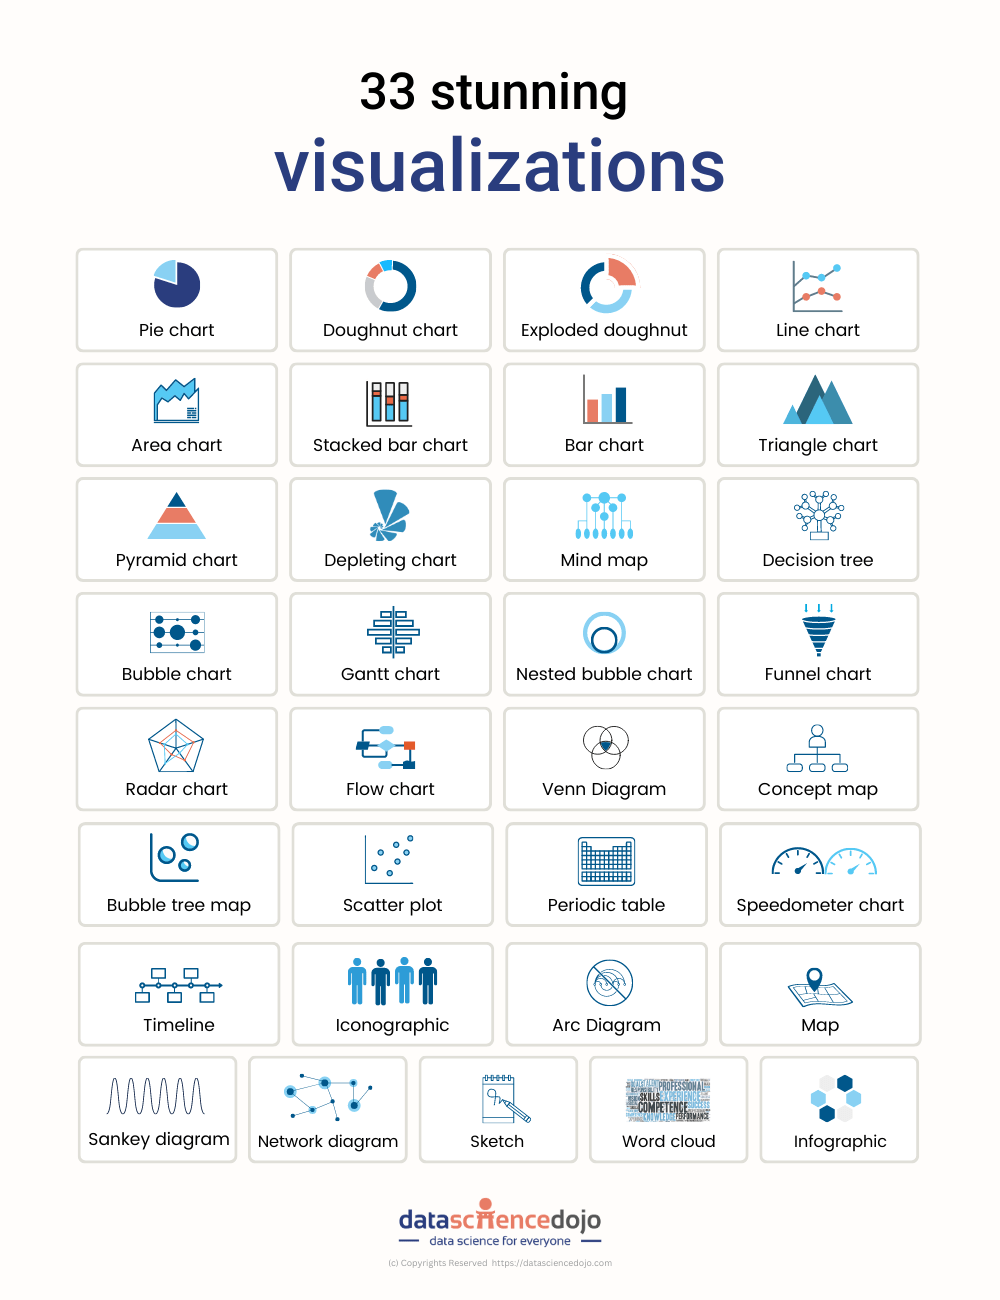
Plots in data science play a pivotal role in unraveling complex insights from data. They serve as a bridge between raw numbers and actionable insights, aiding in the understanding and interpretation of datasets. Learn about 33 tools to visualize data with this blog 

In this blog post, we will delve into some of the most important plots and concepts that are indispensable for any data scientist. 

data science plots
9 Data Science Plots – Data Science Dojo


1. KS Plot (Kolmogorov-Smirnov Plot):

The KS Plot is a powerful tool for comparing two probability distributions. It measures the maximum vertical distance between the cumulative distribution functions (CDFs) of two datasets. This plot is particularly useful for tasks like hypothesis testing, anomaly detection, and model evaluation.

Suppose you are a data scientist working for an e-commerce company. You want to compare the distribution of purchase amounts for two different marketing campaigns. By using a KS Plot, you can visually assess if there’s a significant difference in the distributions. This insight can guide future marketing strategies.

2. SHAP Plot:

SHAP plots offer an in-depth understanding of the importance of features in a predictive model. They provide a comprehensive view of how each feature contributes to the model’s output for a specific prediction. SHAP values help answer questions like, “Which features influence the prediction the most?”

Imagine you’re working on a loan approval model for a bank. You use a SHAP plot to explain to stakeholders why a certain applicant’s loan was approved or denied. The plot highlights the contribution of each feature (e.g., credit score, income) in the decision, providing transparency and aiding in compliance.

3. QQ plot:

The QQ plot is a visual tool for comparing two probability distributions. It plots the quantiles of the two distributions against each other, helping to assess whether they follow the same distribution. This is especially valuable in identifying deviations from normality.

In a medical study, you want to check if a new drug’s effect on blood pressure follows a normal distribution. Using a QQ Plot, you compare the observed distribution of blood pressure readings post-treatment with an expected normal distribution. This helps in assessing the drug’s effectiveness. 

Large language model bootcamp


4. Cumulative explained variance plot:

In the context of Principal Component Analysis (PCA), this plot showcases the cumulative proportion of variance explained by each principal component. It aids in understanding how many principal components are required to retain a certain percentage of the total variance in the dataset.

Let’s say you’re working on a face recognition system using PCA. The cumulative explained variance plot helps you decide how many principal components to retain to achieve a desired level of image reconstruction accuracy while minimizing computational resources. 

Explore, analyze, and visualize data using Power BI Desktop to make data-driven business decisions. Check out our Introduction to Power BI cohort. 

5. Gini Impurity vs. Entropy:

These plots are critical in the field of decision trees and ensemble learning. They depict the impurity measures at different decision points. Gini impurity is faster to compute, while entropy provides a more balanced split. The choice between the two depends on the specific use case.

Suppose you’re building a decision tree to classify customer feedback as positive or negative. By comparing Gini impurity and entropy at different decision nodes, you can decide which impurity measure leads to a more effective splitting strategy for creating meaningful leaf nodes.

6. Bias-Variance tradeoff:

Understanding the tradeoff between bias and variance is fundamental in machine learning. This concept is often visualized as a curve, showing how the total error of a model is influenced by its bias and variance. Striking the right balance is crucial for building models that generalize well.

Imagine you’re training a model to predict housing prices. If you choose a complex model (e.g., deep neural network) with many parameters, it might overfit the training data (high variance). On the other hand, if you choose a simple model (e.g., linear regression), it might underfit (high bias). Understanding this tradeoff helps in model selection. 

7. ROC curve:

The ROC curve is a staple in binary classification tasks. It illustrates the tradeoff between the true positive rate (sensitivity) and false positive rate (1 – specificity) for different threshold values. The area under the ROC curve (AUC-ROC) quantifies the model’s performance.

In a medical context, you’re developing a model to detect a rare disease. The ROC curve helps you choose an appropriate threshold for classifying individuals as positive or negative for the disease. This decision is crucial as false positives and false negatives can have significant consequences. 

Want to get started with data science? Check out our instructor-led live Data Science Bootcamp 

8. Precision-Recall curve:

Especially useful when dealing with imbalanced datasets, the precision-recall curve showcases the tradeoff between precision and recall for different threshold values. It provides insights into a model’s performance, particularly in scenarios where false positives are costly.

Let’s say you’re working on a fraud detection system for a bank. In this scenario, correctly identifying fraudulent transactions (high recall) is more critical than minimizing false alarms (low precision). A precision-recall curve helps you find the right balance.

9. Elbow curve:

In unsupervised learning, particularly clustering, the elbow curve aids in determining the optimal number of clusters for a dataset. It plots the variance explained as a function of the number of clusters. The “elbow point” is a good indicator of the ideal cluster count.

You’re tasked with clustering customer data for a marketing campaign. By using an elbow curve, you can determine the optimal number of customer segments. This insight informs personalized marketing strategies and improves customer engagement. 


Improvise your models today with plots in data science! 

These plots in data science are the backbone of your data. Incorporating them into your analytical toolkit will empower you to extract meaningful insights, build robust models, and make informed decisions from your data. Remember, visualizations are not just pretty pictures; they are powerful tools for understanding the underlying stories within your data. 


Check out this crash course in data visualization, it will help you gain great insights so that you become a data visualization pro: 


September 26, 2023

Heatmaps are a type of data visualization that uses color to represent data values. For the unversed,
data visualization is the process of representing data in a visual format. This can be done through charts, graphs, maps, and other visual representations.

What are heatmaps?

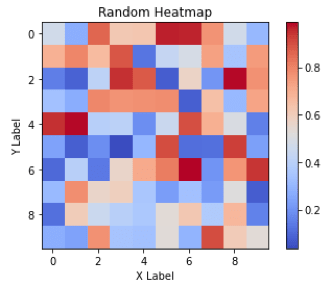
A heatmap is a graphical representation of data in which values are represented as colors on a two-dimensional plane. Typically, heatmaps are used to visualize data in a way that makes it easy to identify patterns and trends.  

Heatmaps are often used in fields such as data analysis, biology, and finance. In data analysis, heatmaps are used to visualize patterns in large datasets, such as website traffic or user behavior.

In biology, heatmaps are used to visualize gene expression data or protein-protein interaction networks. In finance, heatmaps are used to visualize stock market trends and performance. This diagram shows a random 10×10 heatmap using `NumPy` and `Matplotlib`.  

Heatmaps
Heatmaps

Advantages of heatmaps

  1. Visual representation: Heatmaps provide an easily understandable visual representation of data, enabling quick interpretation of patterns and trends through color-coded values.
  2. Large data visualization: They excel at visualizing large datasets, simplifying complex information and facilitating analysis.
  3. Comparative analysis: They allow for easy comparison of different data sets, highlighting differences and similarities between, for example, website traffic across pages or time periods.
  4. Customizability: They can be tailored to emphasize specific values or ranges, enabling focused examination of critical information.
  5. User-friendly: They are intuitive and accessible, making them valuable across various fields, from scientific research to business analytics.
  6. Interactivity: Interactive features like zooming, hover-over details, and data filtering enhance the usability of heatmaps.
  7. Effective communication: They offer a concise and clear means of presenting complex information, enabling effective communication of insights to stakeholders.

Creating heatmaps using “Matplotlib” 

We can create heatmaps using Matplotlib by following the aforementioned steps: 

  • To begin, we import the necessary libraries, namely Matplotlib and NumPy.
  • Following that, we define our data as a 3×3 NumPy array.
  • Afterward, we utilize Matplotlib’s imshow function to create a heatmap, specifying the color map as ‘coolwarm’.
  • To enhance the visualization, we incorporate a color bar by employing Matplotlib’s colorbar function.
  • Subsequently, we set the title and axis labels using Matplotlib’s set_title, set_xlabel, and set_ylabel functions.
  • Lastly, we display the plot using the show function.

Bottom line: This will create a simple 3×3 heatmap with a color bar, title, and axis labels. 

Customizations available in Matplotlib for heatmaps 

Following is a list of the customizations available for Heatmaps in Matplotlib: 

  1. Changing the color map 
  2. Changing the axis labels 
  3. Changing the title 
  4. Adding a color bar 
  5. Adjusting the size and aspect ratio 
  6. Setting the minimum and maximum values
  7. Adding annotations 
  8. Adjusting the cell size
  9. Masking certain cells 
  10. Adding borders 

These are just a few examples of the many customizations that can be done in heatmaps using Matplotlib. Now, let’s see all the customizations being implemented in a single example code snippet: 

In this example, the heatmap is customized in the following ways: 

  1. Set the colormap to ‘coolwarm’
  2. Set the minimum and maximum values of the colormap using `vmin` and `vmax`
  3. Set the size of the figure using `figsize`
  4. Set the extent of the heatmap using `extent`
  5. Set the linewidth of the heatmap using `linewidth`
  6. Add a colorbar to the figure using the `colorbar`
  7. Set the title, xlabel, and ylabel using `set_title`, `set_xlabel`, and `set_ylabel`, respectively
  8. Add annotations to the heatmap using `text`
  9. Mask certain cells in the heatmap by setting their values to `np.nan`
  10. Show the frame around the heatmap using `set_frame_on(True)`

Creating heatmaps using “Seaborn” 

We can create heatmaps using Seaborn by following the aforementioned steps: 

  • First, we import the necessary libraries: seaborn, matplotlib, and numpy.
  • Next, we generate a random 10×10 matrix of numbers using NumPy’s rand function and store it in the variable data.
  • We create a heatmap by using Seaborn’s heatmap function. It takes the data as input and specifies the color map using the cmap parameter. Additionally, we set the annot parameter to True to display the values in each cell of the heatmap.
  • To enhance the plot, we add a title, x-label, and y-label using Matplotlib’s title, xlabel, and ylabel functions.
  • Finally, we display the plot using the show function from Matplotlib.

Overall, the code generates a random heatmap using Seaborn with a color map, annotations, and labels using Matplotlib. 

Customizations available in Seaborn for heatmaps:

Following is a list of the customizations available for Heatmaps in Seaborn: 

  1. Change the color map 
  2. Add annotations to the heatmap cells
  3. Adjust the size of the heatmap 
  4. Display the actual numerical values of the data in each cell of the heatmap
  5. Add a color bar to the side of the heatmap
  6. Change the font size of the heatmap 
  7. Adjust the spacing between cells 
  8. Customize the x-axis and y-axis labels
  9. Rotate the x-axis and y-axis tick labels

Now, let’s see all the customizations being implemented in a single example code snippet:

In this example, the heatmap is customized in the following ways: 

  1. Set the color palette to “Blues”.
  2. Add annotations with a font size of 10.
  3. Set the x and y labels and adjust font size.
  4. Set the title of the heatmap.
  5. Adjust the figure size.
  6. Show the heatmap plot.

Limitations of heatmaps:

Heatmaps are a useful visualization tool for exploring and analyzing data, but they do have some limitations that you should be aware of: 

  • Limited to two-dimensional data: They are designed to visualize two-dimensional data, which means that they are not suitable for visualizing higher-dimensional data.
  • Limited to continuous data: They are best suited for continuous data, such as numerical values, as they rely on a color scale to convey the information. Categorical or binary data may not be as effectively visualized using heatmaps.
  • May be affected by color blindness: Some people are color blind, which means that they may have difficulty distinguishing between certain colors. This can make it difficult for them to interpret the information in a heatmap.


  • Can be sensitive to scaling: The color mapping in a heatmap is sensitive to the scale of the data being visualized. Therefore, it is important to carefully choose the color scale and to consider normalizing or standardizing the data to ensure that the heatmap accurately represents the underlying data.
  • Can be misleading: They can be visually appealing and highlight patterns in the data, but they can also be misleading if not carefully designed. For example, choosing a poor color scale or omitting important data points can distort the visual representation of the data.

It is important to consider these limitations when deciding whether or not to use a heatmap for visualizing your data. 

Conclusion

Heatmaps are powerful tools for visualizing data patterns and trends. They find applications in various fields, enabling easy interpretation and analysis of large datasets. Matplotlib and Seaborn offer flexible options to create and customize heatmaps. However, it’s essential to understand their limitations, such as two-dimensional data representation and sensitivity to color perception. By considering these factors, heatmaps can be a valuable asset in gaining insights and communicating information effectively.


Written by Safia Faiz

June 12, 2023

Unlock the full potential of your data with the power of data visualization! Go through this blog and discover why visualizations are crucial in Data Science and explore the most effective and game-changing types of visualizations that will revolutionize the way you interpret and extract insights from your data. Get ready to take your data analysis skills to the next level! 

What is data visualization?

Data visualization involves using different charts, graphs, and other visual elements to represent data and information graphically and the purpose of it is to make complex and hard to understand and complex datasets easily understandable, accessible, and interpretable.

This powerful tool enables businesses to explore, analyze and identify trends, patterns and relationships from the raw data that are usually hidden by just looking at the data itself or its statistics. 

Data visualization guide

By mastering the ability of data visualization, businesses and organizations can make effective and important decisions and actions based on the data and the insights gained. These decisions are additionally referred to as ‘Data-Driven Decisions’. By presenting data in a visual format, analysts can effectively communicate their findings to their team and to their clients, which is a challenging task as clients sometimes can’t interpret raw data and need a medium that they can interpret easily. 

Importance of data visualization

Here is a list of some benefits data visualization offers that make us understand its importance and its usefulness: 

1. Simplifying complex data: It enables complex data to be presented in a simplified and understandable manner. By using visual representations such as graphs and charts, data can be made more accessible to individuals who are not familiar with the underlying data. 

2. Enhancing insights: It can help to identify patterns and trends that might not be immediately apparent from raw data. By presenting data visually, it is easier to identify correlations and relationships between variables, enabling analysts to draw insights and make more informed decisions. 

3. Enhanced communication: It makes it easier to communicate complex data to a wider audience, including non-technical stakeholders in a way that is easy to understand and engage with. Visualizations can be used to tell a story, convey complex information, and facilitate collaboration among stakeholders, team members, and decision makers. 

4. Increasing efficiency: It can save time and increase efficiency by enabling analysts to quickly identify patterns and relationships in raw data. This can help to streamline the analysis process and enable analysts to focus their efforts on areas that are most likely to yield insights. 

5. Identifying anomalies and errors: It can help to identify errors or anomalies in the data. By presenting data visually, it is easier to spot outliers or unusual patterns that might indicate errors in data collection or processing. This can help analysts to clean and refine the data, ensuring that the insights derived from the data are accurate and reliable. 

6. Faster and more effective decision-making: It can help you make more informed and data-driven decisions by presenting information in a way that is easy to digest and interpret. Visualizations can help you identify key trends, outliers, and insights that can inform your decision-making, leading to faster and more effective outcomes. 

7. Improved data exploration and analysis: It enables you to explore and analyze your data in a more intuitive and interactive way. By visualizing data in different formats and at different levels of detail, you can gain new insights and identify areas for further exploration and analysis. 

Choosing the right type of visualization 

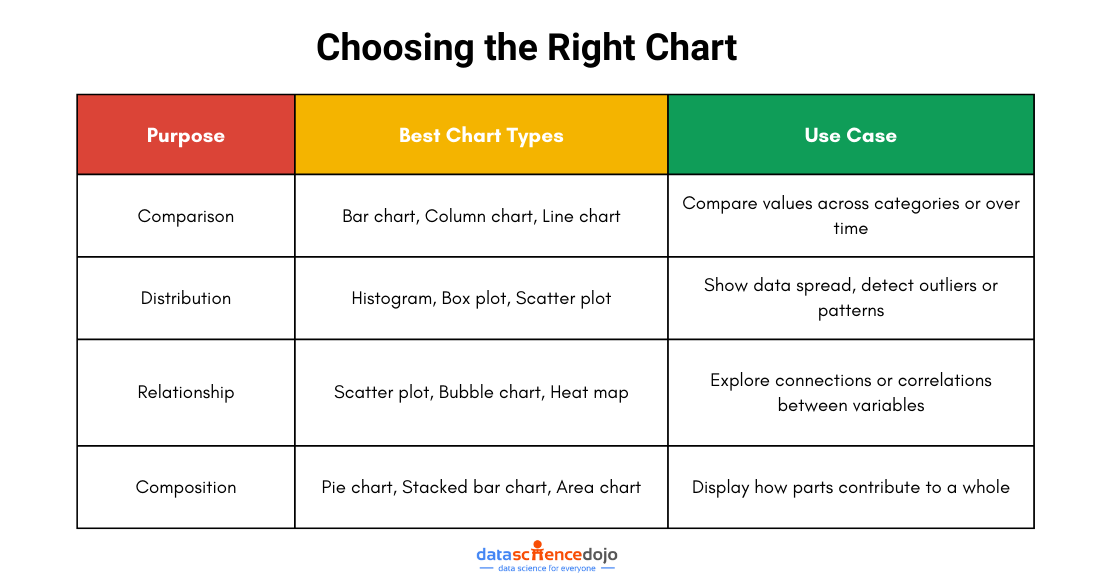
This is the only challenge faced when working with data visualizations, and to master this skill completely, you must have a clear idea about choosing the right type of visual for creating amazing, clear, attractive, and pleasing visuals. Keeping the following points in mind will help you in this: 

Identify purpose  

Before starting to create your visualization, it’s important to identify what your purpose is. Your purpose may include comparing different values and examining distributions, relationships, or compositions of variables. This step is important as each purpose has a different type of visualization that suits it best.
Understanding audience  

You can get help in choosing the best type of visualization for your message if you know about your audience, their preferences, and in which context they will view your visualization. This is useful as different visualizations are more effective with different audiences. 

Types of data visualization

Selecting the appropriate visual

Once you have identified your purpose and your audience, the final step is choosing the appropriate visualization to convey your message, some common visuals include: 

  1. Comparison Charts: compare different groups/categories. 
  2. Distribution Charts: show distributions of a variable. 
  3. Relationship Charts: show the relationship between two or more variables. 
  4. Composition Charts: show how a whole part is divided into its parts.

Ethics of data visualization & avoiding misleading representations 

In many cases, data visualization may also be used to misinterpret information intentionally or unintentionally. An example includes manipulating data by using specific scales or omitting specific data points to support a particular narrative and not showing the actual view of the data. Some considerations regarding the ethics of data visualization include: 

  1. Accuracy of data: Data should be accurate and should not be presented in a way to misinterpret information. 
  2. Appropriateness of visualization type: The type of visual selected should be appropriate for the data being presented and the message being conveyed. 
  3. Clarity of message: The message conveyed through visualization should be clear and easy to understand. 
  4. Avoiding bias and discrimination: Each data visualization should be clear of bias and discrimination. 

Avoiding misleading representations 

You want to represent your data in the most efficient way possible which can be easily interpreted and free of ambiguities, now that’s not always the case, there are times when your data can mislead your visualization and convey the wrong message. In those cases, you can take help from the following points to avoid misleadingness: 

  • Use consistent scales and axes in your charts and graphs. 
  • Avoid using truncated axes and skewed data ranges which cause data to appear less significant. 
  • Label your data points and axes properly for clarity. 
  • Avoid cherry-picking the data to support a particular narrative. 
  • Provide clear and concise context for the data you are presenting. 

Types of data visualizations

There are numerous visualizations available, each with its own use and importance, and the choice of a visual depends on your need i.e., what kind of data you want to analyze, and what type of insight are you looking for. Nonetheless, here are some most common visuals used in data science:

  • Bar Charts: Bar charts are normally used to compare categorical data, such as the frequency or proportion of different categories. They are used to visualize data that can be organized or split into different discrete groups or categories.
  • Line Graphs: Line graphs are a type of visualization that uses lines to represent data values. They are typically used to represent continuous data.
  • Scatter Plots: Scatter plot is a type of data visualization that displays the relationship between two quantitative (numerical) variables.  They are used to explore and analyze the correlation or association between two continuous variables.
  • Histograms: A histogram graph represents the distribution of a continuous numerical variable by dividing it into intervals and counting the number of observations. They are used to visualize the shape and spread of data.


  • Heatmaps: Heatmaps are commonly used to show the relationships between two variables, such as the correlation between different features in a dataset. 
  • Box and Whisker Plots:  They are also known as boxplots and are used to display the distribution of a dataset. A box plot consists of a box that spans the first quartile (Q1) to the third quartile (Q3) of the data, with a line inside the box representing the median.
  • Count Plots: A count plot is a type of bar chart that displays the number of occurrences of a categorical variable. The x-axis represents the categories, and the y-axis represents the count or frequency of each category.
  • Point Plots: A point plot is a type of line graph that displays the mean (or median) of a continuous variable for each level of a categorical variable. They are useful for comparing the values of a continuous variable across different levels.
  • Choropleth Maps: Choropleth map is a type of geographical visualization that uses color to represent data values for different geographic regions, such as countries, states, or counties.
  • Tree Maps: This visualization is used to display hierarchical data as nested rectangles, with each rectangle representing a node in the hierarchy. Treemaps are useful for visualizing complex hierarchical data in a way that highlights the relative sizes and values of different nodes. 


Conclusion

So, this blog was all about introducing you to this powerful tool in the world of data science. Now you have a clear idea about what data visualization is, and what is its importance for analysts, businesses, and stakeholders.

You also learned about how you can choose the right type of visual, the ethics of data visualization and got familiar with 10 new different data visualizations and how they look like. The next step for you is to learn about how you can create these visuals using Python libraries such as matplotlib, seaborn and plotly. 

May 29, 2023

Researchers, statisticians, and data analysts rely on histograms to gain insights into data distributions, identify patterns, and detect outliers. Data scientists and machine learning practitioners use histograms as part of exploratory data analysis and feature engineering. Overall, anyone working with numerical data and seeking to gain a deeper understanding of data distributions can benefit from information on histograms.

Defining histograms

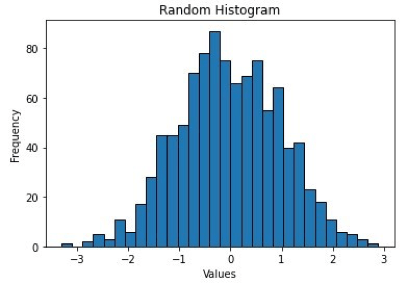
A histogram is a type of graphical representation of data that shows the distribution of numerical values. It consists of a set of vertical bars, where each bar represents a range of values, and the height of the bar indicates the frequency or count of data points falling within that range.   

Histograms
Histograms

Histograms are commonly used in statistics and data analysis to visualize the shape of a data set and to identify patterns, such as the presence of outliers or skewness. They are also useful for comparing the distribution of different data sets or for identifying trends over time. 

The picture above shows how 1000 random data points from a normal distribution with a mean of 0 and standard deviation of 1 are plotted in a histogram with 30 bins and black edges.  

Advantages of histograms

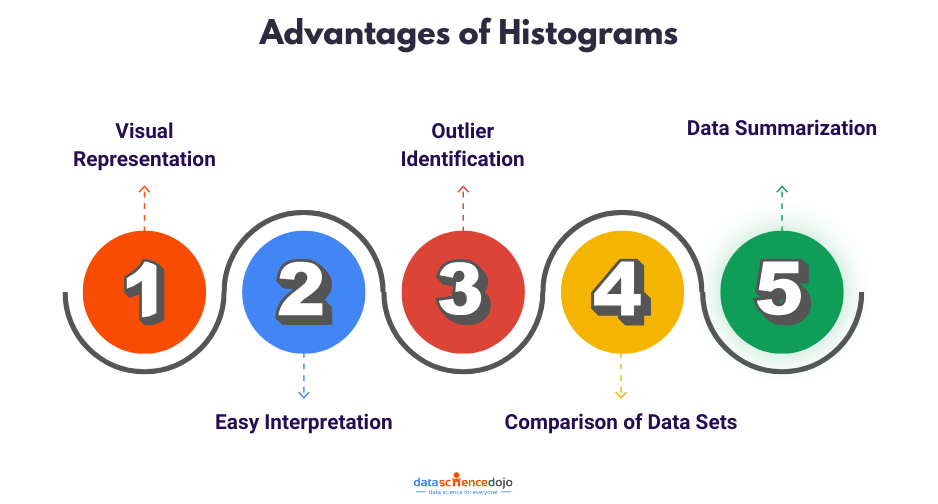
  • Visual Representation: Histograms provide a visual representation of the distribution of data, enabling us to observe patterns, trends, and anomalies that may not be apparent in raw data.
  • Easy Interpretation: Histograms are easy to interpret, even for non-experts, as they utilize a simple bar chart format that displays the frequency or proportion of data points in each bin.
  • Outlier Identification: Histograms are useful for identifying outliers or extreme values, as they appear as individual bars that significantly deviate from the rest of the bars.
  • Comparison of Data Sets: Histograms facilitate the comparison of distribution between different data sets, enabling us to identify similarities or differences in their patterns.
  • Data Summarization: Histograms are effective for summarizing large amounts of data by condensing the information into a few key features, such as the shape, center, and spread of the distribution.

Creating a histogram using Matplotlib library

We can create histograms using Matplotlib by following a series of steps. Following the import statements of the libraries, the code generates a set of 1000 random data points from a normal distribution with a mean of 0 and standard deviation of 1, using the `numpy.random.normal()` function. 

  1. The plt.hist() function in Python is a powerful tool for creating histograms. By providing the data, number of bins, bar color, and edge color as input, this function generates a histogram plot.
  2. To enhance the visualization, the xlabel(), ylabel(), and title() functions are utilized to add labels to the x and y axes, as well as a title to the plot.
  3. Finally, the show() function is employed to display the histogram on the screen, allowing for detailed analysis and interpretation.

Overall, this code generates a histogram plot of a set of random data points from a normal distribution, with 30 bins, blue bars, black edges, labeled axes, and a title. The histogram shows the frequency distribution of the data, with a bell-shaped curve indicating the normal distribution.  

Customizations available in Matplotlib for histograms  

In Matplotlib, there are several customizations available for histograms. These include:

  1. Adjusting the number of bins.
  2. Changing the color of the bars.
  3. Changing the opacity of the bars.
  4. Changing the edge color of the bars.
  5. Adding a grid to the plot.
  6. Adding labels and a title to the plot.
  7. Adding a cumulative density function (CDF) line.
  8. Changing the range of the x-axis.
  9. Adding a rug plot.

Now, let’s see all the customizations being implemented in a single example code snippet: 

In this example, the histogram is customized in the following ways: 

  • The number of bins is set to `20` using the `bins` parameter.
  • The transparency of the bars is set to `0.5` using the `alpha` parameter.
  • The edge color of the bars is set to `black` using the `edgecolor` parameter.
  • The color of the bars is set to `green` using the `color` parameter.
  • The range of the x-axis is set to `(-3, 3)` using the `range` parameter.
  • The y-axis is normalized to show density using the `density` parameter.
  • Labels and a title are added to the plot using the `xlabel()`, `ylabel()`, and `title()` functions.
  • A grid is added to the plot using the `grid` function.
  • A cumulative density function (CDF) line is added to the plot using the `cumulative` parameter and `histtype=’step’`.
  • A rug plot showing individual data points is added to the plot using the `plot` function.

Creating a histogram using ‘Seaborn’ library: 

We can create histograms using Seaborn by following the steps: 

  • First and foremost, importing the libraries: `NumPy`, `Seaborn`, `Matplotlib`, and `Pandas`. After importing the libraries, a toy dataset is created using `pd.DataFrame()` of 1000 samples that are drawn from a normal distribution with mean 0 and standard deviation 1 using NumPy’s `random.normal()` function. 
  • We use Seaborn’s `histplot()` function to plot a histogram of the ‘data’ column of the DataFrame with `20` bins and a `blue` color. 
  • The plot is customized by adding labels, and a title, and changing the style to a white grid using the `set_style()` function. 
  • Finally, we display the plot using the `show()` function from matplotlib. 


Overall, this code snippet demonstrates how to use Seaborn to plot a histogram of a dataset and customize the appearance of the plot quickly and easily. 

Customizations available in Seaborn for histograms

Following is a list of the customizations available for Histograms in Seaborn: 

  1. Change the number of bins.
  2. Change the color of the bars.
  3. Change the color of the edges of the bars.
  4. Overlay a density plot on the histogram.
  5. Change the bandwidth of the density plot.
  6. Change the type of histogram to cumulative.
  7. Change the orientation of the histogram to horizontal.
  8. Change the scale of the y-axis to logarithmic.

Now, let’s see all these customizations being implemented here as well, in a single example code snippet: 

In this example, we have done the following customizations:

  1. Set the number of bins to `20`.
  2. Set the color of the bars to `green`.
  3. Set the `edgecolor` of the bars to `black`.
  4. Added a density plot overlaid on top of the histogram using the `kde` parameter set to `True`.
  5. Set the bandwidth of the density plot to `0.5` using the `kde_kws` parameter.
  6. Set the histogram to be cumulative using the `cumulative` parameter.
  7. Set the y-axis scale to logarithmic using the `log_scale` parameter.
  8. Set the title of the plot to ‘Customized Histogram’.
  9. Set the x-axis label to ‘Values’.
  10. Set the y-axis label to ‘Frequency’.

Limitations of Histograms: 

Histograms are widely used for visualizing the distribution of data, but they also have limitations that should be considered when interpreting them. These limitations are jotted down below: 

  1. They can be sensitive to the choice of bin size or the number of bins, which can affect the interpretation of the distribution. Choosing too few bins can result in a loss of information while choosing too many bins can create artificial patterns and noise.
  2. They can be influenced by outliers, which can skew the distribution or make it difficult to see patterns in the data.
  3. They are typically univariate and cannot capture relationships between multiple variables or dimensions of data.
  4. Histograms assume that the data is continuous and does not work well with categorical data or data with large gaps between values.
  5. They can be affected by the choice of starting and ending points, which can affect the interpretation of the distribution.
  6. They do not provide information on the shape of the distribution beyond the binning intervals.

 It’s important to consider these limitations when using histograms and to use them in conjunction with other visualization techniques to gain a more complete understanding of the data. 

 Wrapping up

In conclusion, histograms are powerful tools for visualizing the distribution of data. They provide valuable insights into the shape, patterns, and outliers present in a dataset. With their simplicity and effectiveness, histograms offer a convenient way to summarize and interpret large amounts of data.

By customizing various aspects such as the number of bins, colors, and labels, you can tailor the histogram to your specific needs and effectively communicate your findings. So, embrace the power of histograms and unlock a deeper understanding of your data.


Written by Safia Faiz

May 23, 2023

Data visualization is the art of presenting complex information in a way that is easy to understand and analyze. With the explosion of data in today’s business world, the ability to create compelling data visualizations has become a critical skill for anyone working with data.

Whether you’re a business analyst, data scientist, or marketer, the ability to communicate insights effectively is key to driving business decisions and achieving success. 

In this article, we’ll explore the art of data visualization and how it can be used to tell compelling stories with business analytics. We’ll cover the key principles of data visualization and provide tips and best practices for creating stunning visualizations. So, grab your favorite data visualization tool, and let’s get started! 

Data visualization in business analytics  
Data visualization in business analytics

Importance of data visualization in business analytics  

Data visualization is the process of presenting data in a graphical or pictorial format. It allows businesses to quickly and easily understand large amounts of complex information, identify patterns, and make data-driven decisions. Good data visualization can spot the difference between an insightful analysis and a meaningless spreadsheet. It enables stakeholders to see the big picture and identify key insights that may have been missed in a traditional report. 

Benefits of data visualization 

Data visualization has several advantages for business analytics, including 

1. Improved communication and understanding of data 

Visualizations make it easier to communicate complex data to stakeholders who may not have a background in data analysis. By presenting data in a visual format, it is easier to understand and interpret, allowing stakeholders to make informed decisions based on data-driven insights. 

2. More effective decision making 

Data visualization enables decision-makers to identify patterns, trends, and outliers in data sets, leading to more effective decision-making. By visualizing data, decision-makers can quickly identify correlations and relationships between variables, leading to better insights and more informed decisions. 

3. Enhanced ability to identify patterns and trends 

Visualizations enable businesses to identify patterns and trends in their data that may be difficult to detect using traditional data analysis methods. By identifying these patterns, businesses can gain valuable insights into customer behavior, product performance, and market trends. 

4. Increased engagement with data 

Visualizations make data more engaging and interactive, leading to increased interest and engagement with data. By making data more accessible and interactive, businesses can encourage stakeholders to explore data more deeply, leading to a deeper understanding of the insights and trends 

5. Principles of effective data visualization 

Effective data visualization is more than just putting data into a chart or graph. It requires careful consideration of the audience, the data, and the message you are trying to convey. Here are some principles to keep in mind when creating effective data visualizations: 

6. Know your audience

Understanding your audience is critical to creating effective data visualizations. Who will be viewing your visualization? What are their backgrounds and areas of expertise? What questions are they trying to answer? Knowing your audience will help you choose the right visualization format and design a visualization that is both informative and engaging. 

7. Keep it simple 

Simplicity is key when it comes to data visualization. Avoid cluttered or overly complex visualizations that can confuse or overwhelm your audience. Stick to key metrics or data points, and choose a visualization format that highlights the most important information. 

8. Use the right visualization format 

Choosing the right visualization format is crucial to effectively communicate your message. There are many different types of visualizations, from simple bar charts and line graphs to more complex heat maps and scatter plots. Choose a format that best suits the data you are trying to visualize and the story you are trying to tell. 

9. Emphasize key findings 

Make sure your visualization emphasizes the key findings or insights that you want to communicate. Use color, size, or other visual cues to draw attention to the most important information. 

10. Be consistent 

Consistency is important when creating data visualizations. Use a consistent color palette, font, and style throughout your visualization to make it more visually appealing and easier to understand. 

Tools and techniques for data visualization 

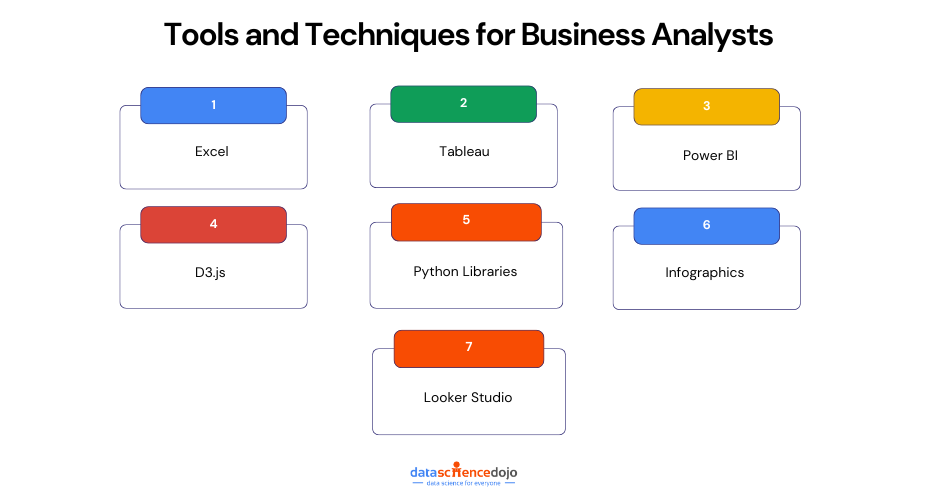
There are many tools and techniques available to create effective data visualizations. Some of them are:

1. Excel 

Microsoft Excel is one of the most commonly used tools for data visualization. It offers a wide range of chart types and customization options, making it easy to create basic visualizations.

2. Tableau 

Tableau is a powerful data visualization tool that allows users to connect to a wide range of data sources and create interactive dashboards and visualizations. Tableau is easy to use and provides a range of visualization options that are customizable to suit different needs. 

3. Power BI 

Microsoft Power BI is another popular data visualization tool that allows you to connect to various data sources and create interactive visualizations, reports, and dashboards. It offers a range of customizable visualization options and is easy to use for beginners.  

4. D3.js 

D3.js is a JavaScript library used for creating interactive and customizable data visualizations on the web. It offers a wide range of customization options and allows for complex visualizations. 

5. Python Libraries 

Python libraries such as Matplotlib, Seaborn, and Plotly can be used for data visualization. These libraries offer a range of customizable visualization options and are widely used in data science and analytics. 

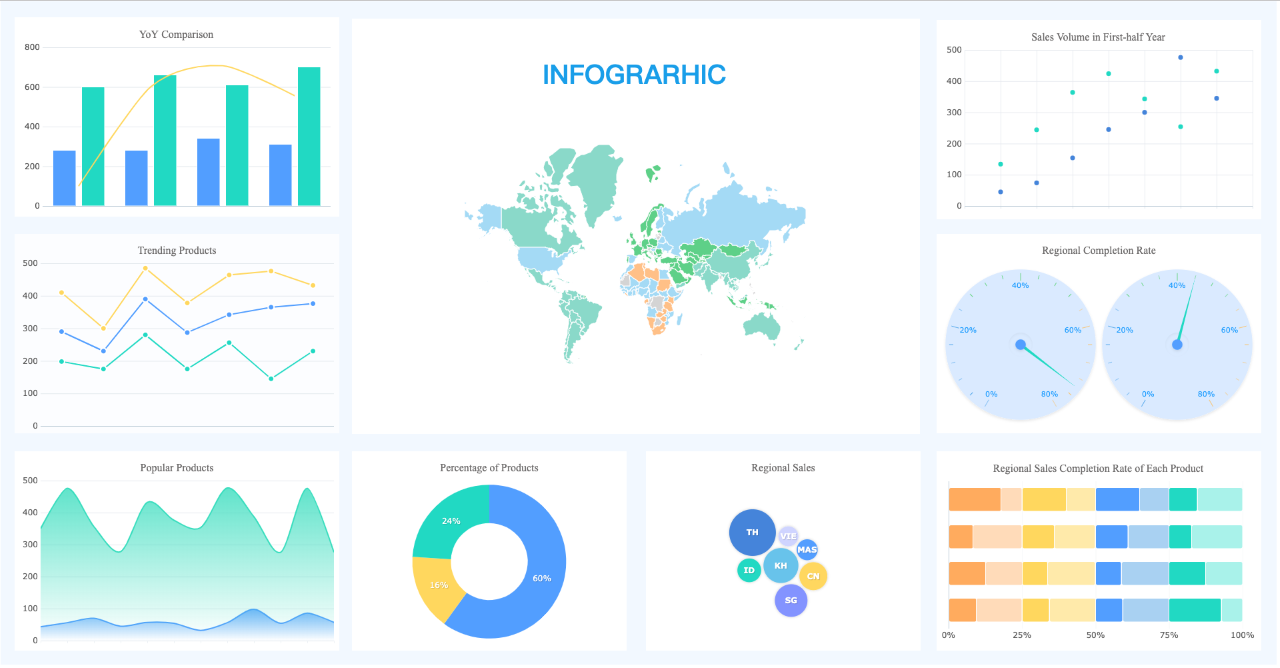
6. Infographics 

Infographics are a popular tool for visual storytelling and data visualization. They combine text, images, and data visualizations to communicate complex information in a visually appealing and easy-to-understand way. 

7. Looker Studio 

Looker Studio is a free data visualization tool that allows users to create interactive reports and dashboards using a range of data sources. Looker Studio is known for its ease of use and its integration with other Google products. 

Data Visualization in action: Examples from business analytics 

To illustrate the power of data visualization in business analytics, let’s take a look at a few examples: 

  1. Sales Performance Dashboard

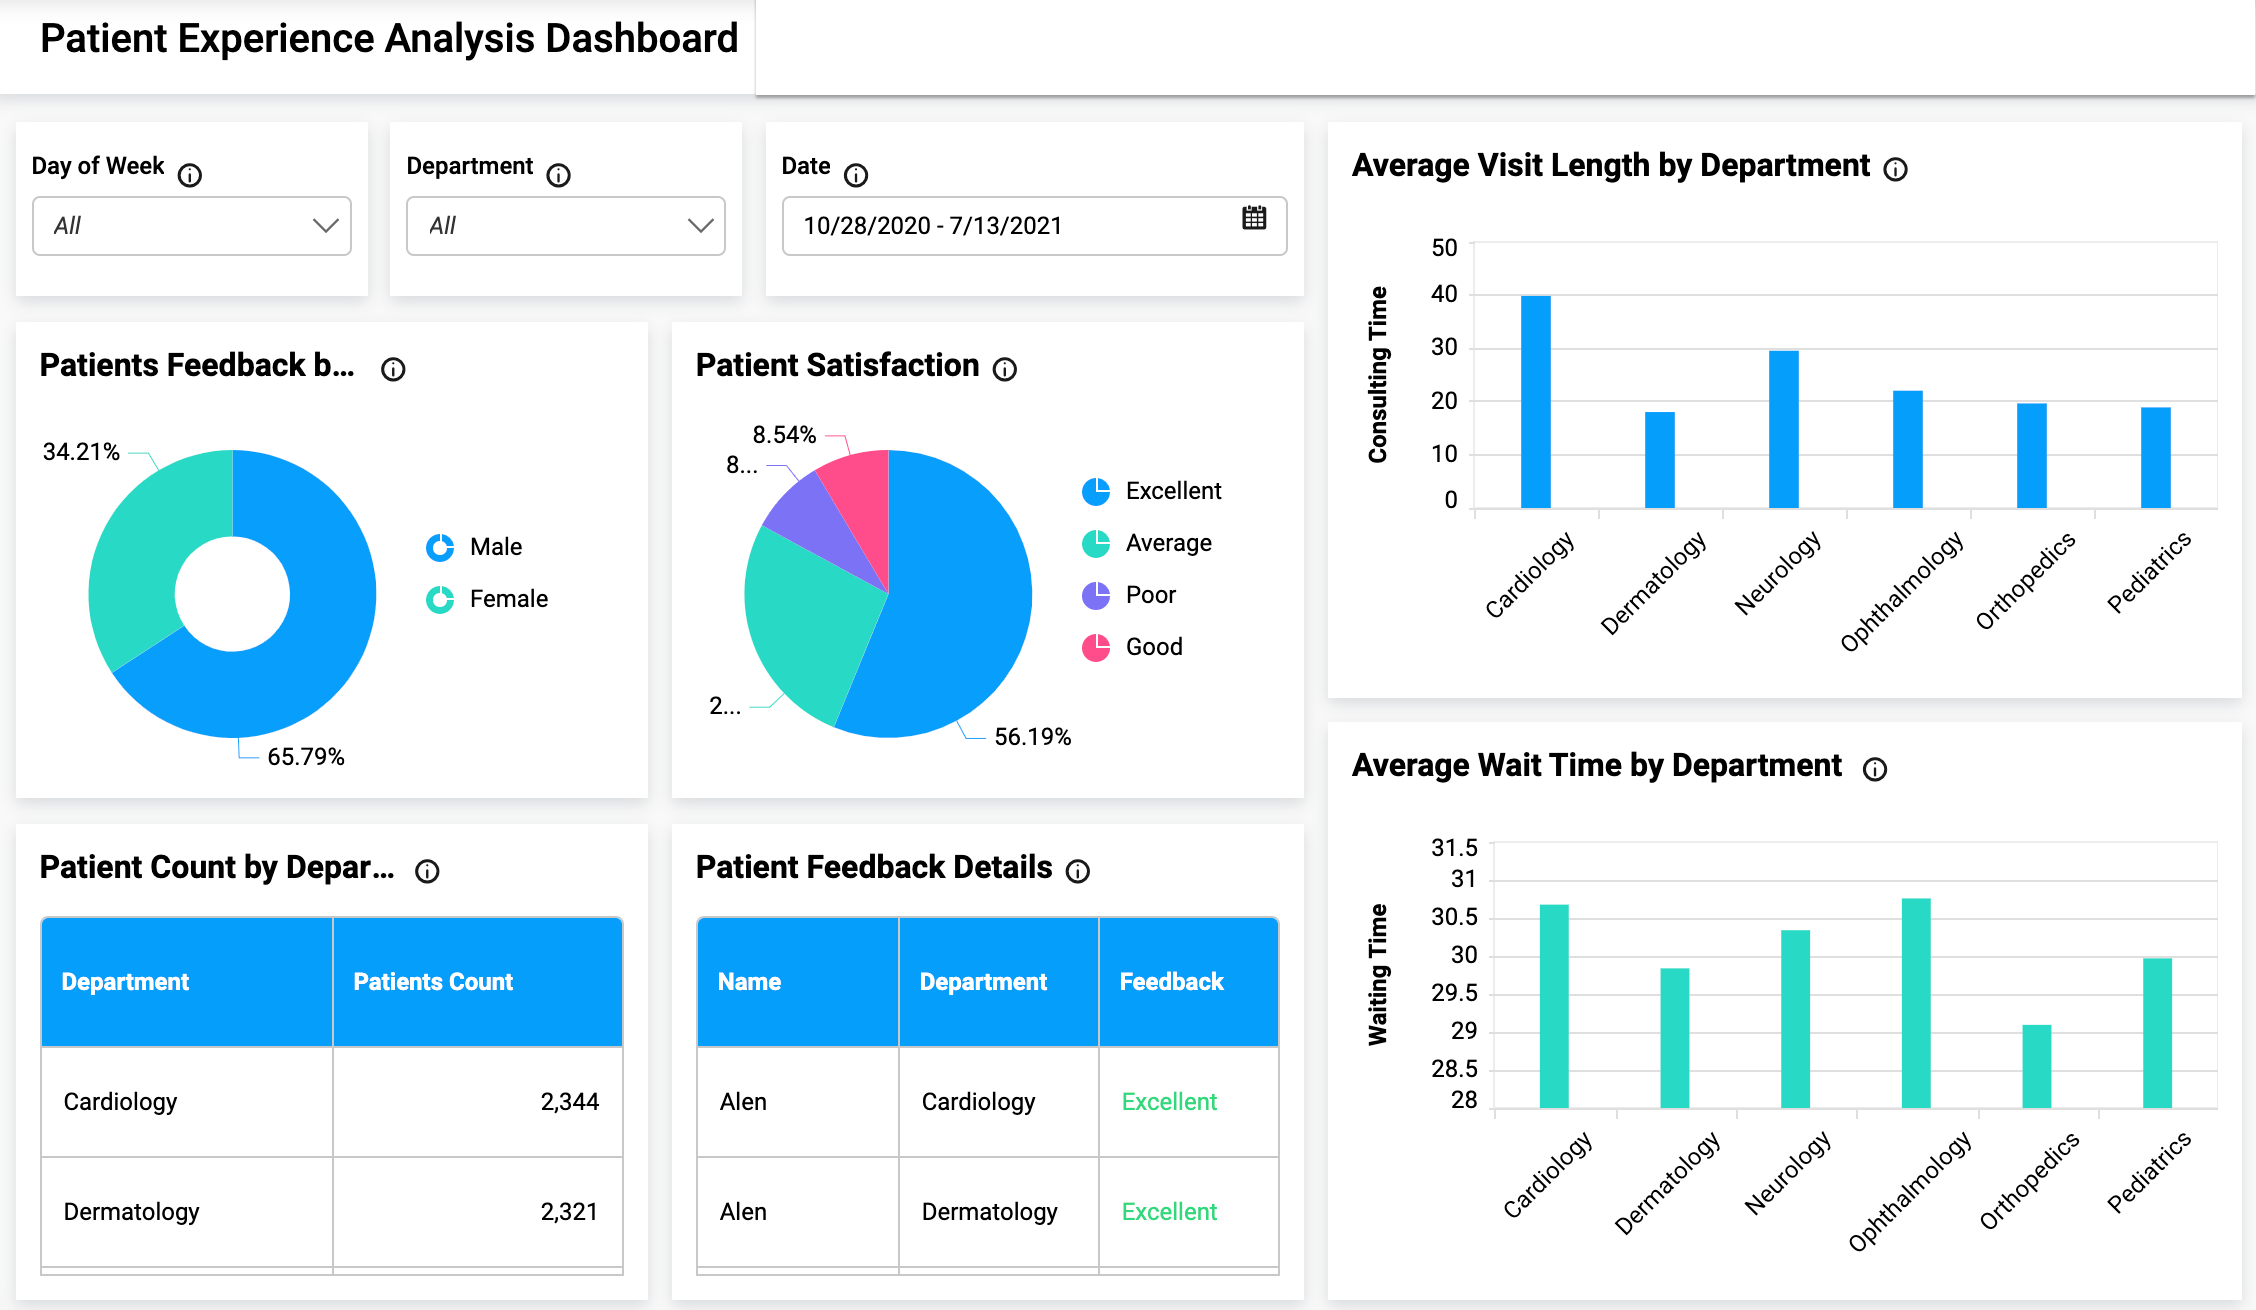
A sales performance dashboard is a visual representation of sales data that provides insight into sales trends, customer behavior, and product performance. The dashboard may include charts and graphs that show sales by region, product, and customer segment. By analyzing this data, businesses can identify opportunities for growth and optimize their sales strategy. 

  1. Website analytics dashboard

A website analytics dashboard is a visual representation of website performance data that provides insight into visitor behavior, content engagement, and conversion rates. The dashboard may include charts and graphs that show website traffic, bounce rates, and conversion rates. By analyzing this data, businesses can optimize their website design and content to improve user experience and drive conversions. 

  1. Social media analytics dashboard

A social media analytics dashboard is a visual representation of social media performance data that provides insight into engagement, reach, and sentiment. The dashboard may include charts and graphs that show engagement rates, follower growth, and sentiment analysis. By analyzing this data, businesses can optimize their social media strategy and improve engagement with their audience. 

Frequently Asked Questions (FAQs) 

Q: What is data visualization? 

A: Data visualization is the process of transforming complex data into visual representations that are easy to understand. 

Q: Why is data visualization important in business analytics?

A: Data visualization is important in business analytics because it enables businesses to communicate insights, trends, and patterns to key stakeholders in a way that is both clear and engaging. 

Q: What are some common mistakes in data visualization? 

A: Common mistakes in data visualization include overloading with data, using inappropriate visualizations, ignoring the audience, and being too complicated. 

Conclusion 

In conclusion, the art of data visualization is an essential skill for any business analyst who wants to tell compelling stories via data. Through effective data visualization, you can communicate complex information in a clear and concise way, allowing stakeholders to understand and act upon the insights provided. By using the right tools and techniques, you can transform your data into a compelling narrative that engages your audience and drives business growth. 


Written by Yogini Kuyate

May 22, 2023

Are you interested in learning Python for Data Science? Look no further than Data Science Dojo’s Introduction to Python for Data Science course. This instructor-led live training course is designed for individuals who want to learn how to use the power of Python to perform data analysis, visualization, and manipulation. 

Python is a powerful programming language used in data science, machine learning, and artificial intelligence. It is a versatile language that is easy to learn and has a wide range of applications. In this course, you will learn the basics of Python programming and how to use it for data analysis and visualization.

Learn the basics of Python programming and how to use it for data analysis and visualization in Data Science Dojo’s Introduction to Python for Data Science course. This instructor-led live training course is designed for individuals who want to learn how to use Python to perform data analysis, visualization, and manipulation. 

Why learn Python for data science? 

Python is a popular language for data science because it is easy to learn and use. It has a large community of developers who contribute to open-source libraries that make data analysis and visualization more accessible. Python is also an interpreted language, which means that you can write and run code without the need for a compiler. 

Python has a wide range of applications in data science, including: 

  • Data analysis: Python is used to analyze data from various sources such as databases, CSV files, and APIs. 
  • Data visualization: Python has several libraries that can be used to create interactive and informative visualizations of data. 
  • Machine learning: Python has several libraries for machine learning, such as scikit-learn and TensorFlow. 
  • Web scraping: Python is used to extract data from websites and APIs.
Python for data science
Python for Data Science – Data Science Dojo

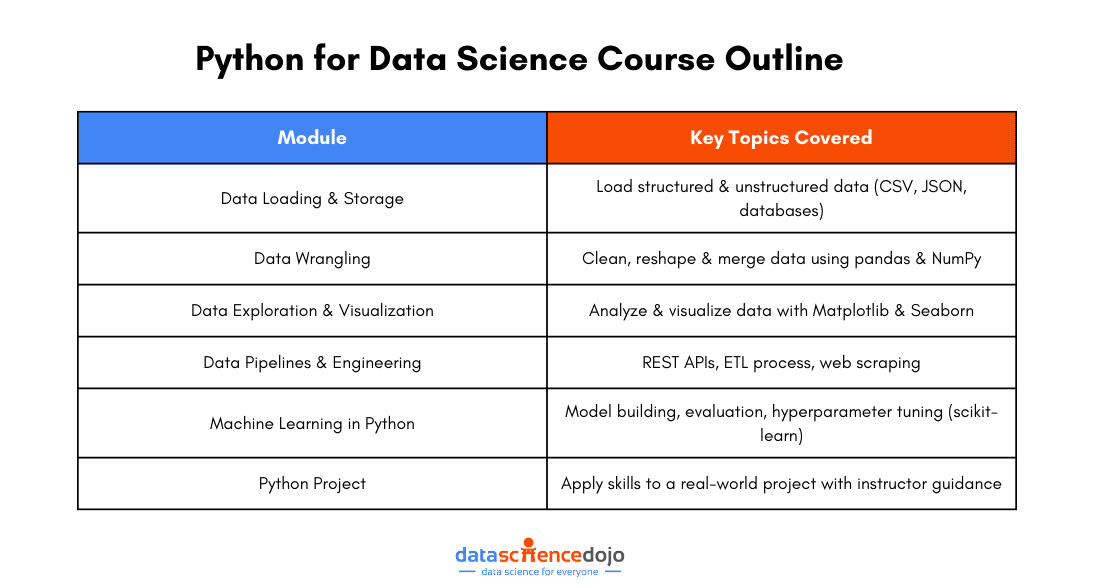
Python for Data Science Course Outline 

Data Science Dojo’s Introduction to Python for Data Science course covers the following topics: 

  • Introduction to Python: Learn the basics of Python programming, including data types, control structures, and functions. 
  • NumPy: Learn how to use the NumPy library for numerical computing in Python. 
  • Pandas: Learn how to use the Pandas library for data manipulation and analysis. 
  • Data visualization: Learn how to use the Matplotlib and Seaborn libraries for data visualization. 
  • Machine learning: Learn the basics of machine learning in Python using sci-kit-learn. 
  • Web scraping: Learn how to extract data from websites using Python. 
  • Project: Apply your knowledge to a real-world Python project.

Python is an important programming language in the data science field and learning it can have significant benefits for data scientists. Here are some key points and reasons to learn Python for data science, specifically from Data Science Dojo’s instructor-led live training program: 

  • Python is easy to learn: Compared to other programming languages, Python has a simpler and more intuitive syntax, making it easier to learn and use for beginners. 
  • Python is widely used: Python has become the preferred language for data science and is used extensively in the industry by companies such as Google, Facebook, and Amazon. 
  • Large community: The Python community is large and active, making it easy to get help and support. 
  • A comprehensive set of libraries: Python has a comprehensive set of libraries specifically designed for data science, such as NumPy, Pandas, Matplotlib, and Scikit-learn, making data analysis easier and more efficient. 
  • Versatile: Python is a versatile language that can be used for a wide range of tasks, from data cleaning and analysis to machine learning and deep learning. 
  • Job opportunities: As more and more companies adopt Python for data science, there is a growing demand for professionals with Python skills, leading to more job opportunities in the field. 

Data Science Dojo’s instructor-led live training program provides a structured and hands-on learning experience to master Python for data science. The program covers the fundamentals of Python programming, data cleaning and analysis, machine learning, and deep learning, equipping learners with the necessary skills to solve real-world data science problems.  

By enrolling in the program, learners can benefit from personalized instruction, hands-on practice, and collaboration with peers, making the learning process more effective and efficient.


Some common questions asked about the course 

  • What are the prerequisites for the course? 

The course is designed for individuals with little to no programming experience. However, some familiarity with programming concepts such as variables, functions, and control structures is helpful. 

  • What is the format of the course? 

The course is an instructor-led live training course. You will attend live online classes with a qualified instructor who will guide you through the course material and answer any questions you may have. 

  • How long is the course? 

The course is four days long, with each day consisting of six hours of instruction. 

Explore the Power of Python for Data Science

If you’re interested in learning Python for Data Science, Data Science Dojo’s Introduction to Python for Data Science course is an excellent place to start. This course will provide you with a solid foundation in Python programming and teach you how to use Python for data analysis, visualization, and manipulation.  

With its instructor-led live training format, you’ll have the opportunity to learn from an experienced instructor and interact with other students.

Enroll today and start your journey to becoming a data scientist with Python.

python for data science - banner


April 4, 2023

Data is an essential component of any business, and it is the role of a data analyst to make sense of it all. Power BI is a powerful data visualization tool that helps them turn raw data into meaningful insights and actionable decisions.

In this blog, we will explore the role of data analysts and how they use Power BI to extract insights from data and drive business success. From data discovery and cleaning to report creation and sharing, we will delve into the key steps that can be taken to turn data into decisions. 

A data analyst is a professional who uses data to inform business decisions. They process and analyze large sets of data to identify trends, patterns, and insights that can help organizations make more informed decisions. 


Data Analyst using Power BI
Uses of Power BI for a Data Analyst – Data Science Dojo

Who is a data analyst?

A data analyst is a professional who works with data to extract insights, draw conclusions, and support decision-making. They use a variety of tools and techniques to clean, transform, visualize, and analyze data to understand patterns, relationships, and trends. The role of a data analyst is to turn raw data into actionable information that can inform and drive business strategy.

They use various tools and techniques to extract insights from data, such as statistical analysis, and data visualization. They may also work with databases and programming languages such as SQL and Python to manipulate and extract data. 

The importance of data analysts in an organization is that they help organizations make data-driven decisions. By analyzing data, analysts can identify new opportunities, optimize processes, and improve overall performance. They also help organizations make more informed decisions by providing insights into customer behavior, market trends, and other key metrics.

Additionally, their role and job can help organizations stay competitive by identifying areas where they may be lagging and providing recommendations for improvement. 

Defining Power BI 

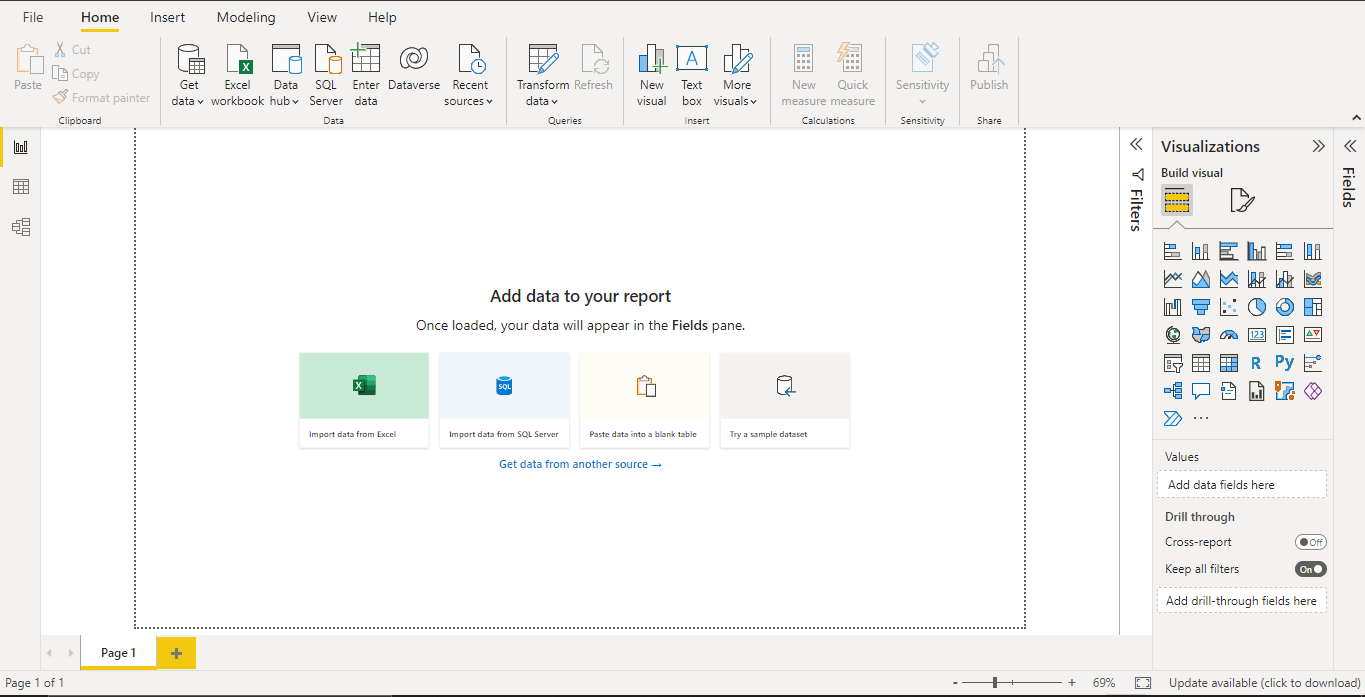
Power BI provides a suite of data visualization and analysis tools to help organizations turn data into actionable insights. It allows users to connect to a variety of data sources, perform data preparation and transformations, create interactive visualizations, and share insights with others. 

Check out this course and learn Power BI today!

The platform includes features such as data modeling, data discovery, data analysis, and interactive dashboards. It enables organizations to quickly create and share visualizations, reports, and dashboards with stakeholders, regardless of their technical skill level.

Power BI also provides collaboration features, allowing team members to work together on data insights, and share information and insights with others through Power BI reports and dashboards. 

Key capabilities of Power BI  

Data Connectivity:It allows users to connect to various data sources including Excel, SQL Server, Azure SQL, and other cloud-based data sources. 

Data Transformation: It provides a wide range of data transformation tools that allow users to clean, shape, and prepare data for analysis. 

Visualization: It offers a wide range of visualization options, including charts, tables, and maps, that allow users to create interactive and visually appealing reports. 

Sharing and Collaboration: It allows users to share and collaborate on reports and visualizations with others in their organization. 

Mobile Access: It also offers mobile apps for iOS and Android, that allow users to access and interact with their data on the go. 

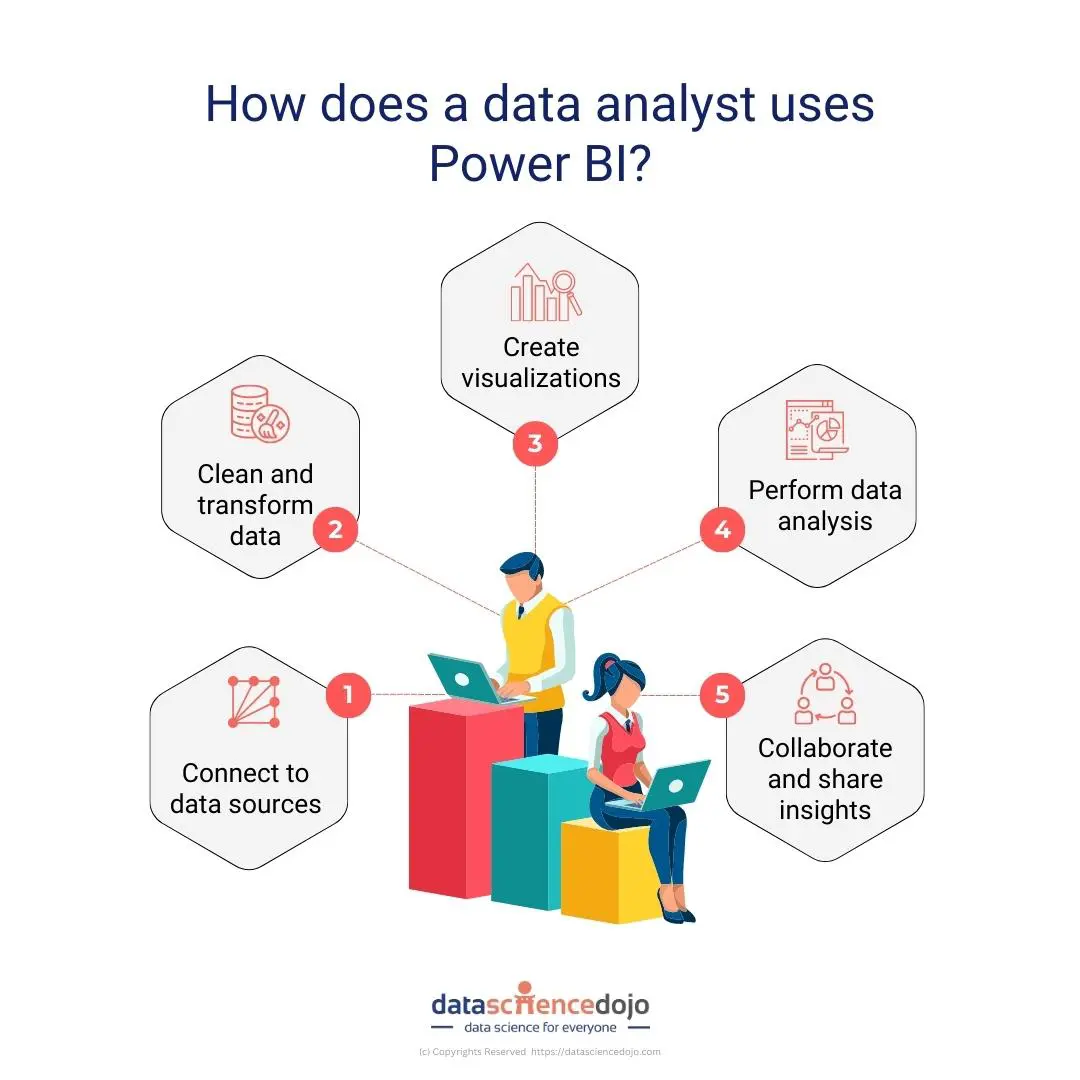
How does a data analyst use Power BI? 

A data analyst uses Power BI to collect, clean, transform, visualize, and analyze data to turn it into meaningful insights and decisions. The following steps outline the process of using Power BI for data analysis: 

  1. Connect to data sources: A data analyst can import data from a variety of sources, such as spreadsheets, databases, or cloud-based services. Power BI provides several ways to import data, including manual upload, data connections, and direct connections to data sources. 
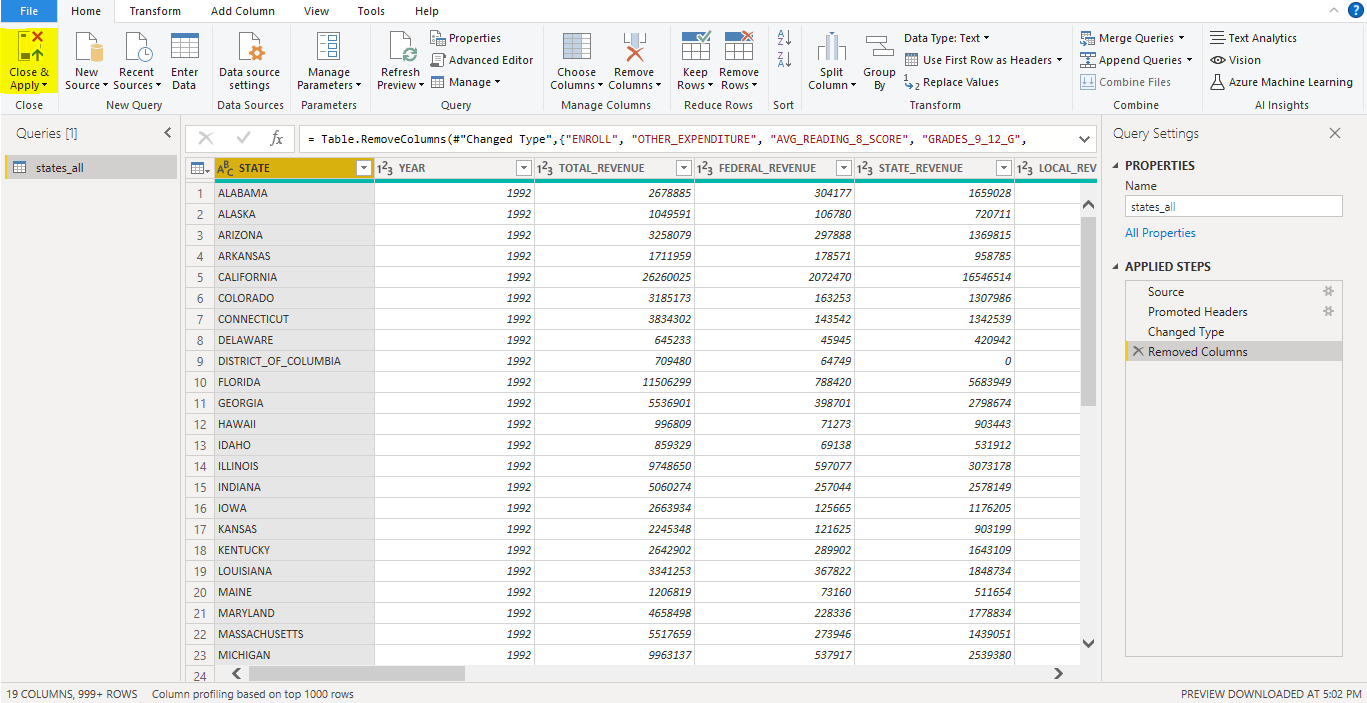
  2. Clean and transform data: Before data can be analyzed, it often needs to be cleaned and prepared. This may include removing any extraneous information, correcting errors or inconsistencies, and transforming data into a format that is usable for analysis.
  3. Create visualizations: Once the data has been prepared, a data analyst can use Power BI to create visualizations of the data. This may include bar charts, line graphs, pie charts, scatter plots, and more. Power BI provides a few built-in visualizations and the ability to create custom visualizations, giving data analysts a wide range of options for presenting data. 
  4. Perform data analysis: Power BI provides a range of data analysis tools, including calculated fields and measures, and the DAX language, which allows data analysts to perform more advanced analysis. These tools allow them to uncover insights and trends that might not be immediately apparent. 
  5. Collaborate and share insights: Once insights have been uncovered, data analysts can share their findings with others through Power BI reports or dashboards. These reports provide a way to present data visualizations and analysis results to stakeholders and can be published and shared with others. 


Learn Power BI with this crash course in no time!


By following these steps, a data analyst can use Power BI to turn raw data into meaningful insights and decisions that can inform business strategy and decision-making. 


Why should you use data analytics with Power BI? 

User-friendly interface – Power BI has a user-friendly interface, which makes it easy for users with little to no technical skills to create and share interactive dashboards, reports, and visualizations. 

Real-time data visualization – It provides real-time data visualization, allowing users to analyze data in real time and make quick decisions. 

Integration with other Microsoft tools – Power BI integrates seamlessly with other Microsoft tools, such as Excel, SharePoint, and Azure, making it an ideal tool for organizations using Microsoft technology. 

Wide range of data sources – It can connect to a wide range of data sources, including databases, spreadsheets, cloud services, and web APIs, making it easy to consolidate data from multiple sources. 

Cost-effective – It is a cost-effective solution for data analytics, with both free and paid versions available, making it accessible to organizations of all sizes. 

Mobile accessibility – Power BI provides mobile accessibility, allowing users to access and analyze data from anywhere, on any device. 

Collaboration features – With robust collaboration features, it allows users to share dashboards and reports with other team members, encouraging teamwork and decision-making. 

Conclusion 

In conclusion, Power BI is a powerful tool for data analysis that provides organizations with the ability to easily visualize, analyze, and share complex data. By preparing, cleaning, and transforming data, creating relationships between tables, using visualizations and DAX, they can create reports and dashboards that provide valuable insights into key business metrics.

The ability to publish reports, share insights, and collaborate with others makes Power BI an essential tool for any organization looking to improve performance and make informed decisions.

February 9, 2023

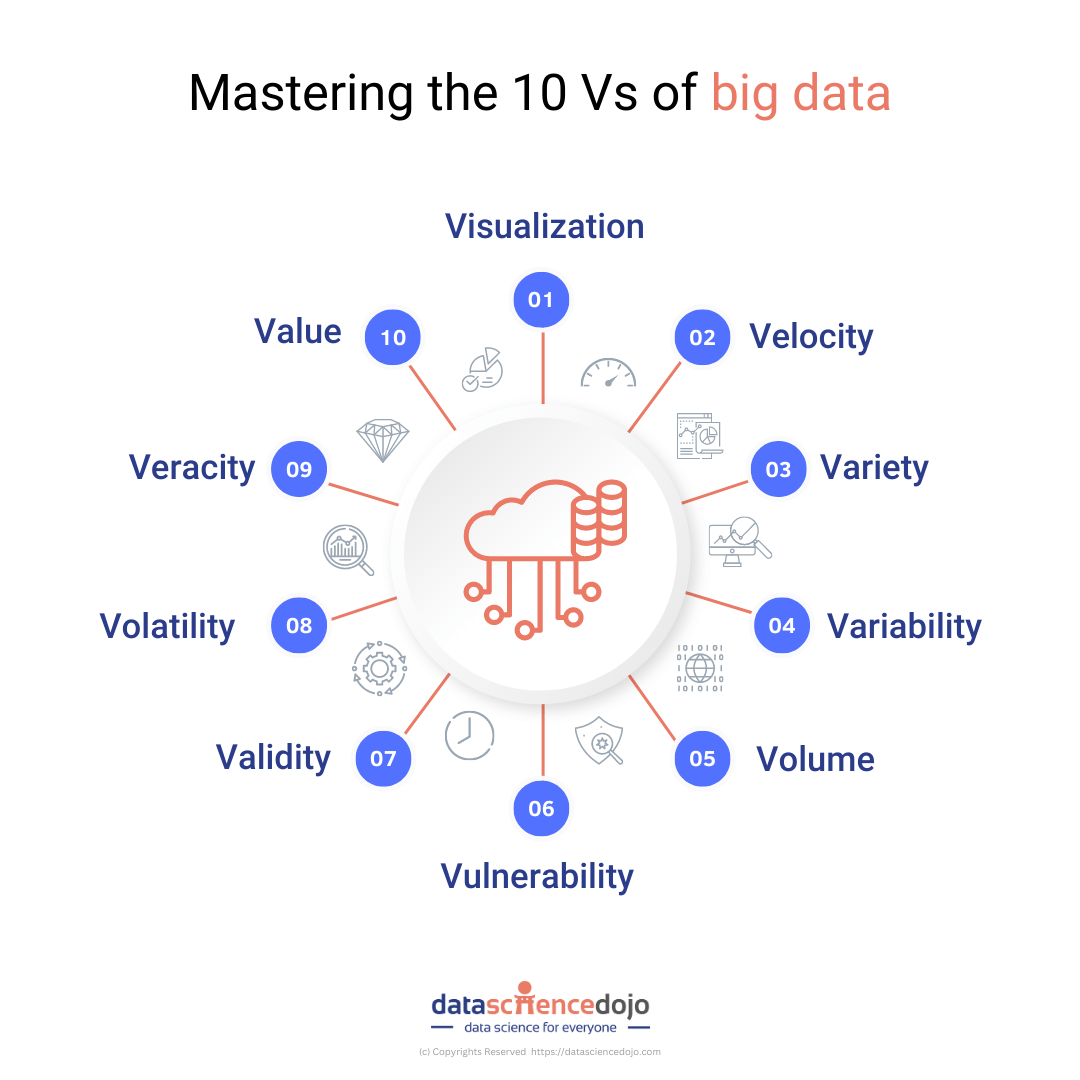
Big data is conventionally understood in terms of its scale. This one-dimensional approach, however, runs the risk of simplifying the complexity of big data. In this blog, we discuss the 10 Vs as metrics to gauge the complexity of big data. 

When we think of “big data,” it is easy to imagine a vast, intangible collection of customer information and relevant data required to grow your business. But the term “big data” isn’t about size – it’s also about the potential to uncover valuable insights by considering a range of other characteristics. In other words, it’s not just about the amount of data we have, but also how we use and analyze it. 

10 vs of big data
10 vs of big data

Volume 

The most obvious feature is the volume that captures the sheer scale of a certain dataset. Consider, for example, 40,000 apps added to the app store each year. Similarly, 1 in 40,000 searches are made over Google every second. 

Big numbers carry the immediate appeal of big data. Whether it is the 2.2 billion active monthly users on Facebook or the 2.2 billion cups of coffee that are consumed in single day, big numbers capture qualities about large swathes of population, conveying insights that can feel universal in their scale.  

As another example, consider the 294 billion emails being sent every day. In comparison, there are 300 billion stars in the Milky Way. Somehow, the largeness of these numbers in a human context can help us make better sense of otherwise unimaginable quantities like the stars in the Milky Way! 


Velocity 

In nearly all the examples considered above, velocity of the data was also an important feature. Velocity adds to volume, allowing us to grapple with data as a dynamic quantity. In big data it refers to how quickly data is generated and how fast it moves. It is one of the three Vs of big data, along with volume and variety. Velocity is important for businesses that need their data to be quickly available for making informed decisions. 


Variety 

Variety, here, refers to the several types of data that are constantly in circulation and is an integral quality of big data. Different data sets are unstructured. This includes data shared over social media and instant messaging regularly such as videos, audio, and phone recordings. 

Then, there is the 10% semi-structured data in circulation including emails, webpages, zipped files, etc. Lastly, there is the rarity of structured data such as financial transactions. 

Data types are a defining feature of big data as unstructured data needs to be cleaned and structured before it can be used for data analytics. In fact, the availability of clean data is among the top challenges facing data scientists. According to Forbes, most data scientists spend 60% of their time cleaning data.  


Variability 

Variability is a measure of the inconsistencies in data and is often confused with variety. To understand variability, let us consider an example. You go to a coffee shop every day and purchase the same latte each day. However, it may smell or taste slightly or significantly different each day.  

This kind of inconsistency in data is an important feature as it places limits on the reproducibility of data. This is particularly relevant in sentiment analysis which is much harder for AI models as compared to humans. Sentiment analysis requires an additional level of input, i.e., context.  

An example of variability in big data can be seen when investigating the amount of time spent on phones daily by diverse groups of people. The data collected from different samples (high school students, college students, and adult full-time employees) can vary, resulting in variability. Another example could be a soda shop offering different blends of soda but having different taste every day, which is variability. 

Variability also accounts for the inconsistent speed at which data is downloaded and stored across various systems, creating a unique experience for customers consuming the same data.  


Veracity 

Veracity refers to the reliability of the data source. Numerous factors can contribute to the reliability of the input they provide at a particular time in a particular situation. 

Veracity is particularly important for making data-driven decisions for businesses as reproducibility of patterns relies heavily on the credibility of initial data inputs. 


Validity 

Validity pertains to the accuracy of data for its intended use. For example, you may acquire a dataset pertaining to data related to your subject of inquiry, increasing the task of forming a meaningful relationship and inquiry. Registered charity data contact lists 


Volatility

Volatility refers to the time considerations placed on a particular data set. It involves considering if data acquired a year ago would be relevant for analysis for predictive modeling today. This is specific to the analyses being performed. Similarly, volatility also means gauging whether a particular data set is historic or not. Usually, data volatility comes under data governance and is assessed by data engineers.  


Learn practical data science today!


Vulnerability 

Big data is often about consumers. We often overlook the potential harm in sharing our shopping data, but the reality is that it can be used to uncover confidential information about an individual. For instance, Target accurately predicted a teenage girl’s pregnancy before her own parents knew it. To avoid such consequences, it’s important to be mindful of the information we share online. 


Visualization  

With a new data visualization tool being released every month or so, visualizing data is key to insightful results. The traditional x-y plot no longer suffices for the kind of complex detailing that goes into categorizations and patterns across various parameters obtained via big data analytics.  


Value 

BIG data is nothing if it cannot produce meaningful value. Consider, again, the example of Target using a 16-year-old’s shopping habits to predict her pregnancy. While in this case, it violates privacy, in most other cases, it can generate incredible customer value by bombarding them with the specific product advertisement they require. 


Learn about 10 Vs of big data by George Firican

10 Vs of Big Data 


Enable smart decision making with big data visualization

The 10 Vs of big data are Volume, Velocity, Variety, Veracity, Variability, Value, Viscosity, Volume growth rate, Volume change rate, and Variance in volume change rate. These are the characteristics of big data and help to understand its complexity.

The skills needed to work with big data involve coding, although the level of knowledge required for coding is not as deep as that of a programmer. Big Data and Data Science are two concepts that play a crucial role in enabling data-driven decision making. 90% of the world’s data has been created in the last two years, providing an incredible amount of data being created daily.

Companies employ data scientists to use data mining and big data to learn more about consumers and their behaviors. Both Data Mining and Big Data Analysis are major elements of data science. 

Small Data, on the other hand, is collected in a more controlled manner,  whereas Big Data refers to data sets that are too large or complex to be processed by traditional data processing applications. 

January 31, 2023

In this blog, we will discuss exploratory data analysis, also known as EDA, and why it is important. We will also be sharing code snippets so you can try out different analysis techniques yourself. So, without any further ado let’s dive right in. 

What is Exploratory Data Analysis (EDA)? 

“The greatest value of a picture is when it forces us to notice what we never expected to see.”  John Tukey, American Mathematician 

A core skill to possess for someone who aims to pursue data science, data analysis or affiliated fields as a career is exploratory data analysis (EDA). To put it simply, the goal of EDA is to discover underlying patterns, structures, and trends in the datasets and drive meaningful insights from them that would help in driving important business decisions. 

The data analysis process enables analysts to gain insights into the data that can inform further analysis, modeling, and hypothesis testing.  

EDA is an iterative process of conglomerative activities which include data cleaning, manipulation and visualization. These activities together help in generating hypotheses, identifying potential data cleaning issues, and informing the choice of models or modeling techniques for further analysis. The results of EDA can be used to improve the quality of the data, to gain a deeper understanding of the data, and to make informed decisions about which techniques or models to use for the next steps in the data analysis process. 

Often it is assumed that EDA is to be performed only at the start of the data analysis process, however the reality is in contrast to this popular misconception, as stated EDA is an iterative process and can be revisited numerous times throughout the analysis life cycle if need may arise.  

In this blog while highlighting the importance and different renowned techniques of EDA we will also show you examples with code so you can try them out yourselves and better comprehend what this interesting skill is all about. 


Note: the dataset used for this purpose can be found at: https://www.kaggle.com/datasets/raniahelmy/no-show-investigate-dataset  

Want to see some exciting visuals that we can create from this dataset? DSD got you covered! Visit the link  

Importance of EDA: 

One of the key advantages of EDA is that it allows you to develop a deeper understanding of your data before you begin modelling or building more formal, inferential models. This can help you identify  

  • Important variables,  
  • Understand the relationships between variables, and  
  • Identify potential issues with the data, such as missing values, outliers, or other problems that might affect the accuracy of your models. 

Another advantage of EDA is that it helps in generating new insights which may incur associated hypotheses, those hypotheses then can be tested and explored to gain a better understanding of the dataset. 

Finally, EDA helps you uncover hidden patterns in a dataset that were not comprehensible to the naked eye, these patterns often lead to interesting factors that one couldn’t even think would affect the target variable. 

Want to start your EDA journey, well you can always get yourself registered at Data Science Bootcamp.  

Common EDA techniques: 

The technique you employ for EDA is intertwined with the task at hand, many times you would not require implementing all the techniques, on the other hand there would be times that you’ll need accumulation of the techniques to gain valuable insights. To familiarize you with a few we have listed some of the popular techniques that would help you in EDA. 

Visualization:  

One of the most popular and effective ways to explore data is through visualization. Some popular types of visualizations include histograms, pie charts, scatter plots, box plots and much more. These can help you understand the distribution of your data, identify patterns, and detect outliers. 

Below are a few examples on how you can use visualization aspect of EDA to your advantage: 

Histogram: 

The histogram is a kind of visualization that shows the frequencies of each category in a dataset. 

Data- Histogram

Histogram
Histogram

The above graph shows us the number of responses belonging to different age groups and they have been partitioned based on how many came to the appointment and how many did not show up. 

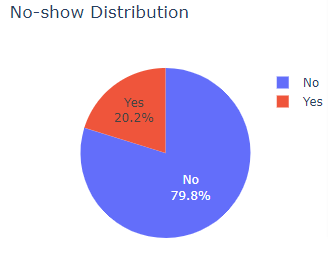
Pie Chart: 

A pie chart is a circular image, it is usually used for a single feature to indicate how the data of that feature are distributed, commonly represented in percentages. 

Pie chart- Data

Pie chart
Pie Chart


The pie chart shows the distribution that 20.2% of the total data comprises of individuals who did not show up for the appointment while 79.8% of individuals did show up. 

Box Plot: 

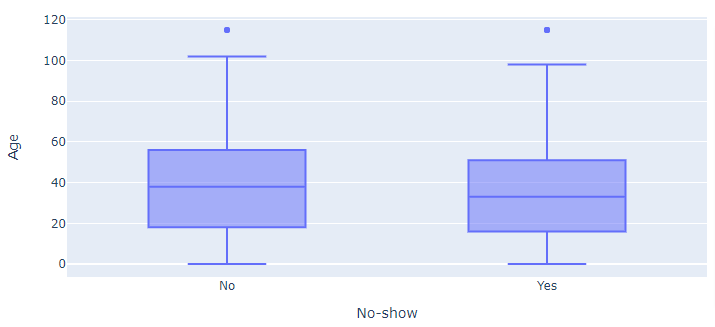
Box plot is also an important kind of visualization that is used to check how the data is distributed, it shows the five number summary of the dataset, which is quite useful in many aspects such as checking if the data is skewed, or detecting the outliers etc.  

box plot - data

Box plot
Box Plot


The box plot shows the distribution of the Age column, segregated on the basis of individuals who showed and did not show up for the appointments. 

Descriptive statistics:  

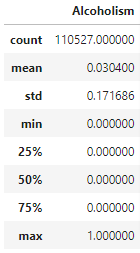
Descriptive statistics are a set of tools for summarizing data in a way that is easy to understand. Some common descriptive statistics include mean, median, mode, standard deviation, and quartiles. These can provide a quick overview of the data and can help identify the central tendency and spread of the data.

data frame - descriptive statistics

descriptive statistics
Descriptive statistics


Grouping and aggregating:  

One way to explore a dataset is by grouping the data by one or more variables, and then aggregating the data by calculating summary statistics. This can be useful for identifying patterns and trends in the data. 

groupby - data

grouping and aggregation of data
Grouping and Aggregation of Data


Data cleaning:  

Exploratory data analysis also includes cleaning data, it may be necessary to handle missing values, outliers, or other data issues before proceeding with further analysis.  

data cleaning - data frame Data Cleaning


As you can see, fortunately this dataset did not have any missing value. 

Correlation analysis: 

Correlation analysis is a technique for understanding the relationship between two or more variables. You can use correlation analysis to determine the degree of association between variables, and whether the relationship is positive or negative. 

correlation analysis - data frame

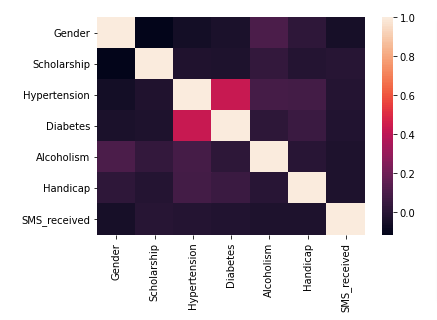
correlation analysis
Correlation Analysis

The heatmap indicates to what extent different features are correlated to each other, with 1 being highly correlated and 0 being no correlation at all. 

Types of EDA: 

There are a few different types of exploratory data analysis (EDA) that are commonly used, depending on the nature of the data and the goals of the analysis. Here are a few examples: 

Univariate EDA:  

Univariate EDA, short for univariate exploratory data analysis, examines the properties of a single variable by techniques such as histograms, statistics of central tendency and dispersion, and outliers detection. This approach helps understand the basic features of the variable and uncover patterns or trends in the data. 

Pie 2 - data frame

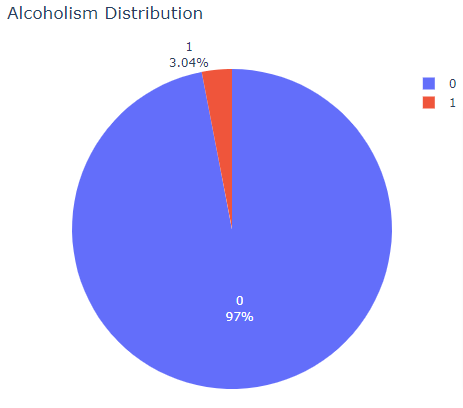
Alcoholism - pie chart
Alcoholism – Pie Chart


The pie chart indicates what percentage of individuals from the total data are identified as alcoholic. 

data frame alcoholism

alcoholism data
Alcoholism data

Bivariate EDA:  

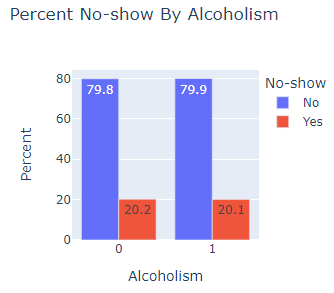
This type of EDA is used to analyse the relationship between two variables. It includes techniques such as creating scatter plots and calculating correlation coefficients and can help you understand how two variables are related to each other.
bivariate data frame

Bivariate data chart


The bar chart shows what percentage of individuals are alcoholic or not and whether they showed up for the appointment or not. 

Multivariate EDA:  

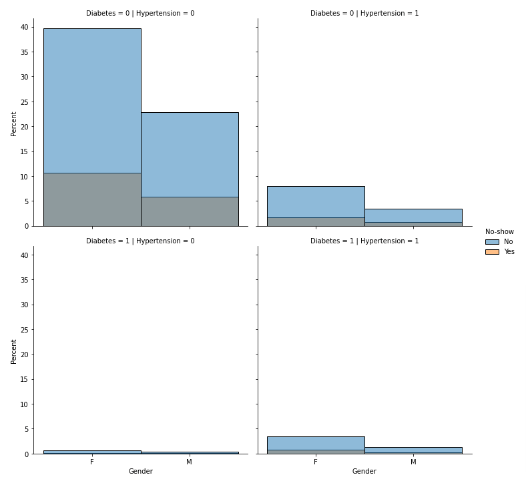
This type of EDA is used to analyze the relationships between three or more variables. It can include techniques such as creating multivariate plots, running factor analysis, or using dimensionality reduction techniques such as PCA to identify patterns and structure in the data.

Multivariate data frame

Multivariate data chart

The above visualization is distplot of kind, bar, it shows what percentage of individuals belong to one of the possible four combinations diabetes and hypertension, moreover they are segregated on the basis of gender and whether they showed up for appointment or not.  

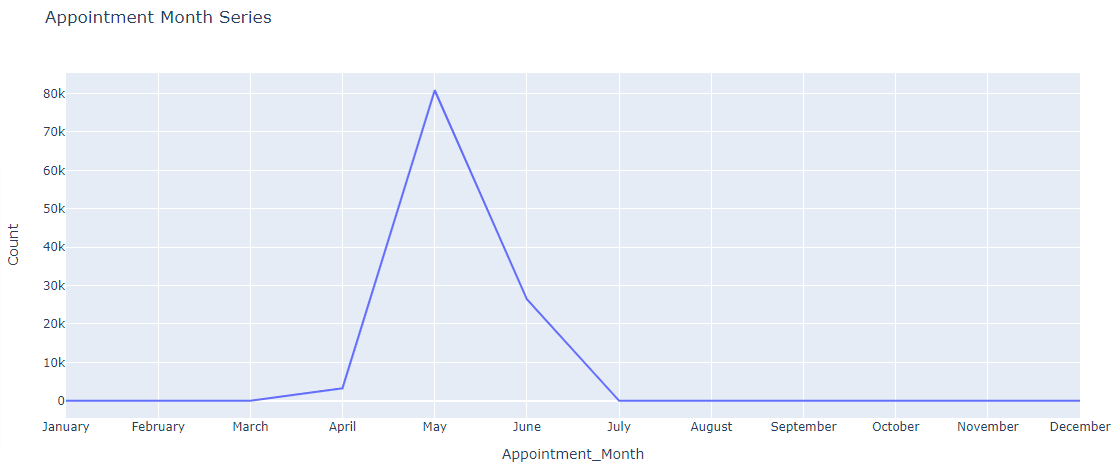
Time-series EDA:  

This type of EDA is used to understand patterns and trends in data that are collected over time, such as stock prices or weather patterns. It may include techniques such as line plots, decomposition, and forecasting. 

time series data frame

Time series data chart
Time Series Data Chart


This kind of chart helps us gain insight of the time when most appointments were scheduled to happen, as you can see around 80k appointments were made for the month of May.

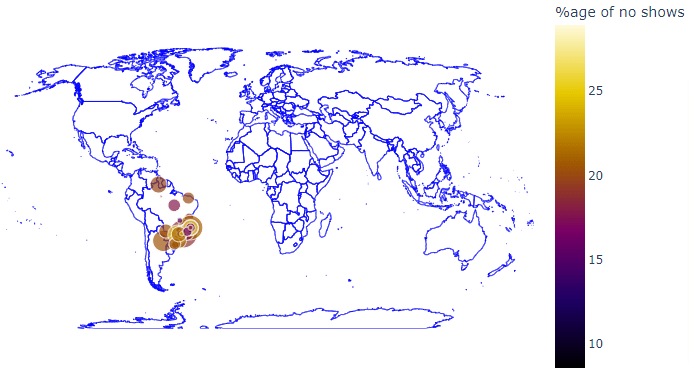
Spatial EDA:  

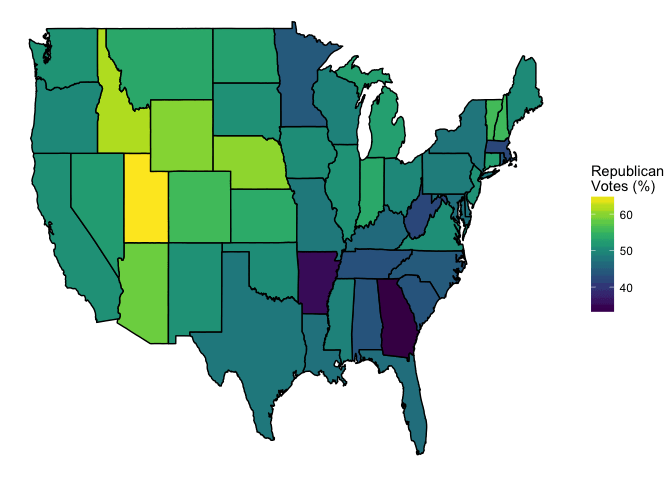
This type of EDA deals with data that have a geographic component, such as data from GPS or satellite imagery. It can include techniques such as creating choropleth maps, density maps, and heat maps to visualize patterns and relationships in the data.

Spatial data frame

Spatial data chart