Power BI and R can be used together to achieve analyses that are difficult or impossible to achieve.
It is a powerful technology for quickly creating rich visualizations. It has many practical uses for the modern data professional including executive dashboards, operational dashboards, and visualizations for data exploration/analysis.
Microsoft has also extended Power BI with support for incorporating R visualizations into its projects, enabling a myriad of data visualization use cases across all industries and circumstances. As such, it is an extremely valuable tool for any Data Analyst, Product/Program Manager, or Data Scientist to have in their tool belt.
At the meetup for this topic presenter David Langer showed how it can be using R visualizations to achieve analyses that are difficult, or not possible, to achieve with out-of-the-box features.
A primary focus of the talk was a number of “gotchas” to be aware of when using R Visualizations within the projects:
- It limits data passed to R visualizations to 150,000 rows.
- It automatically removes duplicate rows before passing data to it.
- It allows for permissive column names that can cause difficulties in R code.
David also covered best practices for using R visualizations within its projects, including using R tools like RStudio or Visual Studio R Tools to make R visualization development faster. A particularly interesting aspect of the talk was how to engineer R code to allow for copy-and-paste from RStudio into Power BI.
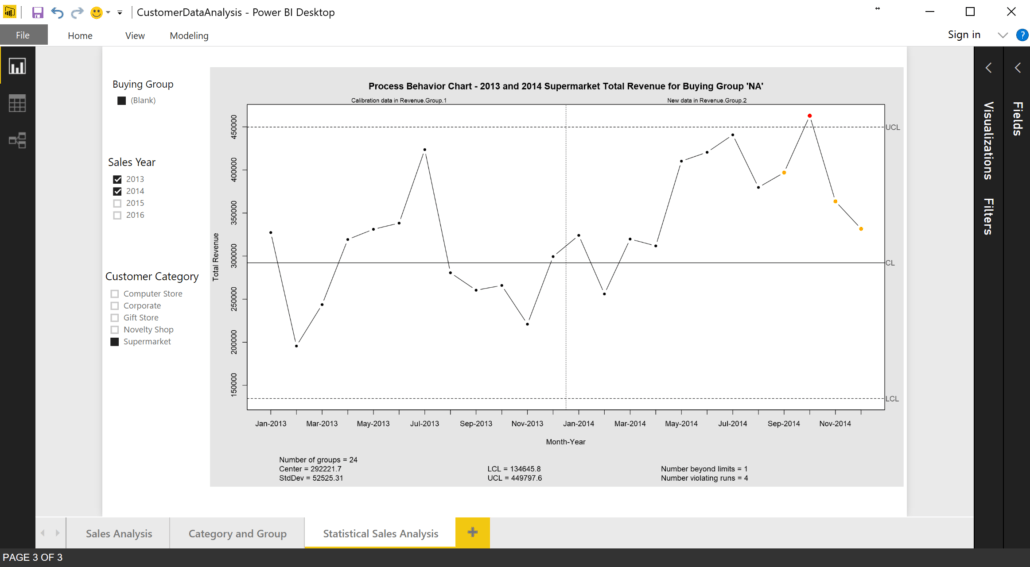
The talk concluded with examples of how R visualizations can be incorporated into a project to allow for robust, statistically valid analyses of aggregated business data. The following visualization is an example from the talk:
Enjoy the video of Power BI!
Learn more about Power BI with Data Science Dojo
Written by Dave Langer