Imagine effortlessly asking your business intelligence dashboard any question and receiving instant, insightful answers. This is not a futuristic concept but a reality unfolding through the power of Large Language Models (LLMs).
Descriptive analytics is at the core of this transformation, turning raw data into comprehensible narratives. When combined with the advanced capabilities of LLMs, Business Intelligence (BI) dashboards evolve from static displays of numbers into dynamic tools that drive strategic decision-making.
LLMs are changing the way we interact with data. These advanced AI models excel in natural language processing (NLP) and understanding, making them invaluable for enhancing descriptive analytics in Business Intelligence (BI) dashboards.

In this blog, we will explore the power of LLMs in enhancing descriptive analytics and its impact of business intelligence dashboards.
Understanding Descriptive Analytics
Descriptive analytics is the most basic and common type of analytics that focuses on describing, summarizing, and interpreting historical data.
Companies use descriptive analytics to summarize and highlight patterns in current and historical data, enabling them to make sense of vast amounts of raw data to answer the question, “What happened?” through data aggregation and data visualization techniques.
The Evolution of Dashboards: From Static to LLM
Initially, the dashboards served as simplified visual aids, offering a basic overview of key metrics amidst cumbersome and text-heavy reports.
However, as businesses began to demand real-time insights and more nuanced data analysis, the static nature of these dashboards became a limiting factor forcing them to evolve into dynamic, interactive tools. The dashboards transformed into Self-service BI tools with drag-drop functionalities and increased focus on interactive user-friendly visualization.
This is not it, with the realization of increasing data, Business Intelligence (BI) dashboards shifted to cloud-based mobile platforms, facilitating integration to various data sources, and allowing remote collaboration. Finally, the Business Intelligence (BI) dashboard integration with LLMs has unlocked the wonderful potential of analytics.
Explore the Top 5 Marketing Analytics Tools for Success
Role of Descriptive Analytics in Business Intelligence Dashboards and its Limitations
Despite of these shifts, the analysis of dashboards before LLMs remained limited in its ability to provide contextual insights and advanced data interpretations, offering a retrospective view of business performance without predictive or prescriptive capabilities.
The following are the basic capabilities of descriptive analytics:
Defining Visualization
Descriptive analytics explains visualizations like charts, graphs, and tables, helping users quickly grasp key insights. However, this requires manually describing the analyzed insights derived from SQL queries, requiring analytics expertise and knowledge of SQL.
Trend Analysis
By identifying patterns over time, descriptive analytics helps businesses understand historical performance and predict future trends, making it critical for strategic planning and decision-making.
However, traditional analysis of Business Intelligence (BI) dashboards may struggle to identify intricate patterns within vast datasets, providing inaccurate results that can critically impact business decisions.
Learn to deploy and host predictive models
Reporting
Reports developed through descriptive analytics summarize business performance. These reports are essential for documenting and communicating insights across the organization.
However, extracting insights from dashboards and presenting them in an understandable format can take time and is prone to human error, particularly when dealing with large volumes of data.

LLMs: A Game-Changer for Business Intelligence Dashboards
Advanced Query Handling
Imagine you would want to know “What were the top-selling products last quarter?” Conventionally, data analysts would write an SQL query, or create a report in a Business Intelligence (BI) tool to find the answer. Wouldn’t it be easier to ask those questions in natural language?
LLMs enable users to interact with dashboards using natural language queries. This innovation acts as a bridge between natural language and complex SQL queries, enabling users to engage in a dialogue, ask follow-up questions, and delve deeper into specific aspects of the data.
Improved Visualization Descriptions
Advanced Business Intelligence (BI) tools integrated with LLMs offer natural language interaction and automatic summarization of key findings. They can automatically generate narrative summaries, identify trends, and answer questions for complex data sets, offering a comprehensive view of business operations and trends without any hustle and minimal effort.
Another interesting read: Fun with Data Visualizations
Predictive Insights
With the integration of a domain-specific Large Language Model (LLM), dashboard analysis can be expanded to offer predictive insights enabling organizations to leverage data-driven decision-making, optimize outcomes, and gain a competitive edge.
Dashboards supported by Large Language Mode (LLMs) utilize historical data and statistical methods to forecast future events. Hence, descriptive analytics goes beyond “what happened” to “what happens next.”
Prescriptive Insights
Beyond prediction, descriptive analytics powered by LLMs can also offer prescriptive recommendations, moving from “what happens next” to “what to do next.” By considering numerous factors, preferences, and constraints, LLMs can recommend optimal actions to achieve desired outcomes.
Read more about Data Visualization
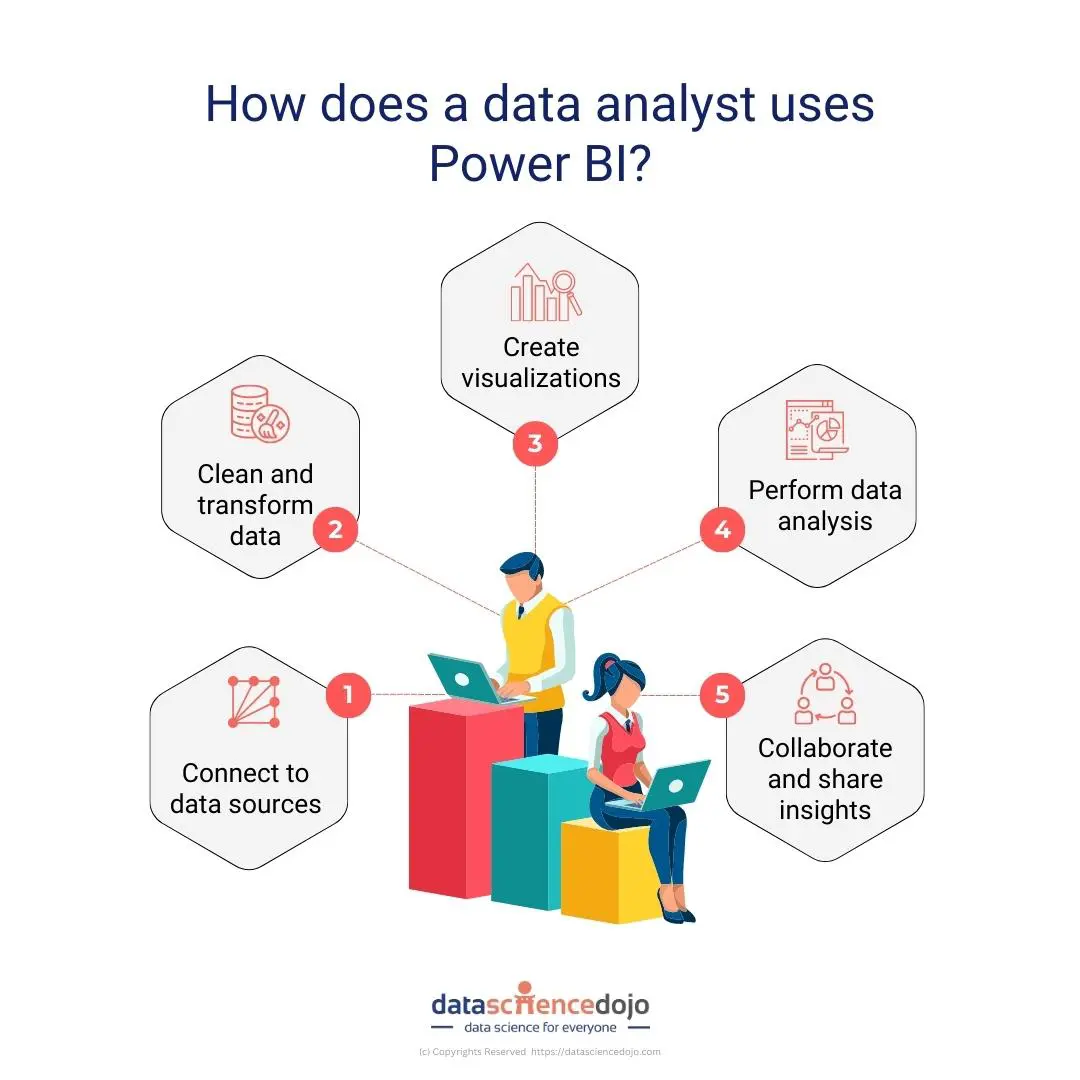
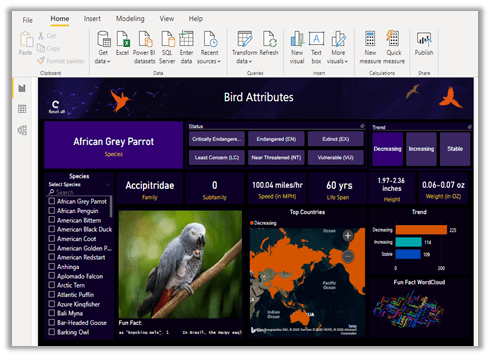
Example – Power BI
The Copilot integration in Power BI offers advanced Business Intelligence (BI) capabilities, allowing you to ask Copilot for summaries, insights, and questions about visuals in natural language. Power BI has truly paved the way for unparalleled data discovery from uncovering insights to highlighting key metrics with the power of Generative AI.
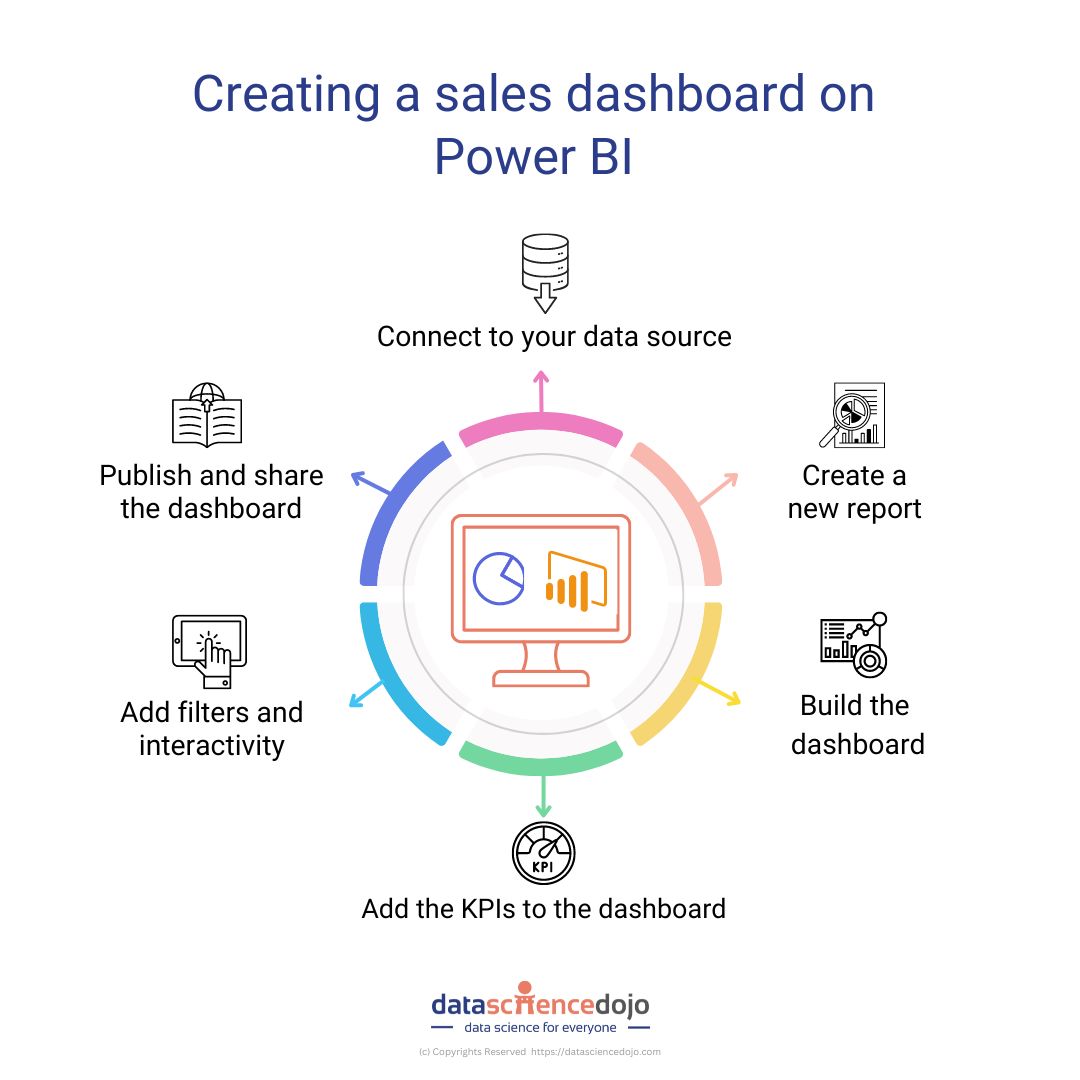
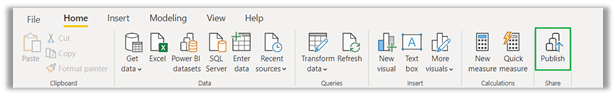
Here is how you can get started using Power BI with Copilot integration;
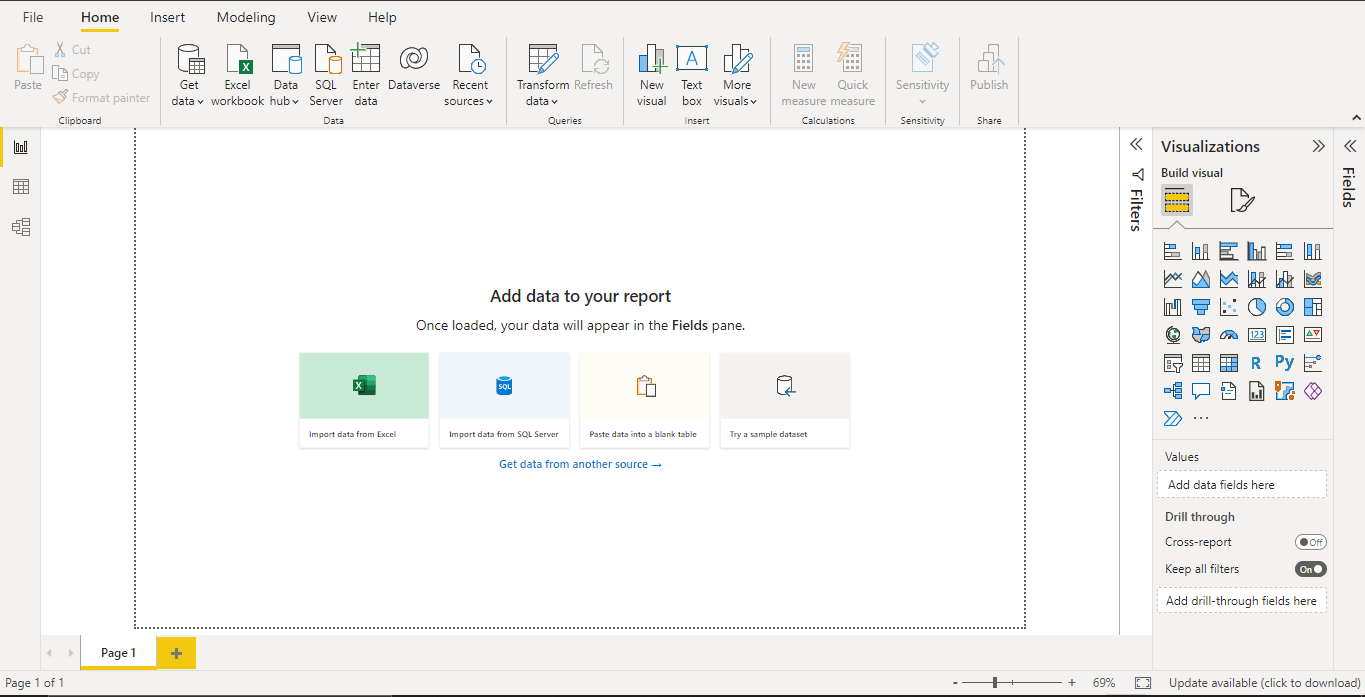
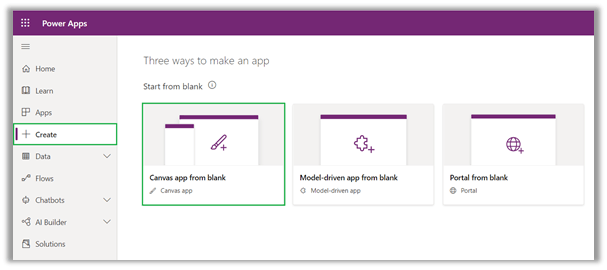
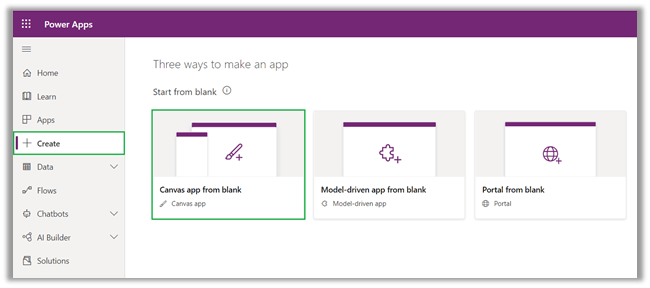
Step 1
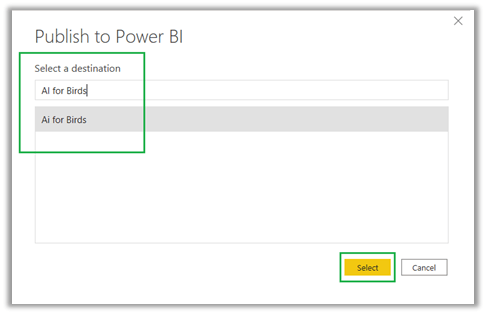
Open Power BI. Create workspace (To use Copilot, you need to select a workspace that uses a Power BI Premium per capacity, or a paid Microsoft Fabric capacity).
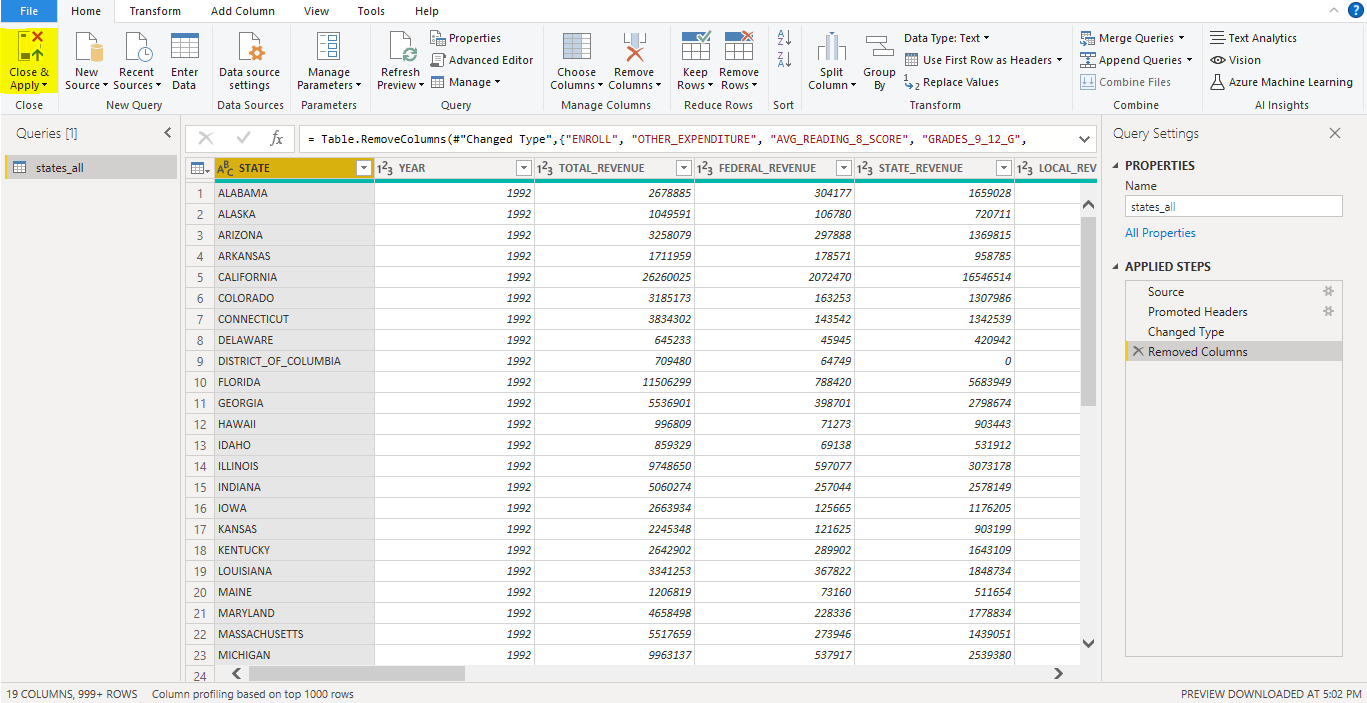
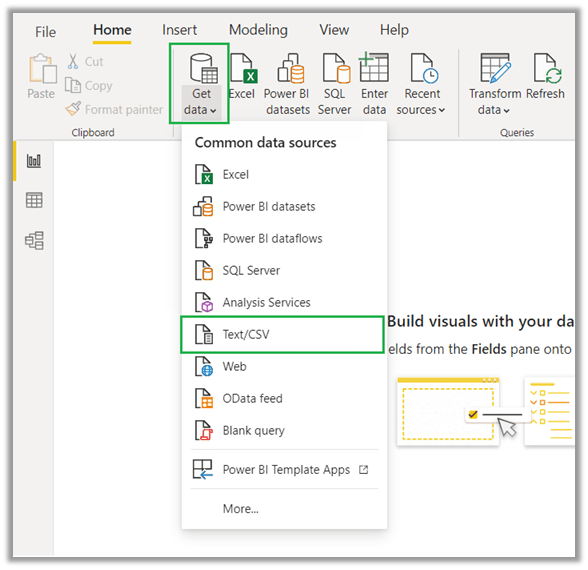
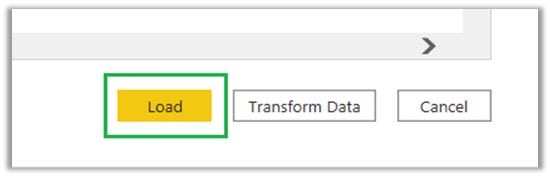
Step 2
Upload your business data from various sources. You may need to clean and transform your data as well to gain better insights. For example, a sample ‘sales data for hotels and resorts’ is used here.
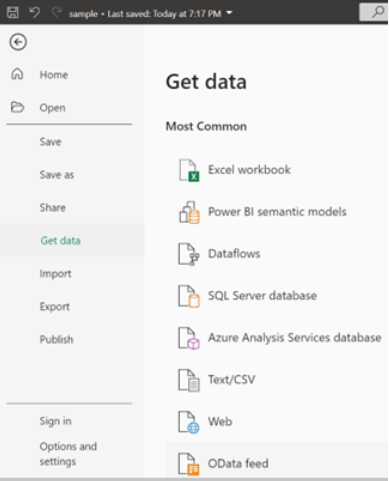
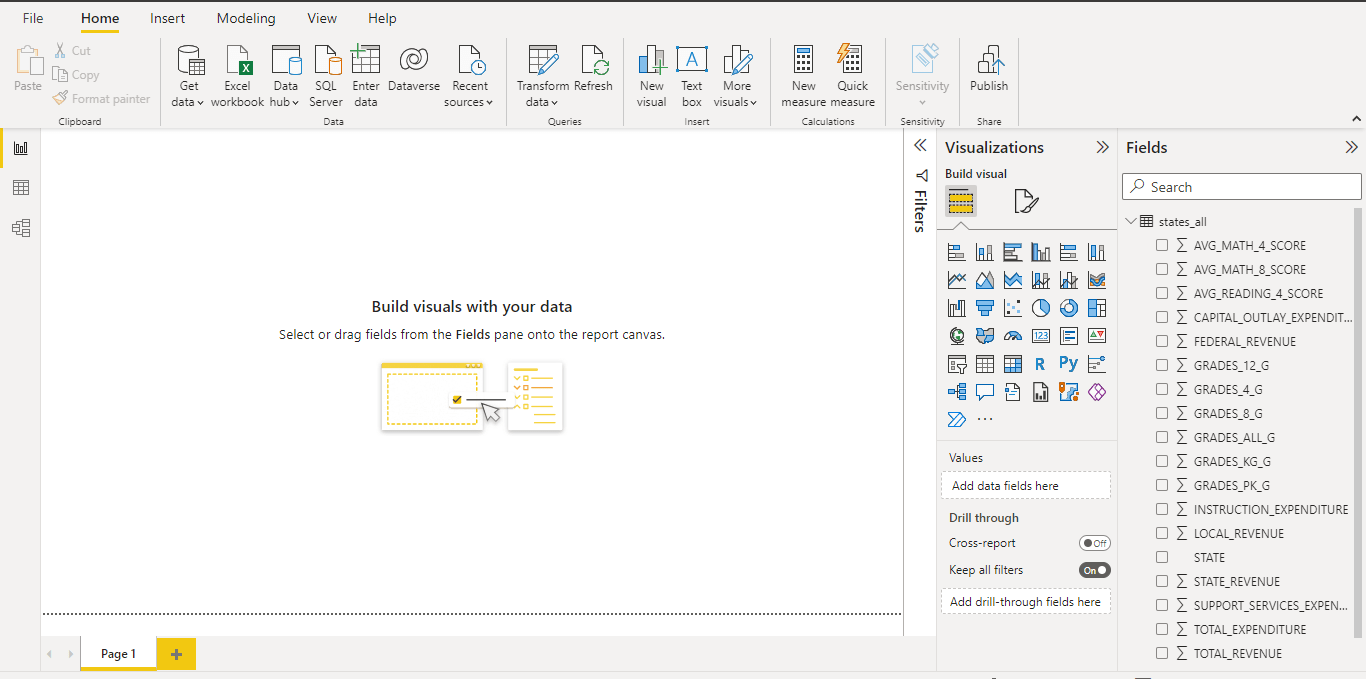
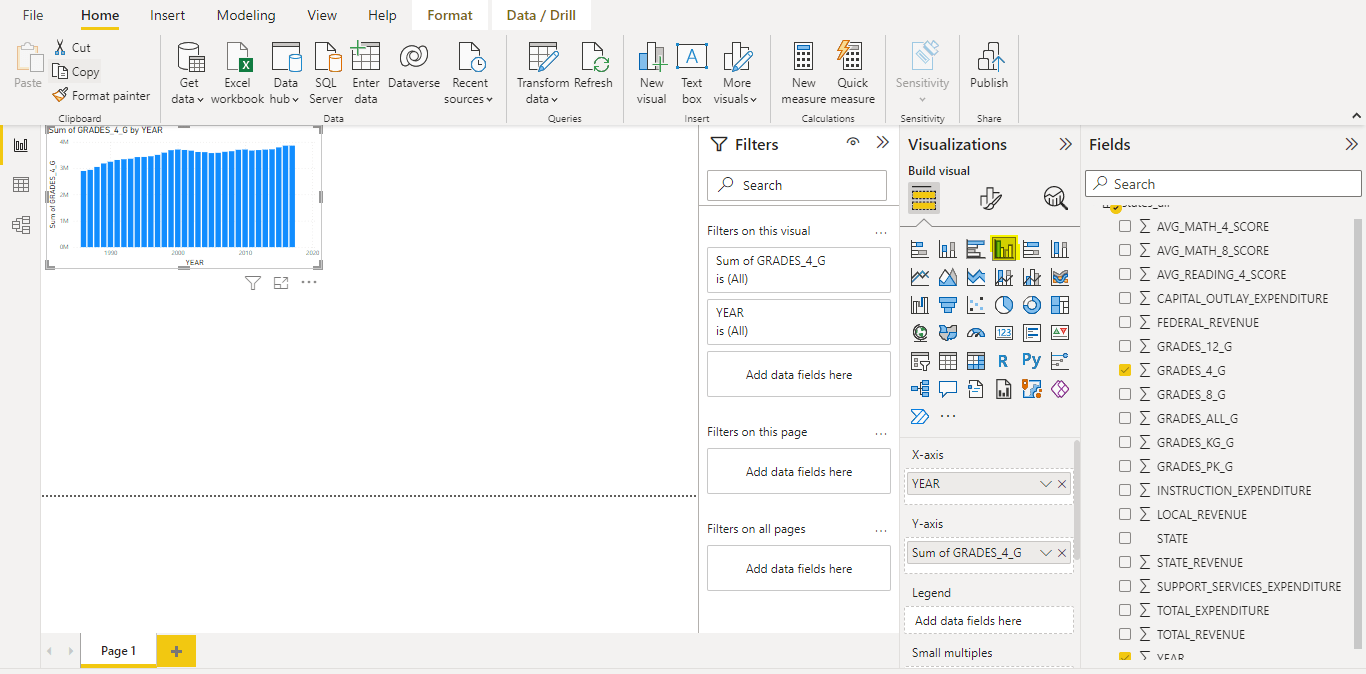
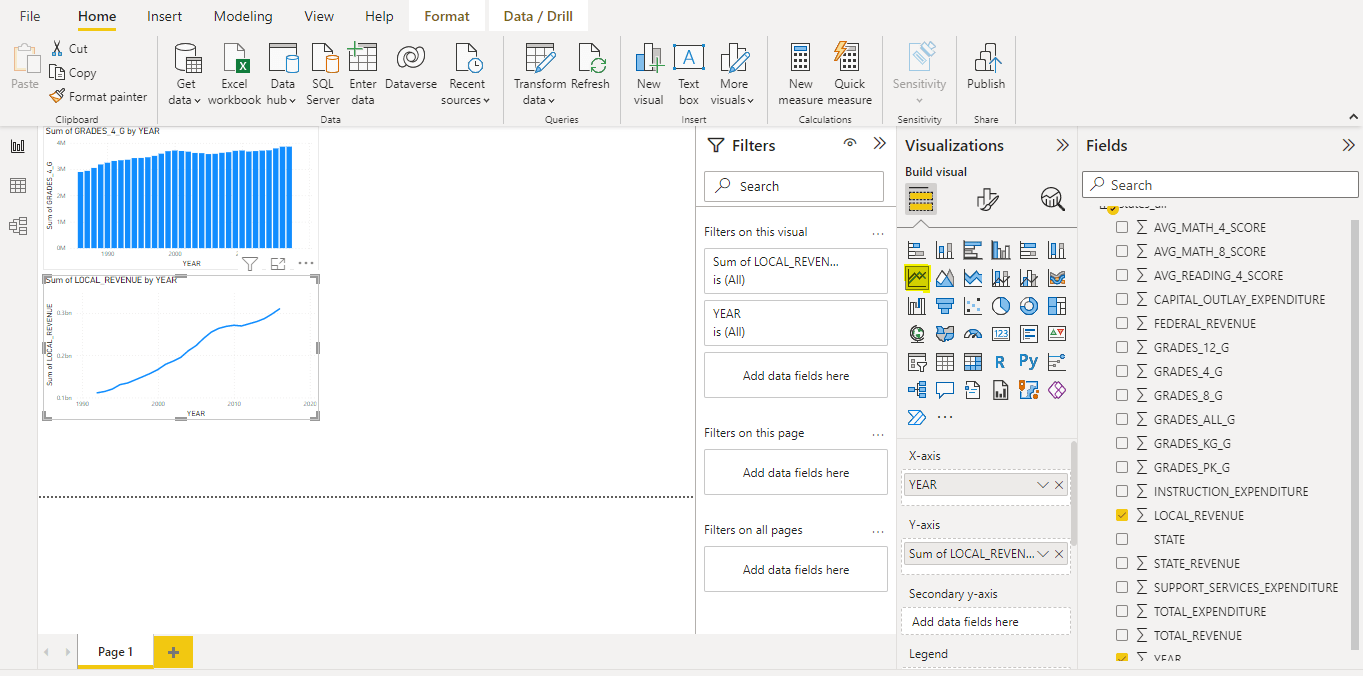
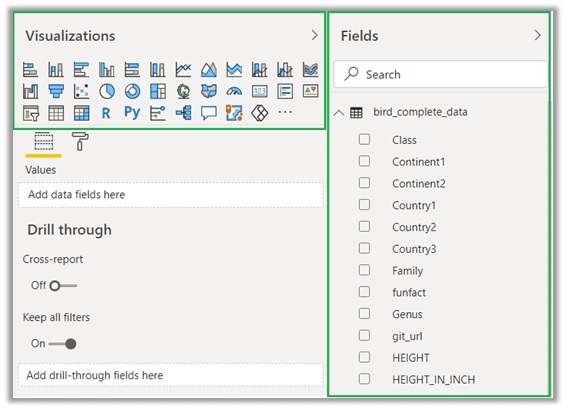
Step 3
Use Copilot to unleash the potential insights of your data.
Start by creating reports in the Power BI service/Desktop. Copilot allows the creation of insightful reports for descriptive analytics by just using the requirements that you can provide in natural language.
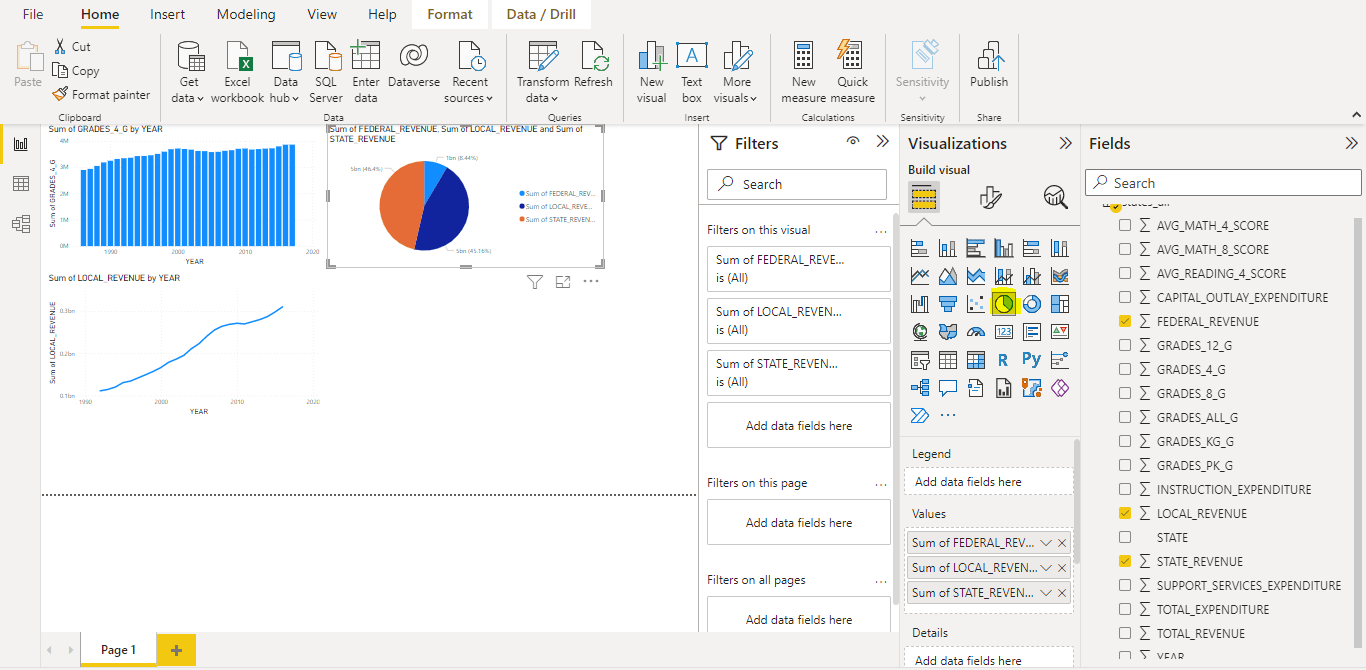
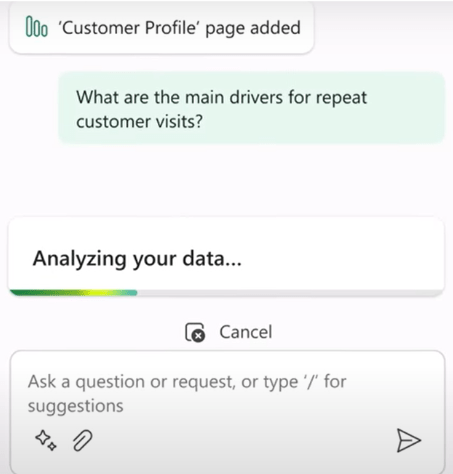
For example: Here a report is created by using the following prompt:
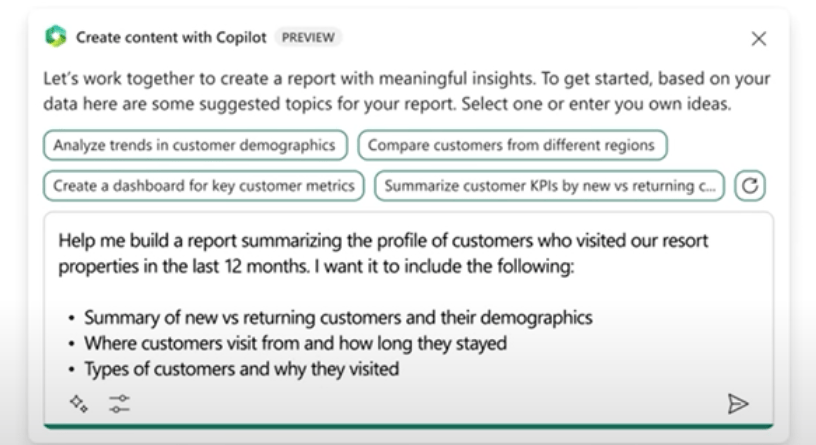
Copilot has created a report for the customer profile that includes the requested charts and slicers and is also fully interactive, providing options to conveniently adjust the outputs as needed.
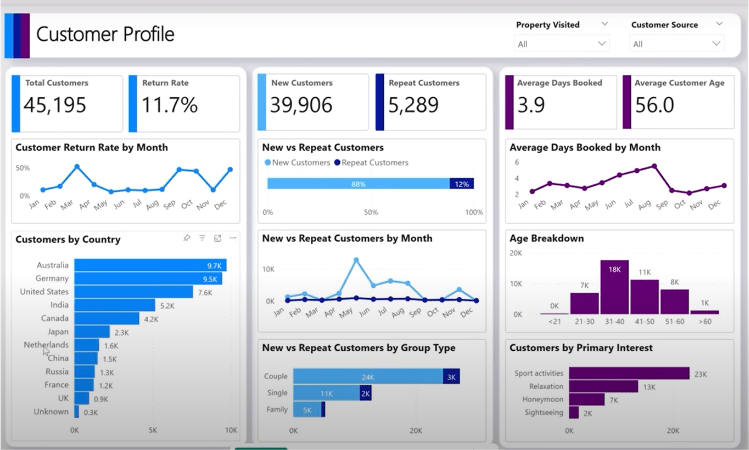
Not only this, but you can also ask analysis questions about the reports as explained below.
The copilot now responds by adding a new page to the report. It explains the ‘main drivers for repeat customer visits’ by using advanced analysis capabilities to find key influencers for variables in the data. As a result, it can be seen that the ‘Purchased Spa’ service has the biggest influence on customer returns followed ‘Rented Sports Equipment’ service.
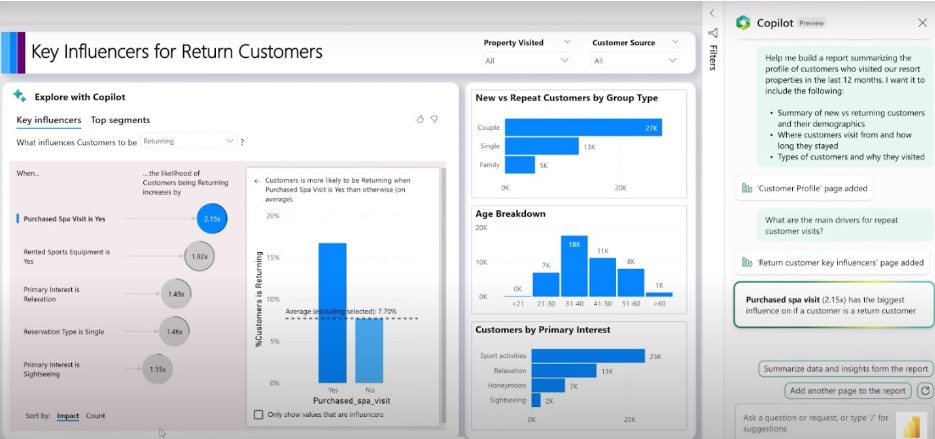
Moreover, you can ask to include, exclude, or summarize any visuals or pages in the generated reports. Other than generating reports, you can even refer to your existing dashboard to question or summarize the insights or to quickly create a narrative for any part of the report using Copilot.
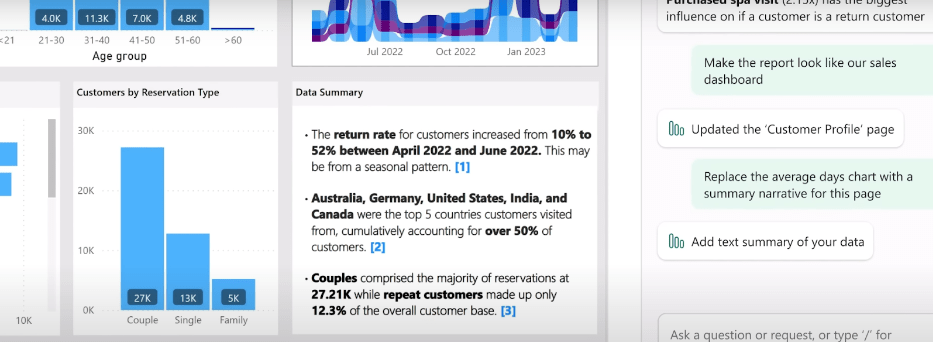
Below you can see how the Copilot has generated a fully dynamic narrative summary for the report, highlighting the useful insights from data along with proper citation from where within the report the data was taken.
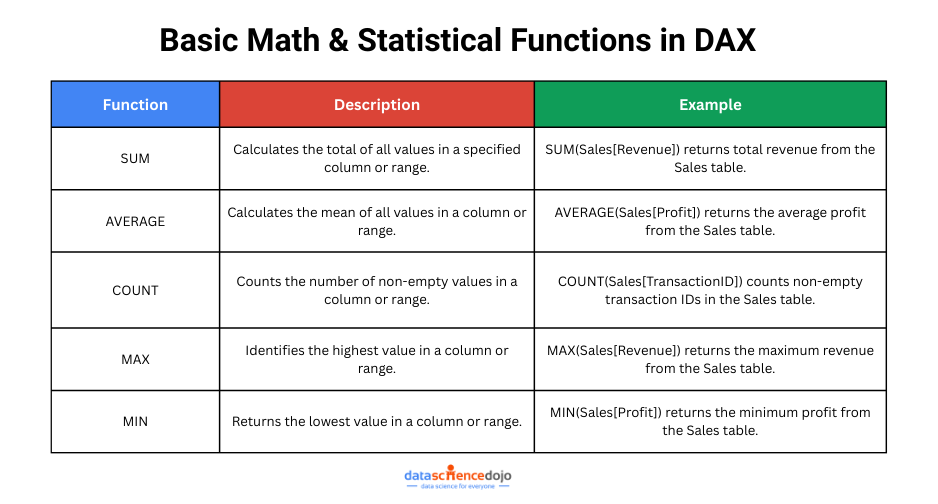
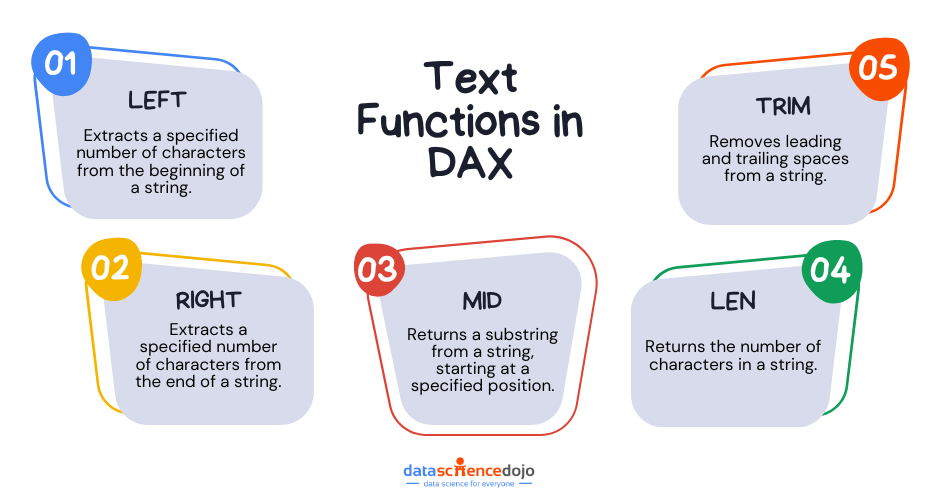
Microsoft Copilot simplifies Data Analysis Expressions (DAX) formulas by generating and editing these complex formulas. In Power BI, you can easily navigate to the ‘Quick Measure’ button in the calculations section of the Home tab. (if you do not see ‘suggestions with Copilot,’ then you may enable it from settings.
Otherwise, you may need to get it enabled by your Power BI Administrator).
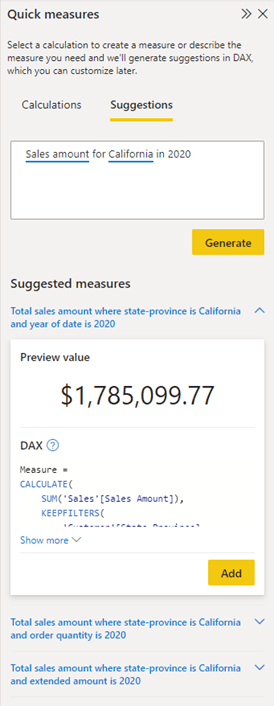
Quick measures are predefined measures, eliminating the need for creating your own DAX syntax. It’s generated automatically according to the input you provide in Natural Language via the dialog box. They execute a series of DAX commands in the background and display the outcomes for utilization in your report.
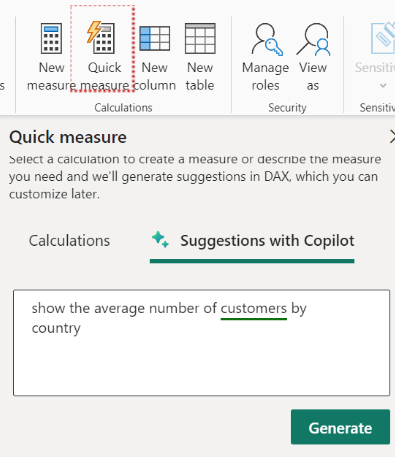
In the below example, it can be seen that the copilot gives suggestion for a quick measure based on the data, generating the DAX formula as well. If you find the suggested measure satisfactory, you can simply click the “Add” button to seamlessly incorporate it into your model.
There can be several other things that you can do with copilot with clear and understandable prompts to questions about your data and generate more insightful reports for your BI dashboards.
Hence, we can say that Power BI with Copilot has proven to be the transformative force in the landscape of data analytics, reshaping how businesses leverage their data’s potential.

Embracing the LLM-led Era in Business Intelligence
Descriptive analytics is fundamental to Business Intelligence (BI) dashboards, providing essential insights through data aggregation, visualization, trend analysis, and reporting.
The integration of Large Language Models enhances these capabilities by enabling advanced query handling, improving visualization descriptions, and reporting, and offering predictive and prescriptive insights.
This new LLM-led era in Business Intelligence (BI) is transforming the dynamic landscape of data analytics, offering a glimpse into a future where data-driven insights empower organizations to make informed decisions and gain a competitive edge.