Price as low as $4499 | Learn to build custom large language model applications

In this blog, we will look into different methods of data transformation, data exploration, and data visualization using Power BI.

Prerequisites to work with Power BI: 

  • Download Dataset 
  • Install Power BI 


Downloading Data: 

 We will use an open-source dataset available on Kaggle. This link contains several other datasets, but we will use “states_all.csv” in this blog. The link contains all the column descriptions. 

Watch this video to learn Power BI end-to-end


Moving forward, let us first see how to install it on our desktop: 


Installing Power BI: 


You can download Power BI for any OS from here. The installation is relatively easier, you can click on next for every prompt you get. After you have installed it, let us open it. 


This will be the screen you will land on after opening it. 

Power BI
Power BI


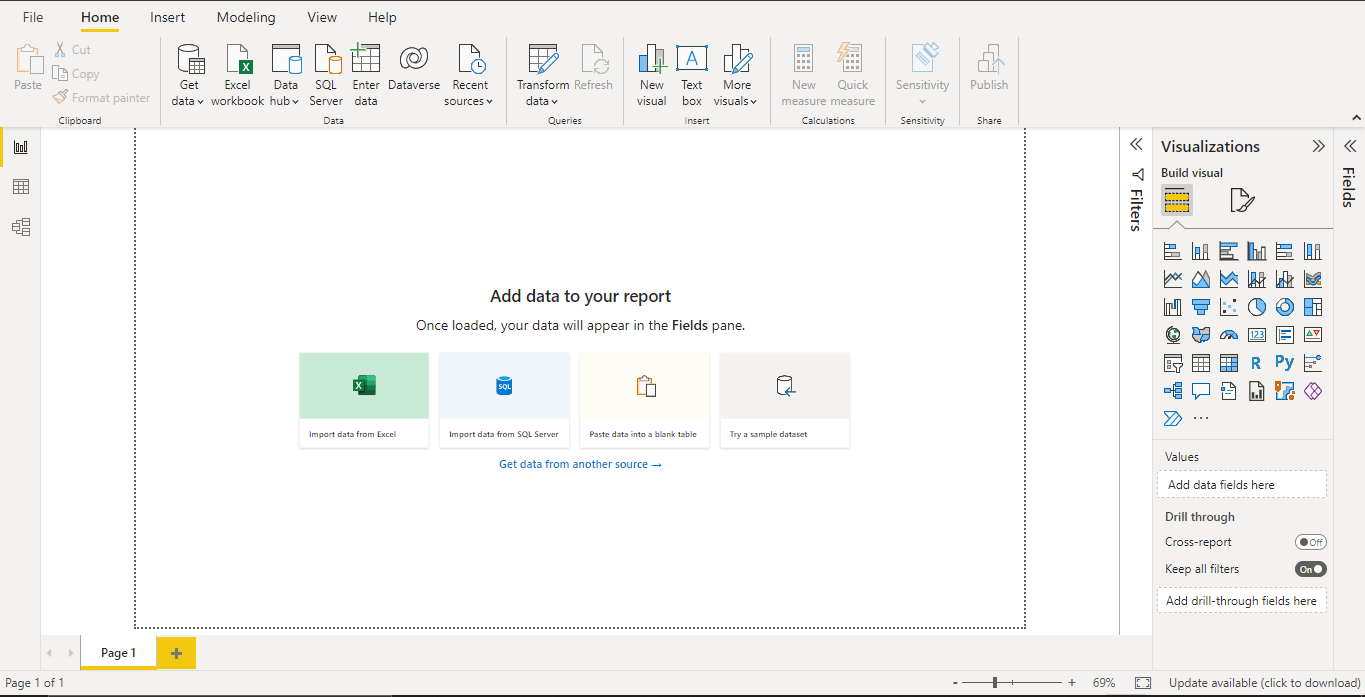
The data we have is in a CSV file so, we can use “Import data from Excel” to view it in Power BI (remember to select All Files from the file explorer). Just navigate to the file and click on open. A new screen will open which will preview the data you selected. First, we need to do some transformations on this data, for that click on Transform data at the bottom right of this screen.  

Transformation: 

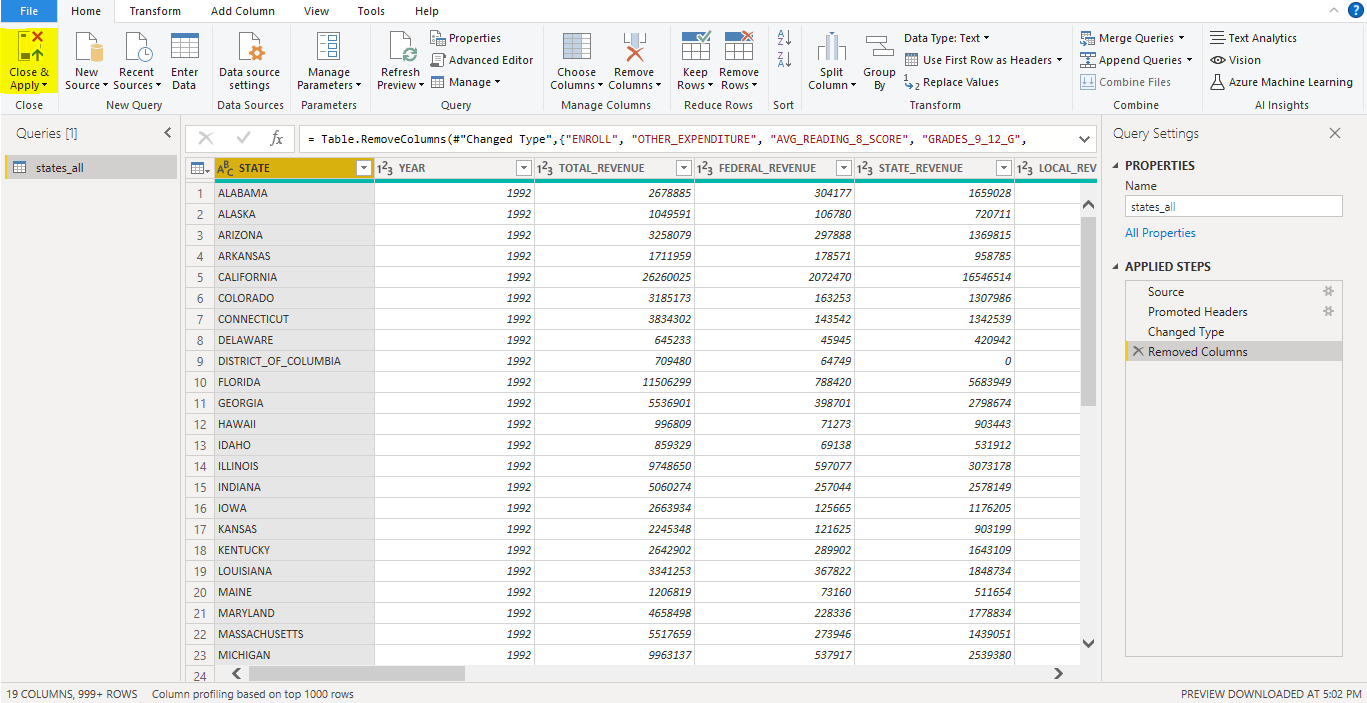
There are some columns that have null values, so we can remove them. We can do this by clicking on individual columns and then selecting Remove Columns from the upper tab. Do the same for other columns 

  • OTHER_EXPENDITURE 
  • GRADES_1_8_G 
  • GRADES_9_12_G 
  • AVG_READING_8_SCORE 

We can also remove the PRIMARY_KEY column as it is of no importance to us in the later steps.  

After doing all this, click on Close & Apply at the top left.  
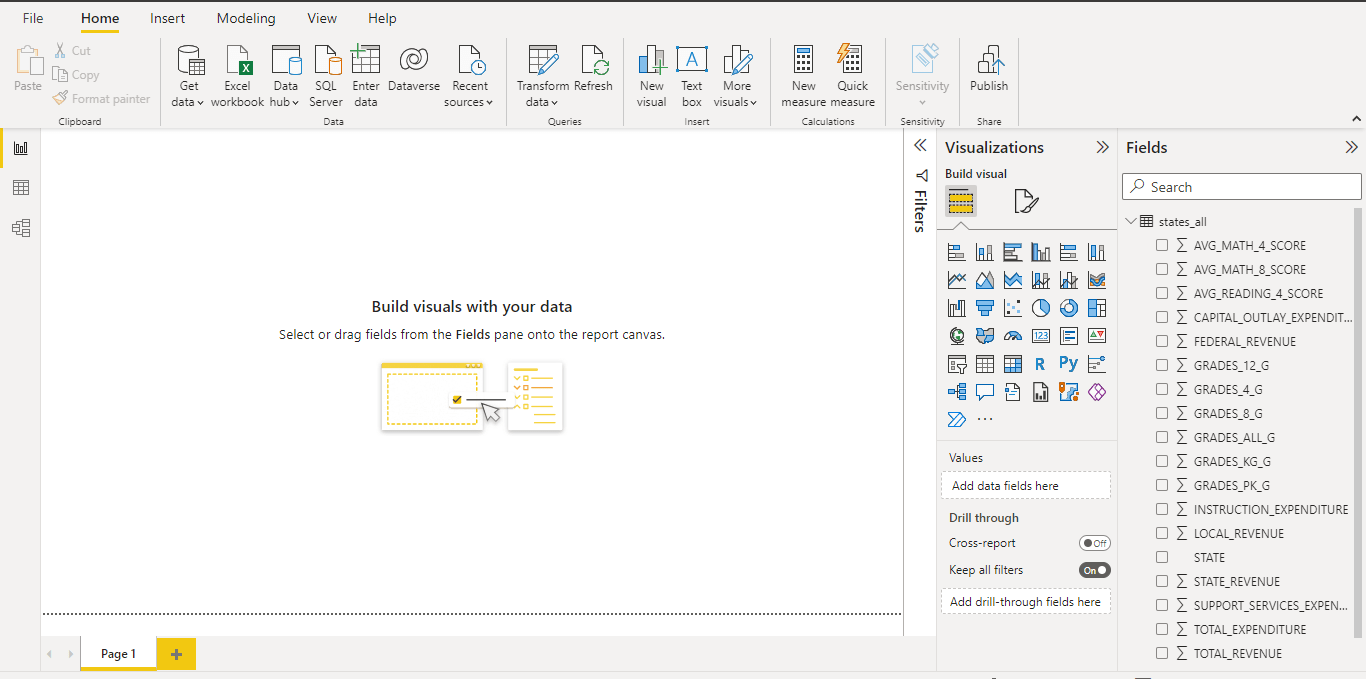
Column - Power BI
Column – Power BI


Data visualization: 

Now we are ready to visualize the data. On the right, you can see all the imported columns from the CSV file. 


Data visuals - Power BI
Data visuals – Power BI


1. Clustered column chart:


Let us create a clustered column chart to visualize 4th grade scores per year. To do this first select clustered column chart from the Visualizations pane. After that, drag down the Year column to the X-axis and GRADES_4_G to the y-axis. 

Graph - Power BI
Graph – Power BI

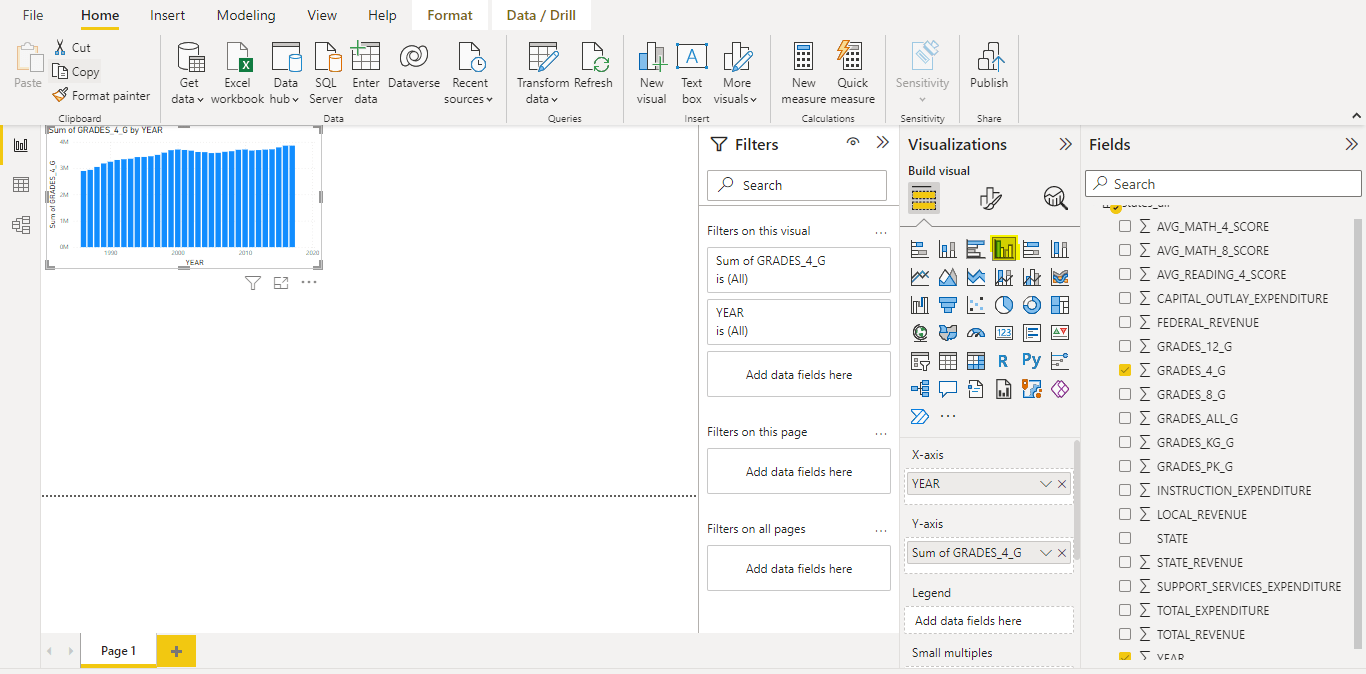
As we can see from the graph above, the sum of all the grades lies in the same range every year 


2. Line chart:


Now Let us make a line chart showing local revenue affected every year. For that, we can select a line chart from the Visualizations pane. Select Year as the x-axis and LOCAL_REVENUE as the y-axis.  

Graph, Line chart - Power BI
Graph, Line chart – Power BI

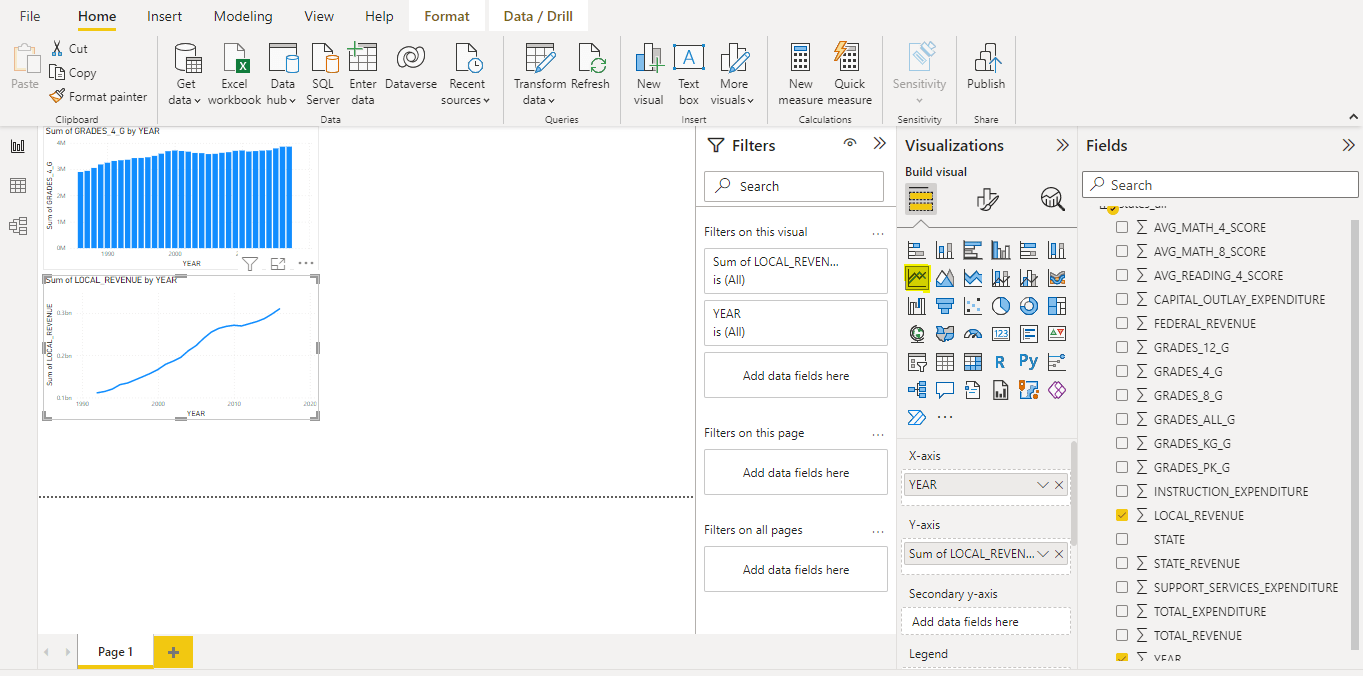
From the above graph, we can see the local revenue increasing every year 


3. Pie chart:


If we want to see the Revenue generated by each; Local, Federal, and State. We can use a Pie Chart for that. We can select Pie Chart from the pane and drag LOCAL_REVENUE, FEDERAL_REVENUE and STATE_REVENUE to the values tab. 

Pie chart - Power BI
Pie chart – Power BI

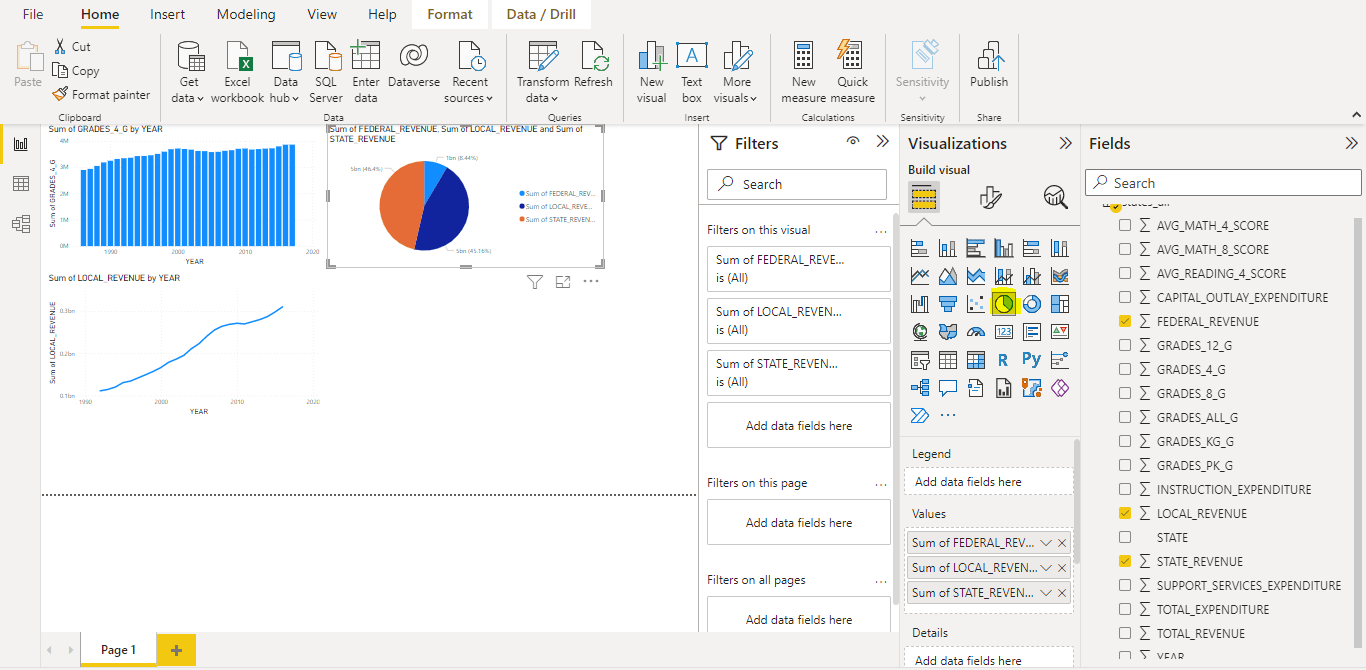
The pie chart shows the sum of different amounts of revenue  


4. Area chart:


At last, we can compare any two grades to see their revenue changes during the past years. For this purpose, we can use the Area Chart from the visualizations pane and use GRADES_4_G as the y-axis and GRADES_12_G as the secondary y-axis. Drag YEAR to the x-axis.  

Pie chart - Power BI
Pie chart – Power BI

The Area chart shows the difference in grades of class 4 and 12 on top of each other. 

Finally, we have this report to showcase to our colleagues or friends. 


Conclusion: 

In this blog, we saw how to use the tool for data transformation and what are some different graphs we can use to visualize academic data. Learn more about Power BI in the course offered by Data Science Dojo and enable yourself to emulate these learnings at work. 

register button


In this blog, we will be learning how to program some basic movements in a drone with the help of Python. The drone we will use is Dji Tello. We will learn drone programming with Scratch, Swift, and even Python.  

 A step-by-step guide to learning drone programming

We will go step by step through how to issue commands through the Wi-Fi network 

drone programming
Drone – Data Science Dojo


Installing Python libraries 

First, we will need some Python libraries installed onto our laptop. Let’s install them with the following two commands: 


pip install djitellopy 

pip install opencv-python 


The djitellopy is a python library making use of the official Tello sdk. The second command is to install opencv which will help us to look through the camera of the drone. Some other libraries this program will make use of are ‘keyboard’ and ‘time’. After installation, we import them into our project   


import keyboard as kp 

from djitellopy import tello 

import time 

import cv2 


 Read more about Machine Learning using Python in cloud

Connection

We must first instantiate the Tello class so we can use it afterward. For the following commands to work, we must switch the drone to On and find and connect to the Wi-Fi network generated by it on our laptop. The tel.connect() command lets us connect the drone to our program. After the connection of the drone to our laptop is successful, the following commands can be executed. 


tel = tello.Tello() 
tel.connect() 


Sending ending commands to the drone 

We will build a function which will send movement commands to the drone.  

def getKeyboardInput(img): 

    kp.init() 

    lr, fb, ud, yv = 0, 0, 0, 0 

    speed = 50 

    if kp.getKey("LEFT"): 

        lr = -speed 

    elif kp.getKey("RIGHT"): 

        lr = speed 


    if kp.getKey("UP"): 

        fb = speed 

    elif kp.getKey("DOWN"): 

        fb = -speed 


    if kp.getKey("w"): 

        ud = speed 

    elif kp.getKey("s"): 

        ud = -speed 


    if kp.getKey("a"): 

        yv = speed 

    elif kp.getKey("d"): 

        yv = -speed 


    if kp.getKey("l"): 

        tel.land() 

    if kp.getKey("t"): 

        tel.takeoff() 


    if kp.getKey("z"): 

        cv2.imwrite("Resources/images/{time.time}.jpg", img) 

        time.sleep(0.05) 

    return [lr, fb, ud, yv] 

tel.streamon() 


The drone takes 4 inputs to move so we first take four values and assign a 0 to them. The speed must be set to an initial value for the drone to take off. Now we map the keyboard keys to our desired values and assign those values to the four variables. For example, if the keyboard key is “LEFT” then assign the speed with a value of -50. If the “RIGHT” key is pressed, then assign a value of 50 to the speed variable, and so on. The code block below explains how to map the keyboard keys to the variables: 

if kp.getKey("LEFT"): 

        lr = -speed 

    elif kp.getKey("RIGHT"): 

        lr = speed 


This program also takes two extra keys for landing and taking off (l and t). A keyboard key “z” is also assigned if we want to take a picture from the drone. As the drone’s video will be on, whenever we click on “z” key, opencv will save the image in a folder specified by us. After providing all the combinations, we must return the values in a 1D array. Also, don’t forget to run tel.streamon() to turn on the video streaming.     

We must make the drone take commands until and unless we press the “l” key for landing. So, we have a while True loop in the following code segment: 


Calling the function


while True: 

    img = tel.get_frame_read().frame 

    img = cv2.resize(img,(360,360)) 

    cv2.imshow('Picture',img) 

    cv2.waitKey(1) 
 
    vals = getKeyboardInput(img) 

    tel.send_rc_control(vals[0],vals[1],vals[2],vals[3]) 

    time.sleep(0.05) 


The get_frame_read() function reads the video frame by frame (just like an image) so we can resize it and show it on the laptop screen. The process will be so fast that it will completely look like a video being displayed.  

The last thing we must do is to call the function we created above. Remember, we have a list being returned from it. Each value of the list must be sent as a separate index value to the send_rc_control method of the tel object 


Execution 


Before running the code, confirm that the laptop is connected to the drone via Wi-Fi. 

Now, execute the python file and then press “t” for the drone to take off. From there, you can press the keyboard keys for it to move in your desired direction. When you want the drone to take pictures, press “z” and when you want it to land, press “l” 


Conclusion


In this blog, we learned how to issue basic keyboard commands for the drone to move. Furthermore, we can also add more keys for inbuilt Tello functions like “flip” and “move away”. Videos can be captured from the drone and stored locally on our laptop 

Data science is an interdisciplinary field that encompasses the scientific processes used to build predictive models. In turn, enabling data science to kickstart business decision-making through interpreting, modeling, and deployment.  

Data science start
Data science lifecycle steps


Now what is Data Science? 

Data science is a combination of various tools and algorithms which are used to discover hidden patterns within raw data. Data science career is different from other techniques in the way that it enables the predictive capabilities of data. A Data Analyst mainly focuses on the visualizations and the history of the data whereas a Data Scientist not only works on the exploratory analysis but also works on extracting useful insights using several kinds of machine learning algorithms.  


Why do we need Data Science? 

Some time ago, there were only a few sources from which data came. Also, the data then was much smaller in size, hence, we could easily make use of simple tools to identify trends and analyze them. Today, data comes from many sources and has mostly become unstructured so it cannot be so easily analyzed. The data sources can be sensors, social media, sales, marketing, and much more. With this, we need techniques to gain useful insights so companies can make a positive impact, take bold steps, and achieve more.   


Who is a data scientist? 

Data scientists are professionals who use a variety of specialized tools and programs that are specifically designed for data cleaning, analysis and modelling. Amongst the numerous tools, the most widely used is Python, as cited by data scientists themselves.  

There is also a huge variety of secondary tools like SQL and Tableau. This contradicts the conventional understanding that becoming a data scientist takes years and years of experience and training. Additional skills and knowledge can provide them with exposure to programming languages or other related technology. 

While there are various statistical programming languages, R and Python are amongst the most renowned data science programming languages. R is purpose built for data mining and analysis. Contrastingly, Python is a general-purpose programming language which also caters to data analysis operations.   

Data scientists must have a set of data preparation, data mining, predictive modeling, machine learning, statistical analysis, and mathematics skills. Along with that, they must also have experience with coding and algorithms. They are also required to create data visualizations, reports and dashboards to illustrate analytical findings. 

Prepare for your data science interview with this blog

Data science lifecycle 

Any project starts with a problem statement and Data Science helps us to solve this problem statement with a series of well-designed steps. The steps being:  

  1. Data Discovery  
  1. Data Preparation  
  1. Model Planning  
  1. Model Building  
  1. Communicate results  
  1. Operationalize  


1. Data discovery 

First, we need to identify the source of data. The data can come from a file, a database, scrapers or even real time streaming tools. Nowadays, there is Big Data which just simply refers to the four V’s:  

Volume: Data in terabytes  

Velocity: Streaming data with high throughput  

Variety:Structured, semi-structured, and unstructured data  

Veracity:quality of the data  


2. Data preparation 

In this part, Data Scientists understand the data and get to know if this is the right one which solves the problem. There are several cleaning steps in this phase such as getting the data into a required structure, removing unwanted columns. This is the most time-consuming and the most important step in this lifecycle.   

Participate in Data Science competitions to improve your skills

5 data science competitions to uplift your analytical skills

3. Model planning 

Next, Data Scientists identify relationships between different variables which will then be used in the next step of building the algorithm. Data Scientists use Exploratory Data Analysis to achieve this milestone. EDA helps in gaining insights about the nature of the data. 


4. Model building 

In this step, datasets are prepared for the training and testing phase. There are several techniques in model building such as classification, association, and clustering. Several tools are available to build a model:  

  • SAS Enterprise Miner  
  • Matlab  
  • Statistica  


5. Communicate results 

In this step data scientists report and document all the findings about the project. The results must be communicated to the stakeholders in order to decide whether to go onto the next step or not. This step decides if the project will be operationalized or stopped.  


6. Kickstart and operationalize 

Lastly, Data Scientists deploy the project for the users to use it. Before this there may be a phase of a pilot project deployment which will get the basic insights on the performance and the issues. If that phase is cleared, then the project is ready to move to the full deployment phase. 


This was all about how you can kickstart your learning about Data Science skills. For a more in-depth understanding; 

You can watch our beginners friendly YouTube playlist on Data Science:  

You can also attend this tailor made Data Science bootcamp if you are an absolute beginner: