

Data is an essential component of any business, and it is the role of a data analyst to make sense of it all. Power BI is a powerful data visualization tool that helps them turn raw data into meaningful insights and actionable decisions.
In this blog, we will explore the role of data analysts and how they use Power BI to extract insights from data and drive business success. From data discovery and cleaning to report creation and sharing, we will delve into the key steps that can be taken to turn data into decisions.
A data analyst is a professional who uses data to inform business decisions. They process and analyze large sets of data to identify trends, patterns, and insights that can help organizations make more informed decisions.
Who is a data analyst?
A data analyst is a professional who works with data to extract insights, draw conclusions, and support decision-making. They use a variety of tools and techniques to clean, transform, visualize, and analyze data to understand patterns, relationships, and trends. The role of a data analyst is to turn raw data into actionable information that can inform and drive business strategy.
They use various tools and techniques to extract insights from data, such as statistical analysis, and data visualization. They may also work with databases and programming languages such as SQL and Python to manipulate and extract data.
The importance of data analysts in an organization is that they help organizations make data-driven decisions. By analyzing data, analysts can identify new opportunities, optimize processes, and improve overall performance. They also help organizations make more informed decisions by providing insights into customer behavior, market trends, and other key metrics.
Additionally, their role and job can help organizations stay competitive by identifying areas where they may be lagging and providing recommendations for improvement.
Defining Power BI
Power BI provides a suite of data visualization and analysis tools to help organizations turn data into actionable insights. It allows users to connect to a variety of data sources, perform data preparation and transformations, create interactive visualizations, and share insights with others.
Check out this course and learn Power BI today!
The platform includes features such as data modeling, data discovery, data analysis, and interactive dashboards. It enables organizations to quickly create and share visualizations, reports, and dashboards with stakeholders, regardless of their technical skill level.
Power BI also provides collaboration features, allowing team members to work together on data insights, and share information and insights with others through Power BI reports and dashboards.
Key capabilities of Power BI
Data Connectivity:It allows users to connect to various data sources including Excel, SQL Server, Azure SQL, and other cloud-based data sources.
Data Transformation: It provides a wide range of data transformation tools that allow users to clean, shape, and prepare data for analysis.
Visualization: It offers a wide range of visualization options, including charts, tables, and maps, that allow users to create interactive and visually appealing reports.
Sharing and Collaboration: It allows users to share and collaborate on reports and visualizations with others in their organization.
Mobile Access: It also offers mobile apps for iOS and Android, that allow users to access and interact with their data on the go.
How does a data analyst use Power BI?
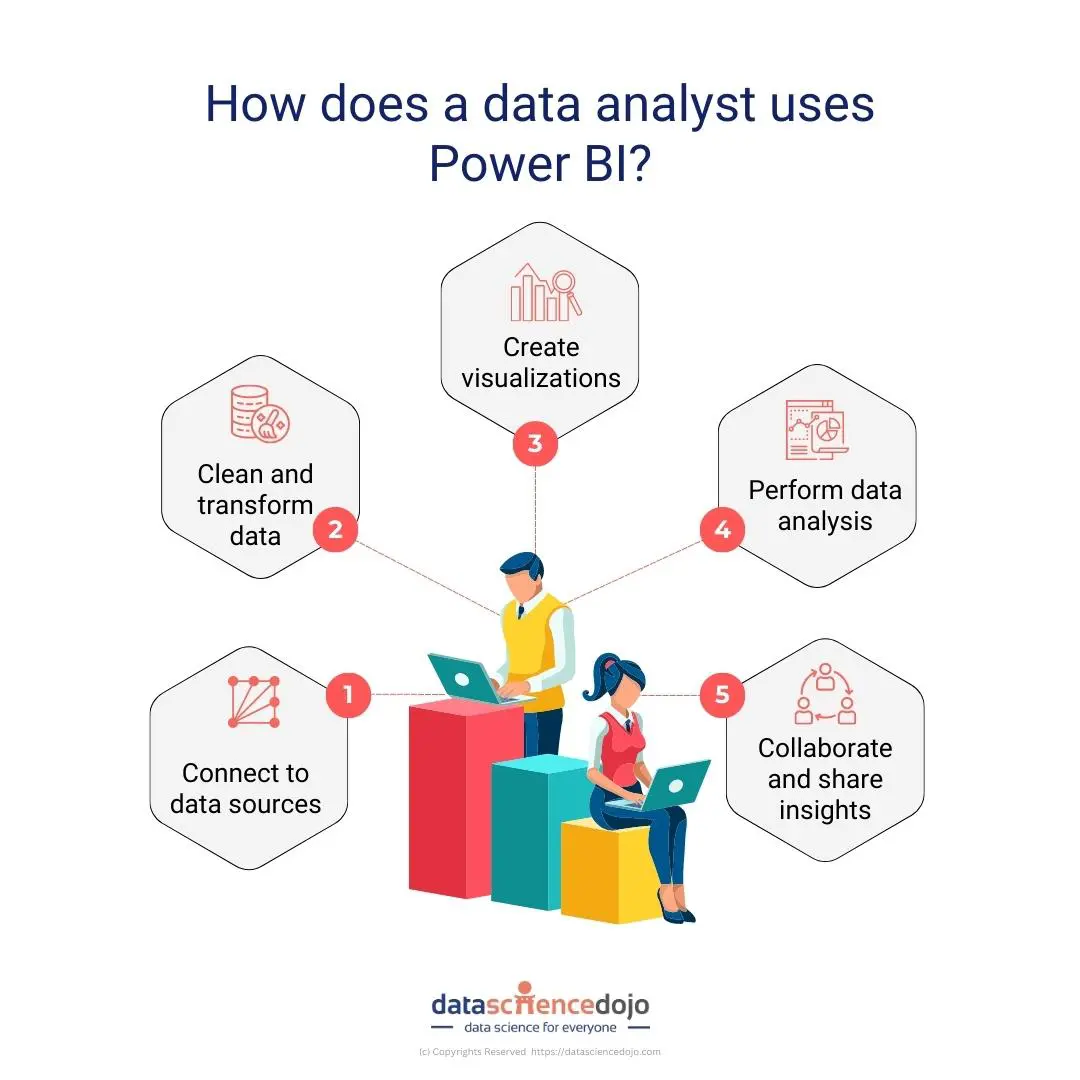
A data analyst uses Power BI to collect, clean, transform, visualize, and analyze data to turn it into meaningful insights and decisions. The following steps outline the process of using Power BI for data analysis:
- Connect to data sources: A data analyst can import data from a variety of sources, such as spreadsheets, databases, or cloud-based services. Power BI provides several ways to import data, including manual upload, data connections, and direct connections to data sources.
- Clean and transform data: Before data can be analyzed, it often needs to be cleaned and prepared. This may include removing any extraneous information, correcting errors or inconsistencies, and transforming data into a format that is usable for analysis.
- Create visualizations: Once the data has been prepared, a data analyst can use Power BI to create visualizations of the data. This may include bar charts, line graphs, pie charts, scatter plots, and more. Power BI provides a few built-in visualizations and the ability to create custom visualizations, giving data analysts a wide range of options for presenting data.
- Perform data analysis: Power BI provides a range of data analysis tools, including calculated fields and measures, and the DAX language, which allows data analysts to perform more advanced analysis. These tools allow them to uncover insights and trends that might not be immediately apparent.
- Collaborate and share insights: Once insights have been uncovered, data analysts can share their findings with others through Power BI reports or dashboards. These reports provide a way to present data visualizations and analysis results to stakeholders and can be published and shared with others.
Learn Power BI with this crash course in no time!
By following these steps, a data analyst can use Power BI to turn raw data into meaningful insights and decisions that can inform business strategy and decision-making.
Why should you use data analytics with Power BI?
User-friendly interface – Power BI has a user-friendly interface, which makes it easy for users with little to no technical skills to create and share interactive dashboards, reports, and visualizations.
Real-time data visualization – It provides real-time data visualization, allowing users to analyze data in real time and make quick decisions.
Integration with other Microsoft tools – Power BI integrates seamlessly with other Microsoft tools, such as Excel, SharePoint, and Azure, making it an ideal tool for organizations using Microsoft technology.
Wide range of data sources – It can connect to a wide range of data sources, including databases, spreadsheets, cloud services, and web APIs, making it easy to consolidate data from multiple sources.
Cost-effective – It is a cost-effective solution for data analytics, with both free and paid versions available, making it accessible to organizations of all sizes.
Mobile accessibility – Power BI provides mobile accessibility, allowing users to access and analyze data from anywhere, on any device.
Collaboration features – With robust collaboration features, it allows users to share dashboards and reports with other team members, encouraging teamwork and decision-making.
Conclusion
In conclusion, Power BI is a powerful tool for data analysis that provides organizations with the ability to easily visualize, analyze, and share complex data. By preparing, cleaning, and transforming data, creating relationships between tables, using visualizations and DAX, they can create reports and dashboards that provide valuable insights into key business metrics.
The ability to publish reports, share insights, and collaborate with others makes Power BI an essential tool for any organization looking to improve performance and make informed decisions.