fbpx
Learn to build large language model applications: vector databases, langchain, fine tuning and prompt engineering. Learn more

data analyst

Ruhma Khawaja author
Ruhma Khawaja
| May 10

Navigating the realm of data science careers is no longer a tedious task. In the current landscape, data science has emerged as the lifeblood of organizations seeking to gain a competitive edge. As the volume and complexity of data continue to surge, the demand for skilled professionals who can derive meaningful insights from this wealth of information has skyrocketed.

Enter the realm of data science careers—a domain that harnesses the power of advanced analytics, cutting-edge technologies, and domain expertise to unravel the untapped potential hidden within data.

Importance of data science in today’s world 

Data science is being used to solve complex problems, improve decision-making, and drive innovation in various fields. It has transformed the way organizations operate and compete, allowing them to make data-driven decisions that improve efficiency, productivity, and profitability. Moreover, the insights and knowledge extracted from data science are used to solve some of the world’s most pressing problems, including healthcare, climate change, and global inequality. 
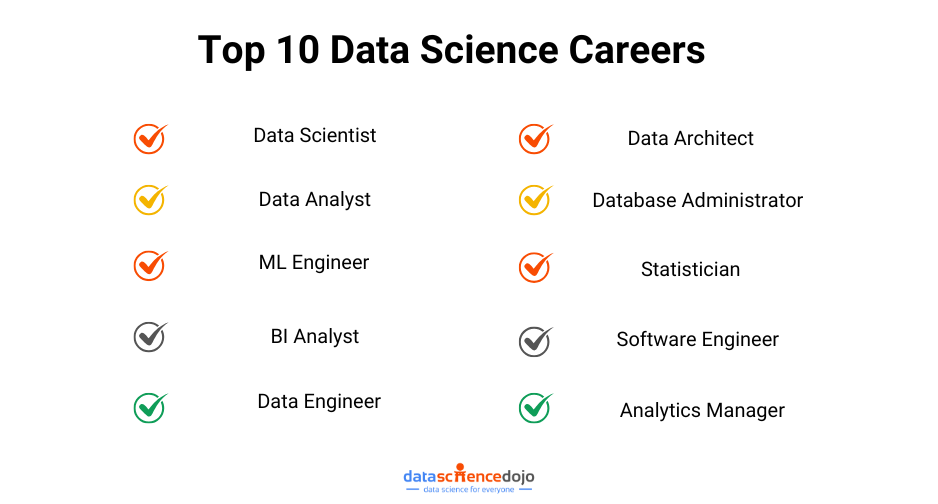
Revolutionize your future: Exploring the top 10 data science careers for 2023
Keeping up with top 10 data science careers for 2023 – Data Science Dojo

Top 10 Data Science careers: 

Below, we provide a list of the top data science careers along with their corresponding salary ranges:
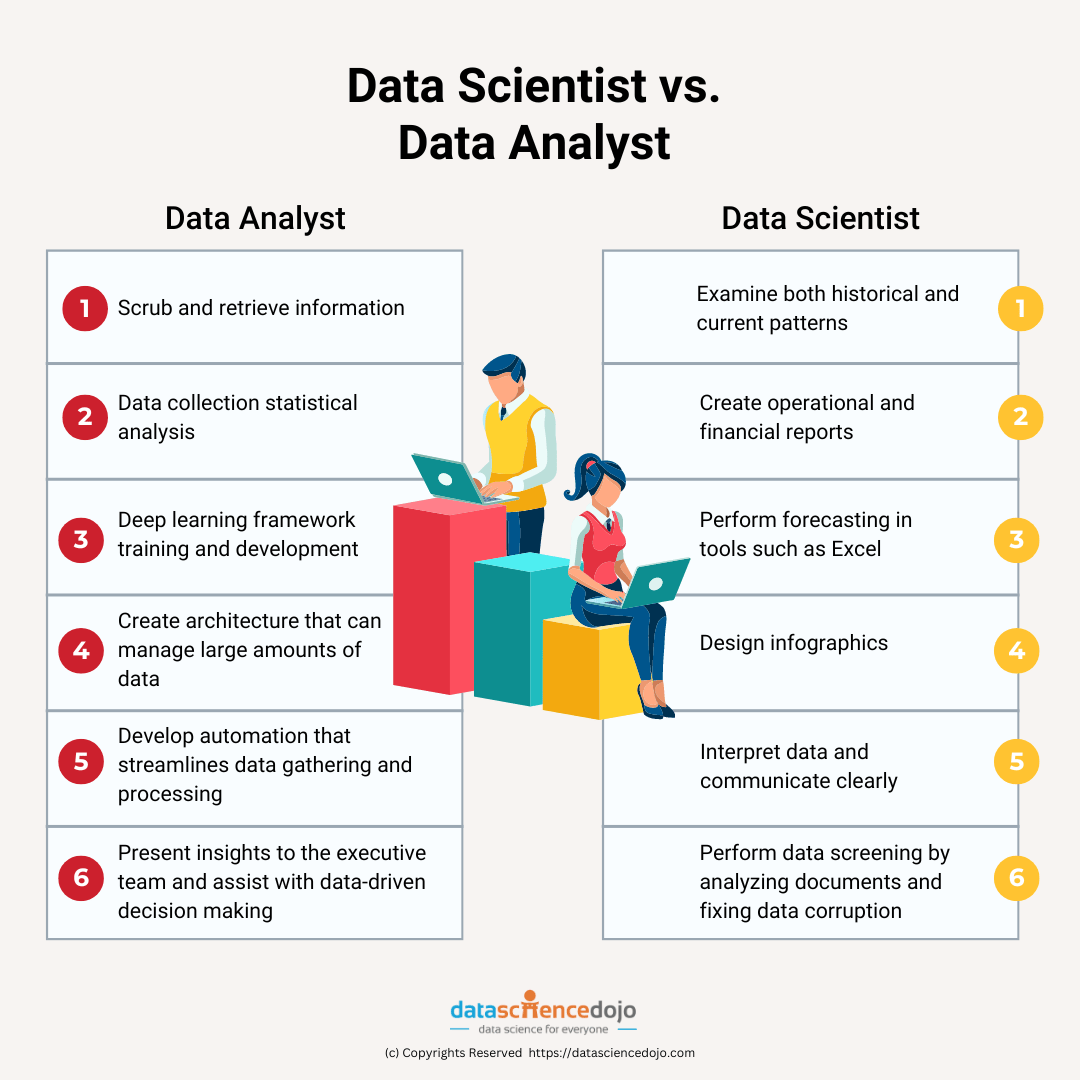
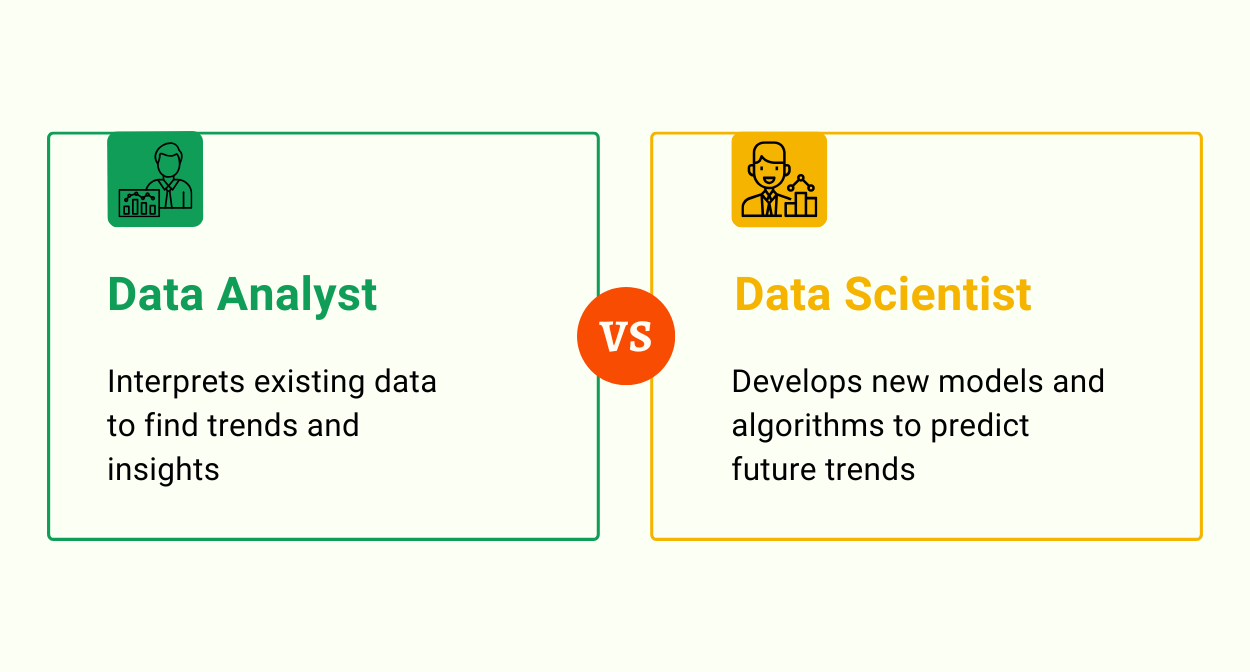
1. Data Scientist

Data scientists are responsible for designing and implementing data models, analyzing and interpreting data, and communicating insights to stakeholders. They require strong programming skills, knowledge of statistical analysis, and expertise in machine learning. 

Salary Trends – The average salary for data scientists ranges from $100,000 to $150,000 per year, with senior-level positions earning even higher salaries.

Read the most common Data Science interview questions and succeed as a data scientist today
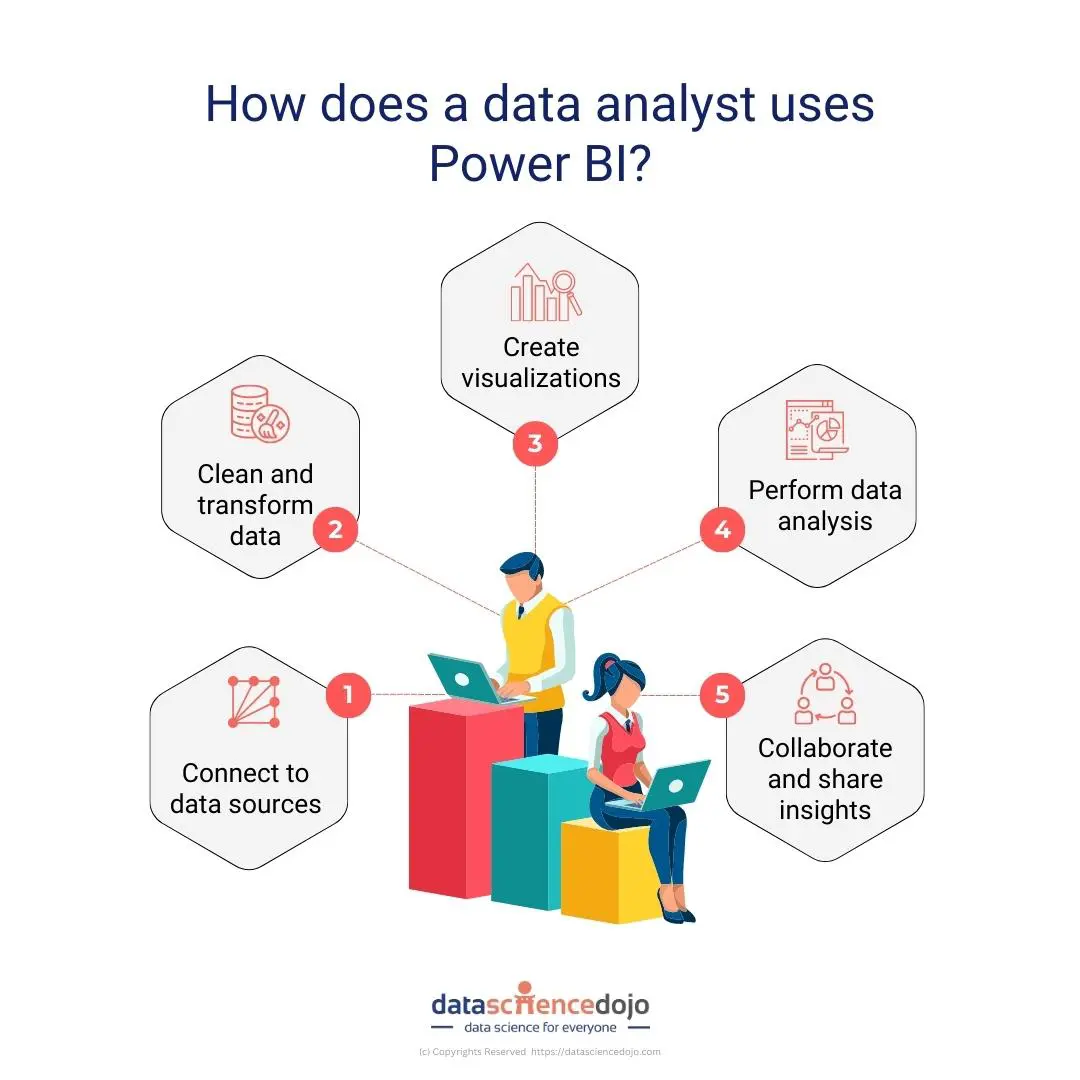
2. Data Analyst

Data analysts are responsible for collecting, analyzing, and interpreting large sets of data to identify patterns and trends. They require strong analytical skills, knowledge of statistical analysis, and expertise in data visualization. 

Salary Trends – Data analysts can expect an average salary range of $60,000 to $90,000 per year, depending on experience and industry.

3. Machine Learning Engineer

Machine learning engineers are responsible for designing and building machine learning systems. They require strong programming skills, expertise in machine learning algorithms, and knowledge of data processing. 

Salary Trends – Salaries for machine learning engineers typically range from $100,000 to $150,000 per year, with highly experienced professionals earning salaries exceeding $200,000.

4. Business Intelligence Analyst

Business intelligence analysts are responsible for gathering and analyzing data to drive strategic decision-making. They require strong analytical skills, knowledge of data modeling, and expertise in business intelligence tools. 

Salary Trends – The average salary for business intelligence analysts falls within the range of $70,000 to $100,000 per year.

5. Data Engineer

Data engineers are responsible for building, maintaining, and optimizing data infrastructures. They require strong programming skills, expertise in data processing, and knowledge of database management. 

Salary Trends – Data engineers can earn salaries ranging from $90,000 to $130,000 per year, depending on their experience and the location of the job.

6. Data Architect

Data architects are responsible for designing and implementing data architectures that support business objectives. They require strong database management skills, expertise in data modeling, and knowledge of database design. 

Salary Trends – The average salary for data architects is between $100,000 and $150,000 per year, although experienced professionals can earn higher salaries.

7. Database Administrator

Database administrators are responsible for managing and maintaining databases, ensuring their security and integrity. They require strong database management skills, expertise in data modeling, and knowledge of database design. 

Salary Trends – Salaries for database administrators typically range from $80,000 to $120,000 per year, with variations based on experience and location.

8. Statistician

Statisticians are responsible for designing and conducting experiments to collect data, analyzing and interpreting data, and communicating insights to stakeholders. They require strong statistical skills, knowledge of statistical analysis, and expertise in data visualization. 

Salary Trends – Statisticians can earn salaries ranging from $70,000 to $120,000 per year, depending on their experience and the industry they work in.

9. Software Engineer

Software engineering is a closely related discipline to data science, although software engineers focus primarily on designing, developing, and maintaining software applications and systems. In the context of data science, software engineers play a crucial role in creating robust and efficient software tools that facilitate data scientists’ work. They collaborate with data scientists to ensure that the software meets their needs and supports their data analysis and modeling tasks. Additionally, data scientists who possess a knack for creating data models and have a strong software engineering background may transition into software engineering roles within the data science field.

Salary Trends – The salary range for software engineers working in the data science field is similar to that of data scientists, with average salaries falling between $100,000 and $150,000 per year.

10. Analytics Manager

Analytics managers are responsible for leading data science teams, setting objectives and priorities, and communicating insights to stakeholders. They require strong leadership skills, knowledge of data modeling, and expertise in data visualization. 

Salary Trends –  Salaries for analytics managers vary significantly based on the size and location of the company, but the average range is typically between $100,000 and $150,000 per year, with some senior-level positions earning higher salaries.

Essential skills for success in the data science workforce

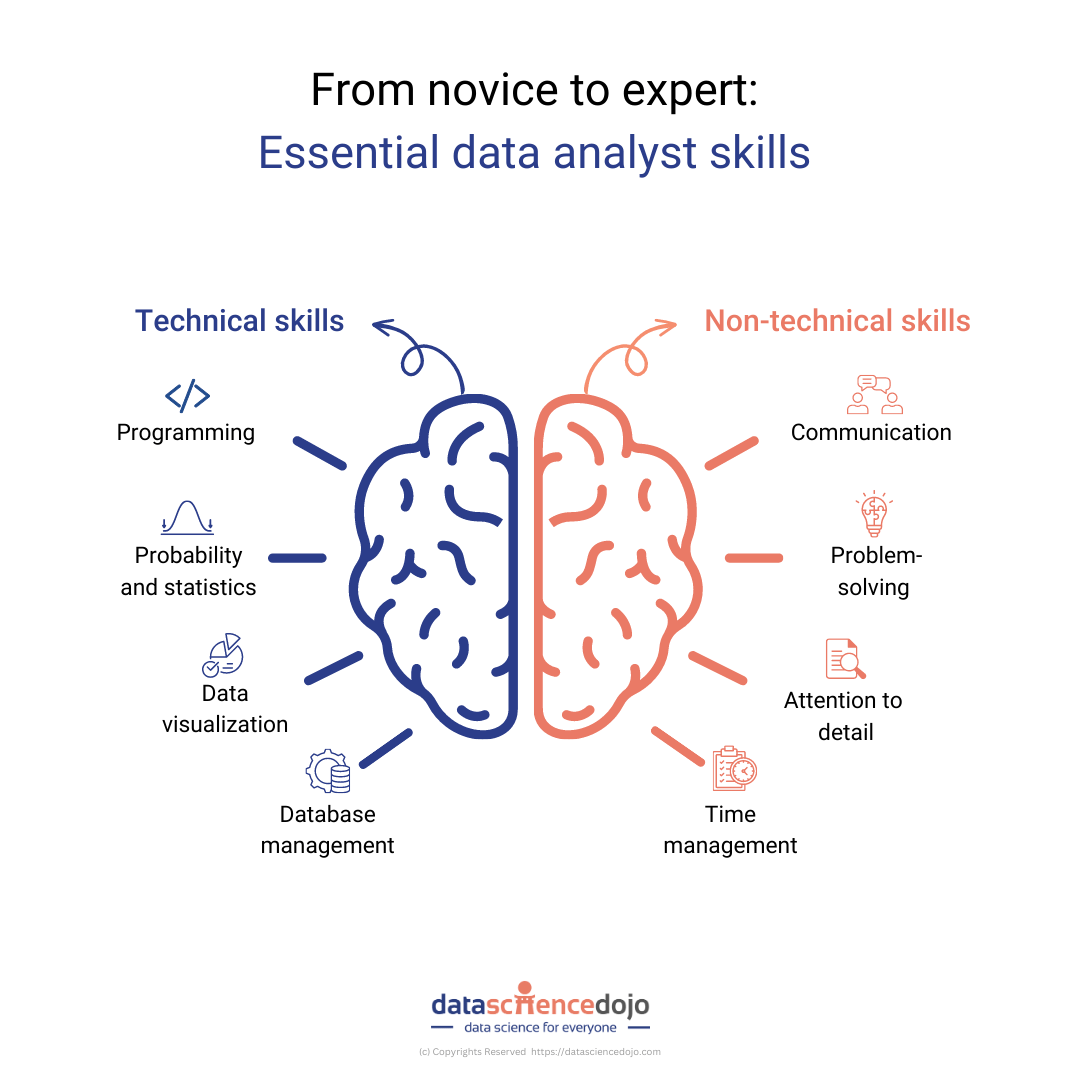
Data science careers demand a unique combination of technical acumen, analytical prowess, and domain expertise. To embark on a successful career in data science, aspiring professionals must cultivate a robust skillset and acquire the necessary qualifications to navigate the intricacies of this rapidly evolving domain. Here, we outline the essential skills and qualifications that pave way for data science careers:

Proficiency in Programming Languages – Mastery of programming languages such as Python, R, and SQL forms the foundation of a data scientist’s toolkit.

Statistical analysis and mathematics – Strong analytical skills, coupled with a solid understanding of statistical concepts and mathematics, are essential for extracting insights from complex datasets.

Machine learning and data mining – A deep understanding of machine learning algorithms and data mining techniques equips professionals to develop predictive models, identify patterns, and derive actionable insights from diverse datasets.

Data Wrangling and manipulation –  Skills in data extraction, transformation, and loading (ETL), as well as data preprocessing techniques, empower data scientists to handle missing values, handle outliers, and harmonize disparate data sources.

Domain knowledge – Understanding the nuances and context of the industry allows professionals to ask relevant questions, identify meaningful variables, and generate actionable insights that drive business outcomes.

Data visualization and communication – Proficiency in data visualization tools and techniques, coupled with strong storytelling capabilities, enables professionals to convey findings in a compelling and easily understandable manner to both technical and non-technical stakeholders.

Sneak-peek into the future – Future trends and more 

In conclusion, the field of data science is constantly evolving and presents numerous opportunities for those interested in pursuing a career in this field. With the right skills and expertise, data scientists can unlock the power of data and drive meaningful insights that can lead to transformative innovations. As the demand for data science careers continues to grow, staying up-to-date with the latest trends and technologies will be essential for success in this field. With a passion for learning and a commitment to excellence, anyone can thrive in the dynamic and exciting world of data science.  

Ruhma - Author
Ruhma Khawaja
| February 9

Data is an essential component of any business, and it is the role of a data analyst to make sense of it all. Power BI is a powerful data visualization tool that helps them turn raw data into meaningful insights and actionable decisions.

In this blog, we will explore the role of data analysts and how they use Power BI to extract insights from data and drive business success. From data discovery and cleaning to report creation and sharing, we will delve into the key steps that can be taken to turn data into decisions. 

A data analyst is a professional who uses data to inform business decisions. They process and analyze large sets of data to identify trends, patterns, and insights that can help organizations make more informed decisions. 


Data Analyst using Power BI
Uses of Power BI for a Data Analyst – Data Science Dojo

Who is a data analyst?

A data analyst is a professional who works with data to extract insights, draw conclusions, and support decision-making. They use a variety of tools and techniques to clean, transform, visualize, and analyze data to understand patterns, relationships, and trends. The role of a data analyst is to turn raw data into actionable information that can inform and drive business strategy.

They use various tools and techniques to extract insights from data, such as statistical analysis, and data visualization. They may also work with databases and programming languages such as SQL and Python to manipulate and extract data. 

The importance of data analysts in an organization is that they help organizations make data-driven decisions. By analyzing data, analysts can identify new opportunities, optimize processes, and improve overall performance. They also help organizations make more informed decisions by providing insights into customer behavior, market trends, and other key metrics.

Additionally, their role and job can help organizations stay competitive by identifying areas where they may be lagging and providing recommendations for improvement. 

Defining Power BI 

Power BI provides a suite of data visualization and analysis tools to help organizations turn data into actionable insights. It allows users to connect to a variety of data sources, perform data preparation and transformations, create interactive visualizations, and share insights with others. 

Check out this course and learn Power BI today!

The platform includes features such as data modeling, data discovery, data analysis, and interactive dashboards. It enables organizations to quickly create and share visualizations, reports, and dashboards with stakeholders, regardless of their technical skill level.

Power BI also provides collaboration features, allowing team members to work together on data insights, and share information and insights with others through Power BI reports and dashboards. 

Key capabilities of Power BI  

Data Connectivity:It allows users to connect to various data sources including Excel, SQL Server, Azure SQL, and other cloud-based data sources. 

Data Transformation: It provides a wide range of data transformation tools that allow users to clean, shape, and prepare data for analysis. 

Visualization: It offers a wide range of visualization options, including charts, tables, and maps, that allow users to create interactive and visually appealing reports. 

Sharing and Collaboration: It allows users to share and collaborate on reports and visualizations with others in their organization. 

Mobile Access: It also offers mobile apps for iOS and Android, that allow users to access and interact with their data on the go. 

How does a data analyst use Power BI? 

A data analyst uses Power BI to collect, clean, transform, visualize, and analyze data to turn it into meaningful insights and decisions. The following steps outline the process of using Power BI for data analysis: 

  1. Connect to data sources: A data analyst can import data from a variety of sources, such as spreadsheets, databases, or cloud-based services. Power BI provides several ways to import data, including manual upload, data connections, and direct connections to data sources. 
  2. Clean and transform data: Before data can be analyzed, it often needs to be cleaned and prepared. This may include removing any extraneous information, correcting errors or inconsistencies, and transforming data into a format that is usable for analysis.
  3. Create visualizations: Once the data has been prepared, a data analyst can use Power BI to create visualizations of the data. This may include bar charts, line graphs, pie charts, scatter plots, and more. Power BI provides a few built-in visualizations and the ability to create custom visualizations, giving data analysts a wide range of options for presenting data. 
  4. Perform data analysis: Power BI provides a range of data analysis tools, including calculated fields and measures, and the DAX language, which allows data analysts to perform more advanced analysis. These tools allow them to uncover insights and trends that might not be immediately apparent. 
  5. Collaborate and share insights: Once insights have been uncovered, data analysts can share their findings with others through Power BI reports or dashboards. These reports provide a way to present data visualizations and analysis results to stakeholders and can be published and shared with others. 


Learn Power BI with this crash course in no time!


By following these steps, a data analyst can use Power BI to turn raw data into meaningful insights and decisions that can inform business strategy and decision-making. 


Why should you use data analytics with Power BI? 

User-friendly interface – Power BI has a user-friendly interface, which makes it easy for users with little to no technical skills to create and share interactive dashboards, reports, and visualizations. 

Real-time data visualization – It provides real-time data visualization, allowing users to analyze data in real time and make quick decisions. 

Integration with other Microsoft tools – Power BI integrates seamlessly with other Microsoft tools, such as Excel, SharePoint, and Azure, making it an ideal tool for organizations using Microsoft technology. 

Wide range of data sources – It can connect to a wide range of data sources, including databases, spreadsheets, cloud services, and web APIs, making it easy to consolidate data from multiple sources. 

Cost-effective – It is a cost-effective solution for data analytics, with both free and paid versions available, making it accessible to organizations of all sizes. 

Mobile accessibility – Power BI provides mobile accessibility, allowing users to access and analyze data from anywhere, on any device. 

Collaboration features – With robust collaboration features, it allows users to share dashboards and reports with other team members, encouraging teamwork and decision-making. 

Conclusion 

In conclusion, Power BI is a powerful tool for data analysis that provides organizations with the ability to easily visualize, analyze, and share complex data. By preparing, cleaning, and transforming data, creating relationships between tables, using visualizations and DAX, they can create reports and dashboards that provide valuable insights into key business metrics.

The ability to publish reports, share insights, and collaborate with others makes Power BI an essential tool for any organization looking to improve performance and make informed decisions.

Hudaiba Soomro - Author
Hudaiba Soomro
| January 9

It is no surprise that the demand for a skilled data analyst grows across the globe. In this blog, we will explore eight key competencies that aspiring data analysts should focus on developing. 


Data analysis is a crucial skill in today’s data-driven business world. Companies rely on data analysts to help them make informed decisions, improve their operations, and stay competitive. And so, all healthy businesses actively seek skilled data analysts. 


Technical skills and non-technical skills for data analyst


Becoming a skilled data analyst does not just mean that you acquire important technical skills. Rather, certain soft skills such as creative storytelling or effective communication can mean a more all-rounded profile. Additionally, these non-technical skills can be key in shaping how you make use of your data analytics skills. 

Technical skills to practice as a data analyst: 

Technical skills are an important aspect of being a data analyst. Data analysts are responsible for collecting, cleaning, and analyzing large sets of data, so a strong foundation in technical skills is necessary for them to be able to do their job effectively.

Some of the key technical skills that are important for a data analyst include:

1. Probability and statistics:  

A solid foundation in probability and statistics ensures your ability to identify patterns in data, prevent any biases and logical errors in the analysis, and lastly, provide accurate results. All these abilities are critical to becoming a skilled data analyst. 

 Consider, for example, how various kinds of probabilistic distributions are used in machine learning. Other than a strong understanding of these distributions, you will need to be able to apply statistical techniques, such as hypothesis testing and regression analysis, to understand and interpret data. 


2. Programming:  

As a data analyst, you will need to know how to code in at least one programming language, such as Python, R, or SQL. These languages are the essential tools via which you will be able to clean and manipulate data, implement algorithms and build models. 

Moreover, statistical programing languages like Python and R allow advanced analysis that interfaces like Excel cannot provide. Additionally, both Python and R are open source.  

3. Data visualization 

A crucial part of a data analyst’s job is effective communication both within and outside the data analytics community. This requires the ability to create clear and compelling data visualizations. You will need to know how to use tools like Tableau, Power BI, and D3.js to create interactive charts, graphs, and maps that help others understand your data. 


Dataset
The progression of the Datasaurus Dozen dataset through all of the target shapes – Source


4. Database management:  

Managing and working with large and complex datasets means having a solid understanding of database management. This includes everything from methods of collecting, arranging, and storing data in a secure and efficient way. Moreover, you will also need to know how to design and maintain databases, as well as how to query and manipulate data within them. 

Certain companies may have roles particularly suited to this task such as data architects. However, most will require data analysts to perform these duties as data analysts responsible for collecting, organizing, and analyzing data to help inform business decisions. 

Organizations use different data management systems. Hence, it helps to gain a general understanding of database operations so that you can later specialize them to a particular management system.  

Non-technical skills to adopt as a data analyst:  

Data analysts work with various members of the community ranging from business leaders to social scientists. This implies effective communication of ideas to a non-technical audience in a way that drives informed, data-driven decisions. This makes certain soft skills like communication essential.  

Similarly, there are other non-technical skills that you may have acquired outside a formal data analytics education. These skills such as problem-solving and time management are transferable skills that are particularly suited to the everyday work life of a data analyst. 

1. Communication 

As a data analyst, you will need to be able to communicate your findings to a wide range of stakeholders. This includes being able to explain technical concepts concisely and presenting data in a visually compelling way.  

Writing skills can help you communicate your results to wider members of population via blogs and opinion pieces. Moreover, speaking and presentation skills are also invaluable in this regard. 


Read about Data Storytelling and its importance

2. Problem-solving:   

Problem-solving is a skill that individuals pick from working in different fields ranging from research to mathematics, and much more. This, too, is a transferable skill and not unique to formal data analytics training. This also involves a dash of creativity and thinking of problems outside the box to come up with unique solutions. 

Data analysis often involves solving complex problems, so you should be a skilled problem-solver who can think critically and creatively. 

3. Attention to detail: 

Working with data requires attention to detail and an elevated level of accuracy. You should be able to identify patterns and anomalies in data and be meticulous in your work. 

4. Time management:  

Data analysis projects can be time-consuming, so you should be able to manage your time effectively and prioritize tasks to meet deadlines. Time management can also be implemented by tracking your daily work using time management tools.  


Final word 

Overall, being a data analyst requires a combination of technical and non-technical skills. By mastering these skills, you can become an invaluable member of any team and make a real impact with your data analysis. 


Ayesha Saleem - Digital content creator - Author
Ayesha Saleem
| October 24

Get hired as a Data Analyst by confidently responding to the most frequently asked interview questions. No matter how qualified or experienced you are, if you stumble over your thoughts while answering the interviewer, it might take away some of your chances of getting onboard. 


data analyst interview question
Data analyst interview question – Data Science Dojo

In this blog, you will find the top data analysts interview questions covering both technical and non-technical areas of expertise.  

List of Data Analysts interview questions 

1. Share about your most successful/most challenging data analysis project? 

In this question, you can also share your strengths and weaknesses with the interviewer.   

When answering questions like these, data analysts must attempt to share both their strengths and weaknesses. How do you deal with challenges and how do you measure the success of a data project? You can discuss how you succeeded with your project and what made it successful.  

Take a look at the original job description to see if you can incorporate some of the requirements and skills listed. If you were asked the negative version of the question, be honest about what went wrong and what you would do differently in the future to fix the problem. Despite our human nature, mistakes are a part of life. What’s critical is your ability to learn from them. 

Further talk about any SAAS platforms, programming languages, and libraries. Why did you use them and how did you use them to accomplish yours?

Discuss the entire pipeline of your projects from collecting data, to turning it into valuable insights. Describe the ETL pipeline, including data cleaning, data preprocessing, and exploratory data analysis. What were your learnings and what issues did you encounter, and how did you deal with them. 

Enroll in Data Science Bootcamp today to begin your journey

2. Tell us about the largest data set you’ve worked with? Or what type of data have you worked with in the past? 

What they’re really asking is: Can you handle large data sets?  

Data sets of varying sizes and compositions are becoming increasingly common in many businesses. Answering questions about data size and variety requires a thorough understanding of the type of data and its nature. What data sets did you handle? What types of data were present? 

It is not necessary that you only mention a dataset you worked with at your job. But you can also share about varying sizes, specifically large datasets, you worked with as a part of a data analysis course, Bootcamp, certificate program, or degree. As you put together a portfolio, you may also complete some independent projects where you find and analyze a data set. All of this is valid material to build your answer.  

The more versatile your experience with datasets will be, the greater the chances there are of getting hired.  

Read more about several types of datasets here:

32 datasets to uplift your skills in data science


3. What is your process for cleaning data? 

The expected answer to this question will include details about: How you handle missing data, outliers, duplicate data, etc.?c.? 

Data analysts are widely responsible for data preparation, data cleansing, or data cleaning. Organizations expect data analysts to spend a significant amount of time preparing data for an employer. As you answer this question, share in detail with the employer why data cleaning is so important. 

In your answer, give a short description of what data cleaning is and why it’s important to the overall process. Then walk through the steps you typically take to clean a data set. 

 Learn about Data Science Interview Questions and begin your career as a data scientist today.

4. Name some data analytics software you are familiar with. OR what data software have you used in the past? OR What data analytics software are you trained in? 

What they need to know: Do you have basic competency with common tools? How much training will you need? 

Before you appear for the interview, it’s a good time to look at the job listing to see what software was mentioned. As you answer this question, describe how you have used that software or something similar in the past. Show your knowledge of the tool by employing associated words.  

Mention software solutions you have used for a variety of data analysis phases. You don’t need to provide a lengthy explanation. What data analytics tools you used and for what purpose will satisfy the interviewer. 


5. What statistical methods have you used in data analysis? OR what is your knowledge of statistics? OR how have you used statistics in your work as a Data Analyst? 

What they’re really asking: Do you have basic statistical knowledge? 

Data analysts should have at least a rudimentary grasp of statistics and know-how that statistical analysis helps business goals. Organizations look for a sound knowledge of statistics in Data analysts to handle complex projects conveniently. If you used any statistical calculations in the past, be sure to mention it. If you haven’t yet, familiarize yourself with the following statistical concepts: 

  • Mean 
  • Standard deviation 
  • Variance
  • Regression 
  • Sample size 
  • Descriptive and inferential statistics 

While speaking of these, share information that you can derive from them. What knowledge can you gain about your dataset? 

Read these amazing 12 Data Analytics books to strengthen your knowledge

12 excellent Data Analytics books you should read in 2022


6. What scripting languages are you trained in? 

In order to be a data analyst, you will almost certainly need both SQL and a statistical programming language like R or Python. If you are already proficient in the programming language of your choice at the job interview, that’s fine. If not, you can demonstrate your enthusiasm for learning it.  

In addition to your current languages’ expertise, mention how you are developing your expertise in other languages. If there are any plans for completing a programming language course, highlight its details during the interview. 

To gain some extra points, do not hesitate to mention why and in which situations SQL is used, and why R and python are used. 


7. How can you handle missing values in a dataset? 

This is one of the most frequently asked data analyst interview questions, and the interviewer expects you to give a detailed answer here, and not just the name of the methods. There are four methods to handle missing values in a dataset. 

  • Listwise Deletion 

In the listwise deletion method, an entire record is excluded from analysis if any single value is missing. 

  • Average Imputation  

Take the average value of the other participants’ responses and fill in the missing value. 

  • Regression Substitution 

You can use multiple-regression analyses to estimate a missing value. 

  • Multiple Imputations 

It creates plausible values based on the correlations for the missing data and then averages the simulated datasets by incorporating random errors in your predictions. 


8. What is Time Series analysis? 

Data analysts are responsible for analyzing data points collected at different intervals. While answering this question you also need to talk about the correlation between the data evident in time-series data. 

Watch this short video to learn in detail:


9. What is the difference between data profiling and data mining?

Profiling data attributes such as data type, frequency, and length, as well as their discrete values and value ranges, can provide valuable information on data attributes. It also assesses source data to understand its structure and quality through data collection and quality checks. 

On the other hand, data mining is a type of analytical process that identifies meaningful trends and relationships in raw data. This is typically done to predict future data. 


10. Explain the difference between R-Squared and Adjusted R-Squared.

The most vital difference between adjusted R-squared and R-squared is simply that adjusted R-squared considers and tests different independent variables against the model, and R-squared does not. 

An R-squared value is an important statistic for comparing two variables. However, when examining the relationship between a single stock and the rest of the S&P500, it is important to use adjusted R-squared to determine any discrepancies in correlation. 


11. Explain univariate, bivariate, and multivariate analysis.

Bivariate analysis, which is simpler than univariate analysis, is used when the data set only has one variable and does not involve causes or effects.  

Univariate analysis, which is more complicated than bivariate analysis, is used when the data set has two variables and researchers are looking to compare them.  

When the data set has two variables and researchers are investigating similarities between them, multivariate analysis is the right type of statistical approach. 


12. How would you go about measuring the business performance of our company, and what information do you think would be most important to consider?

Before appearing for an interview, make sure you study the company thoroughly and gain enough knowledge about it. It will leave an impression on the employer regarding your interest and enthusiasm to work with them. Also, in your answer you talk about the added value you will bring to the company by improving its business performance. 


13. What do you think are the three best qualities that great data analysts share?

List down some of the most critical qualities of a Data Analyst. This may include problem-solving, research, and attention to detail. Apart from these qualities, do not forget to mention soft skills, which are necessary to communicate with team members and across the department.    


Did we miss any Data Analyst interview questions? 

Share with us in the comments below and help each other to ace the next data analyst job. 

Data Science Dojo
Hazel Jones
| October 11

Data analysis and data science are very closely related professions in many respects. If one enjoys problem-solving, data-driven decision-making, and critical thinking, both occupations are a good fit. While all alternatives draw on the same core skill set and strive toward comparable goals, there are differences in schooling, talents, daily responsibilities, and compensation ranges. 


The data science certification course offers insight into the tools, technology, and trends driving the data science revolution. We have developed this guide to enable you to go through the abilities and background required to become a data scientist or data analyst, and their corresponding course fee.


Data Scientist vs. Data Analyst

Data analysis and data science are often misunderstood since they rely on the same fundamental skills, not to mention the very same broad educational foundation (e.g., advanced mathematics, and statistical analysis). 

However, the day-to-day responsibilities of each role are vastly different. The difference, in its most basic form, is how they utilize the data they collect.

data analyst vs data scientist
Key differences between a data analyst and a data scientist

Role of a Data Analyst

A data analyst examines gathered information, organizes it, and cleans it to make it clear and helpful. Based on the data acquired, they make recommendations and judgments. They are part of a team that converts raw data into knowledge that can assist organizations in making sound choices and investments.


Role of a Data Scientist

A data scientist creates the tools that will be used by an analyst. They write programs, algorithms, and data-gathering technologies. Data scientists are innovative problem solvers who are constantly thinking of new methods to acquire, store, and view data.


Differences in the role of data scientist and data analyst

data analyst vs data scientist job role
Job roles of data analyst and data scientist


While both data analysts and data scientists deal with data, the primary distinction is what they do with it. Data analysts evaluate big data sets for insights, generate infographics, and generate visualizations to assist corporations in making better strategic choices. Data scientists, on the other hand, use models, methods, predictive analytics, and specialized analyses to create and build current innovations for data modeling and manufacturing.


Data experts and data scientists typically have comparable academic qualifications. Most have Bachelor’s degrees in economics, statistics, computer programming, or machine intelligence. They have in-depth knowledge of data, marketing, communication, and algorithms. They can work with advanced systems, databases, and Programming environments.


What is data analysis?

Data analysis is the thorough examination of data to uncover trends that can be turned into meaningful information. When formatted and analyzed correctly, previously meaningless data can become a wealth of useful and valuable information that firms in various industries can use.


Data analysis, for example, can tell a technical store what product is most successful at what period and with which population, which can then help employees decide what kind of incentives to run. Data analysis may also assist social media companies in determining when, what, and how they should promote particular users to optimize clicks.


What is data science?

Data science and data analysis both aim to unearth significant insights within piles of complicated or seemingly minor information. Rather than performing the actual analytics, data science frequently aims at developing the models and implementing the techniques that will be used during the process of data analysis.


While data analysis seeks to reveal insights from previous data to influence future actions, data science seeks to anticipate the result of future decisions. Artificial image processing and pattern recognition, which are still in their early stages, are used to create predictions based on large amounts of historical data.


Responsibilities: Data Scientist vs Data Analyst

Professionals in data science and data analysis must be familiar with managing data, information systems, statistics, and data analysis. They must alter and organize data for relevant stakeholders to find it useful and comprehensible. They also assess how effectively firms perform on predefined metrics, uncover trends, and explain the differentiated strategy. While job responsibilities frequently overlap, there are contrasts between data scientists and data analysts, and the methods they utilize to attain these goals.


Data Analyst Data Scientist
Data analyzers are expert interpreters. They use massive amounts of information to comprehend what is going on in the industry and how corporate actions affect how customers perceive and engage with the company. They are motivated by the need to understand people’s perspectives and behaviors through data analysis.  Data scientists build the framework for capturing data and better understanding the narrative it conveys about the industry, enterprise, and decisions taken. They are designers that can create a system that can handle the volume of data required while also making it valuable for understanding patterns and advising the management team. 
Everyday data analyst tasks may involve examining both historical and current patterns and trends. Data scientists are typically responsible for the scrubbing and information retrieval.
Create operational and financial reports. Data collection statistical analysis.
Forecasting in tools such as Excel. Deep learning framework training and development.
Designing infographics. Creating architecture that can manage large amounts of data.
Data interpretation and clear communication. Developing automation that streamlines data gathering and processing chores daily.
Data screening is accomplished by analyzing documents and fixing data corruption.  Presenting insights to the executive team and assisting with data-driven decision making
Using predictive modeling to discover and impact future trends.


Role: Data Scientist vs Data Analyst

Data Analyst job description

A data analyst, unsurprisingly, analyzes data. This entails gathering information from various sources and processing it via data manipulation and statistical techniques. These procedures organize and extract insights from data, which are subsequently given to individuals who may act on them.

Become a pro with Data Analytics with these 12 amazing books

Users and decision-makers frequently ask data analysts to discover answers to their inquiries. This entails gathering and comparing pertinent facts and stitching it together to form a larger picture. Knowledgehut looks more closely at a career path in analytics and science, and helps you determine which employment best matches your interests, experience, and ambitions.


Data Scientist job description

A data scientist can have various tasks inside a corporation, among which are very comparable to those of a data analyst, such as gathering, processing, and analyzing data to get meaningful information. 


Whereas a data analyst is likely to have been given particular questions to answer, a data scientist may indeed evaluate the same collection of data with the goal of diverse variables that may lead to a new line of inquiry. In other words, a data scientist must identify both the appropriate questions and the proper answers.


A data scientist will make designs and write algorithms and software to assist them as well as their research analyst team members with the analysis of data. A data scientist is also deeply engaged in the field of artificial intelligence and tries to push the limits and develop new methods to apply this technology in a corporate context.


How can Data Scientists become ethical hackers?

Yes, you heard it right. Data scientists can definitely become ethical hackers. There are several skills data scientists possess that can help them with the smooth transition from data scientists to ethical hackers. The skills are extensive knowledge of programming languages, databases, and operating systems. Data science is an important tool that can prevent hacking.


The necessary skills for a data scientist to become an ethical hacker include mathematical and statistical expertise, and extensive hacking skills. With the rise of cybercrimes, the need for cyber security is increasing. When data scientists become ethical hackers, they can protect an organization’s data and prevent cyber-attacks. 


Skill set required for data analysis and data science


Data analysis Data science
Qualification: A Bachelor’s or Master’s degree in a related discipline, such as mathematics or statistics. Qualification: An advanced degree, such as a master’s degree or possibly a Ph.D., in a relevant discipline, such as statistics, computer science, or mathematics.
Language skills: To understand data analysis, such as Python, SQL, CQL, and R. Language skills: Demonstrate proficiency in data-related programming languages such as SQL, R, Java, and Python.
Soft skills: 

  • Written and verbal communication skills
  • Exceptional analytical skills 
  • Organizational skills
  • The ability to manage many products at the same time may be required.
Soft skills: 

  • Substantial experience with data mining 
  • Specialized statistical activities and tools
  • Generating generalized linear model regressions, statistical tests, designing data structures, and text mining. 
Technical skills: 

  • Expertise in data gathering and some of the most recent data analytics technology.
Technical skills: 

  • Experience with data sources and web services
  • Web services such as Spark, Hadoop, DigitalOcean and S3 
  • Trained to use information obtained from third-party suppliers such as Google Analytic, Crimson Hexagon, Coremetrics, Site Catalyst
Microsoft Office proficiency: 

Proficient in Microsoft Office applications, notably Excel, to properly explain their findings and translate them for others to grasp. 

Knowledge of statistical techniques and technology: Data processing technologies such as MySQL and Gurobi, as well as technological advances such as machine learning models, deep learning, artificial intelligence, artificial neural networks, and decision tree learning, will play a significant role.


Conclusion 

Each career is a good fit for an individual who enjoys statistics, analytics, and evaluating business decisions. As a data analyst or data scientist, you will make logical sense of large amounts of data, articulate patterns and trends, and participate in great responsibilities in a corporate or government organization.

When picking between a data analytics and a data science profession, evaluate your career aspirations, skills, and how much time you want to devote to higher learning and intensive training. Start your data analyst or data scientist journey with a data science course with nominal data science course fee to learn in-demand skills used in realistic, long-term projects, strengthening your resume and commercial viability.


FAQs


  1. Which is better: Data science or data analyst?

Data science is suitable for candidates who want to develop advanced machine learning models and make human tasks easier. On the other hand, the data analyst role is appropriate for candidates who want to begin their career in data analysis. 


  1. What is the career path for data analytics and data science?

Most data analysts will begin their careers as junior members of a bigger data analysis team, where they will learn the fundamentals of the work in a hands-on environment and gain valuable experience in data manipulation. At senior level, data analysts become team leaders, in control of project selection and allocation.

A junior data scientist will most likely obtain a post with a focus on data manipulation before delving into the depths of learning algorithms and mapping out forecasts. The procedure of preparing data for analysis varies so much from case to case that it’s far simpler to learn by doing. 

Once conversant with the mechanics of data analysis, data scientists might expand their understanding of artificial intelligence and its applications by designing algorithms and tools. A more experienced data scientist may pursue team lead or management positions, distributing projects and collaborating closely with users and decision-makers. Alternatively, they could use their seniority to tackle the most difficult and valuable problems using their specialist expertise in patterns and machine learning.


  1. What is the salary for a data scientist and a data analyst in India?

2 to 4 years (Senior Data Analyst): $98,682 whereas the average data scientist salary is $100,560, according to the U.S. Bureau of Labor Statistics.


References

Difference Between Data Science and Data Analytics – GeeksforGeeks

Business analytics vs data science – Data Science Dojo

Data Analyst vs. Data Scientist: Key Differences Explained | Upwork

Data Analyst vs. Data Scientist: What’s the Difference? | Coursera

Data Analytics vs. Data Science: A Breakdown (northeastern.edu)

Data Analyst vs. Data Scientist: Salary, Skills, & Background (springboard.com)

Data Analyst vs. Data Scientist: Which Should You Pursue? – UT Austin Boot Camps (utexas.edu)

Related Topics

Statistics
Resources
Programming
Machine Learning
LLM
Generative AI
Data Visualization
Data Security
Data Science
Data Engineering
Data Analytics
Computer Vision
Career
Artificial Intelligence