fbpx

Data Engineering

Revolutionize data management with Meltano CLI – The ultimate open source solution for flexible and scalable ELT
Insiyah Talib
| March 15, 2023

Data Science Dojo is offering Meltano CLI for FREE on Azure Marketplace preconfigured with Meltano, a platform that provides flexibility and scalability. It comprises four features, it is customizable, observable with a full view of data visualization, testable and versionable to track changes, and can easily be rolled back if needed. 

It is somewhat of a tiring process to install the technology. Then look after the integration and dependency issues. Already feeling tired? It is somehow confusing to resolve the installation errors. Not to worry as Data Science Dojo’s Meltano CLI instance fixes all of that. But before we delve further into it, let us get to know some basics.  

What is Meltano? 

Meltano is an open-source Command Line Interface (CLI) tool that offers a flexible and scalable solution for Extract, Load, and Transform (ELT) processes. It is designed to assist data engineers in transforming, converting, and validating data in a simplified manner while ensuring accuracy and reliability.

The Meltano CLI can efficiently handle complex data engineering tasks, providing a user-friendly interface that simplifies the ELT process. It can also integrate with different data sources, enabling users to extract data from various sources, load it into a target destination, and transform it according to their specific requirements.

In addition, it offers a range of plugins that extend its capabilities and allow users to customize their ELT workflows. These plugins include extractors, loaders, and transformers, among others.

Challenges for individuals

Before Meltano CLI, there were several challenges associated with data integration that made the process difficult and time-consuming. Here are a few of the main challenges: 

  • Lack of Standardization: Data integration tools were often proprietary, which made it difficult to integrate different tools and workflows. This meant that organizations often had to use multiple tools to complete a data integration project. 
  • Complexity: Many data integration tools were complex and required extensive knowledge of programming and data architecture to use effectively. This made it difficult for non-technical users to participate in data integration projects. 
  • Scalability: As data volumes grew, many data integration tools struggled to handle the scale of the data. This led to slow and inefficient data integration processes. 
  • Cost: Many data integration tools were expensive, which made them inaccessible for smaller organizations with limited budgets. 
  • Limited Customization: Many data integration tools offered limited customization options, which made it difficult to adapt the tool to fit the unique needs of an organization.


All in all, it was designed to address many of these challenges by providing an open-source, flexible, and user-friendly tool that can be customized to fit the unique requirements of users.

Meltano CLI for ELT
                                          Meltano CLI for ELT – Data Science Dojo

Why Meltano? 

Meltano CLI stands out as a data engineering tool. It provides flexibility and scalability. It comprises of four features, it is customizable, observable with a full view of data visualization, testable and versionable to track changes, and can easily be rolled back if needed.

Meltano CLI has solved many struggles that make it a compelling choice for many users, including: 

  1. Open-source: It is free and open-source, which means that users can download, use, and modify the source code as per their needs. 
  2. Easy-to-use: It is designed to be easy to use with a simple command-line interface and intuitive user interface. Users can easily configure, execute, and monitor data integration pipelines. 
  3. Customizable: Meltano CLI offers a high degree of customization, allowing users to define custom transformations, connectors, and integrations. 
  4. Modern stack: It is built using modern open-source technologies such as Python, Flask, and Vue.js, making it easy to extend and integrate with other tools. 
  5. GitLab Integration: Meltano CLI is developed by GitLab, which means it can be easily integrated with GitLab for version control, collaboration, and continuous integration and deployment (CI/CD). 


Overall, Meltano CLI is a powerful and flexible data integration tool that offers a unique set of features and benefits that may make it a good choice for certain data integration projects. However, the choice of tool ultimately depends on the specific needs and requirements of the project at hand.
 

Integrations

MeltanoHub is the primary location to find all plugins, including Singer taps and targets. It serves as a single source of truth for users, making it easy to discover and use plugins within Meltano. Additionally, users can contribute to the Hub by adding more plugins, which are immediately accessible.

The Hub is maintained by Meltano and the broader community, ensuring that it is continuously curated and up to date. This centralized platform simplifies the process of finding and using plugins, enabling users to enhance their data engineering workflows with ease. 

Key features

Meltano CLI includes several features, including: 

  • Easy to setup and easy to use 
  • Pipeline creation and management 
  • Extract, transform, and load (ETL) processes 
  • Plugin management 
  • Visualization 
  • Configuration management 
  • Version control 
  • Testability 
  • Integration with other tools: It seamlessly integrates with other tools such as dbt, Singer, and Airflow, among others, to enhance your workflow.

What Data Science Dojo has for you?

Azure Virtual Machine is preconfigured with CLI plug-and-play functionality, so you do not have to worry about setting up the environment. 

  • Features include a zero-setup CLI platform that offers a high degree of customization, allowing users to define custom transformations, connectors, and integrations. It is designed to be easy to use with a simple command-line interface and intuitive user interface.
  • Meltano CLI helps you efficiently transform, convert, and validate your data using a simplified process for data engineering, with the assurance of accuracy and reliability. 


And many others which you check by taking a quick peek here: Meltano CLI on Azure Marketplace sets it apart from others is that it is an open-source, flexible, and scalable CLI for ELT+. It is customizable. It is also observable, provides a full view with detailed pipeline logs and statistics, and allows inspection of code for debugging. Meltano is versionable which allows easy tracking and rollback of changes. It is testable and only deploys to production once everything is green. 

Moreover, Meltano CLI is a powerful and flexible data integration tool that offers many benefits over other tools on the market. Its open-source nature, ease of use, integration with other tools, reconfigurability, and community support make it a compelling choice for data integration projects. 

Conclusion  

The Meltano CLI comes with pre-configured Ubuntu 20.04 and a ready-to-use project, allowing for a plug-and-play experience without any setup required. By using Azure, the fault tolerance of data pipelines is increased, resulting in higher performance and faster content delivery.

The Meltano CLI provides an open-source, flexible, and scalable CLI for ELT+, allowing for efficient data transformation, conversion, and validation with accuracy and reliability. When combined with Microsoft Azure services, Meltano outperforms traditional methods by performing data-intensive computations in the cloud. Collaboration and sharing of notebooks with stakeholders is also possible.

At Data Science Dojo, we deliver data science education, consulting, and technical services to increase the power of data. We are therefore adding a free project Environment dedicated specifically to Data Integration and ELT on Azure Market Place. Do not wait to install this offer by Data Science Dojo, your ideal companion in your journey to learn data science! 

Try Now


Apache Airflow: Monitor and manage the data pipelines and complex workflows
Ali Mohsin
| December 3, 2022

Data Science Dojo is offering Apache Airflow for FREE on Azure Marketplace packaged with a pre-configured web environment of Airflow with various data analytics features.  


Introduction:  

In this era of tighter data restrictions, it is more important than ever to understand, analyze, and manage your data throughout its lifecycle. It is harder than ever as data volumes rise, and data pipelines get more complicated. A solution is needed Organizations or Individuals must have a complete, scalable, easy-to-analyze platform to manage and monitor the complex workflows and support several integrations. 


What is Apache Airflow?  

Apache Airflow, a powerful open-source tool for authoring, scheduling, and monitoring data and computational workflows. It provides a method that makes it easier to manage, schedule, and coordinate complicated data pipelines from several sources. 


What is DAG? 

A DAG, or Directed Acyclic Graph, in Airflow is a list of all the jobs you wish to execute, arranged to reflect their connections and dependencies. A Python script that expresses the DAG’s structure as code defines a DAG. Researchers’ priori ideas about the connections between and among variables in causal structures are encoded using DAGs. It contains directed edges (arrows), linking nodes (variables), and their paths. Hence A workflow is represented as a DAG, which consists of discrete units of work called Tasks that are ordered considering relationships and data flows. 


Apache Airflow Architecture: 

This powerful and scalable workflow scheduling software is made up of four key parts: 

  • Scheduler: The scheduler keeps track of all DAGs and the jobs they are connected to. To start, it frequently checks the list of open tasks. 
  • Web server: The user interface for Airflow is the web server (The default port Apache Airflow listens to is 8080). It displays the status of the jobs, gives the user access to the databases, and lets them read log files from other remote file stores like Microsoft Azure blobs. 
  • Database: To make sure the schedule retains metadata information, the state of the DAGs and the tasks they are connected to, are saved in the database. The scheduler scans each DAG and records essential data, including schedule intervals, run-by-run statistics, and task instances. 
  • Executors: There are various kinds of executors for different use cases. Few examples of Executors are  SequentialExecutor, LocalExecutor, CeleryExecutor, and KubernetesExecutor 


(With SequentialExecutor, just one task may be carried out at once. No parallel processing is possible. It is useful when testing or debugging. LocalExecutor supports hyperthreading and parallelism. It is excellent for using Airflow on a single node or a local workstation. CeleryExecutor is usually used for managing a distributed Airflow cluster. While using the Kubernetes API, the KubernetesExecutor creates temporary pods for each of the task instances to run in.) 


Key features Apache Airflow provides: 

  • Dynamic Pipelines can be constructed by Airflow dynamic, also as it is constructed in the form of code which gives an edge to dynamic behavior. 
  • Apache Airflow has a rich User Interface that helps the user to manage their workflow easily 
  • It gives a separate code view pallet that enables users to view their DAGs code as well.  
  • Allows users to visualize their DAGs in different forms like Gantt chart, Tree, and Graph. 
  • With ready to use operators in airflow, users can work with various cloud platforms like Microsoft Azure, AWS (Amazon Web Services) etc. 
  • Allows role-based user management to maintain Security and Accessibility.


Apache Airflow with Azure services: 

Apache Airflow leverages the power of Azure services to make the procedure of monitoring and managing complex workflows intuitively. Also with Azure, Airflow made it a more scalable data warehousing platform. Airflow enables users to work in a scalable environment. 


Conclusion:  

Other open-source Data Engineering solutions put intense competition on Apache Airflow. But it is one of the most robust platforms used by Data Engineers for orchestrating workflows or pipelines. Users can easily visualize your data pipelines’ dependencies, progress, logs, code, trigger tasks, and success status all in a single package.  

At Data Science Dojo, we deliver data science education, consulting, and technical services to increase the power of data. We therefore know the importance of data and the encapsulated insights. Through this offer, we are confident that you can analyze, visualize, and query your data in a collaborative environment with greater ease. 

Install the Apache Airflow offer now from the Azure Marketplace by Data Science Dojo, your ideal companion in your journey to learn data science! 

Click on the button below to head over to the Azure Marketplace and deploy Apache Airflow for FREE by clicking on “Try now.”  


CTA - Try now


Note: You’ll have to sign up to Azure, for free, if you do not have an existing account. 

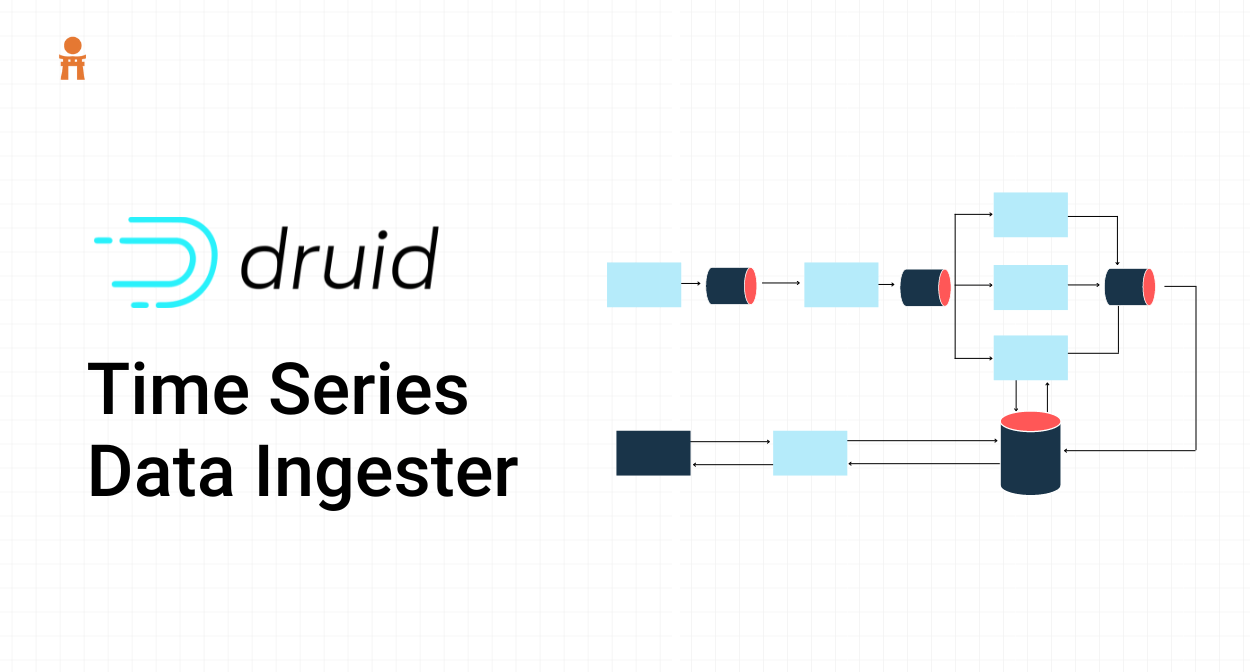
Apache Druid: Real-time data ingestion and querying
Saad Shaikh
| November 11, 2022

Data Science Dojo is offering Apache Druid for FREE on Azure Marketplace packaged with a pre-configured web environment of Druid with support of various data sources. 

What is data ingestion? 

Data ingestion is the method involved with shipping information from at least one source to an objective site for additional handling and examination. This information can begin from a scope of sources, including data lakes, IoT gadgets, on-premises data sets, and other applications, and arrive in various environments, for example, cloud warehouse or our very own Druid data store. 

OLAP 

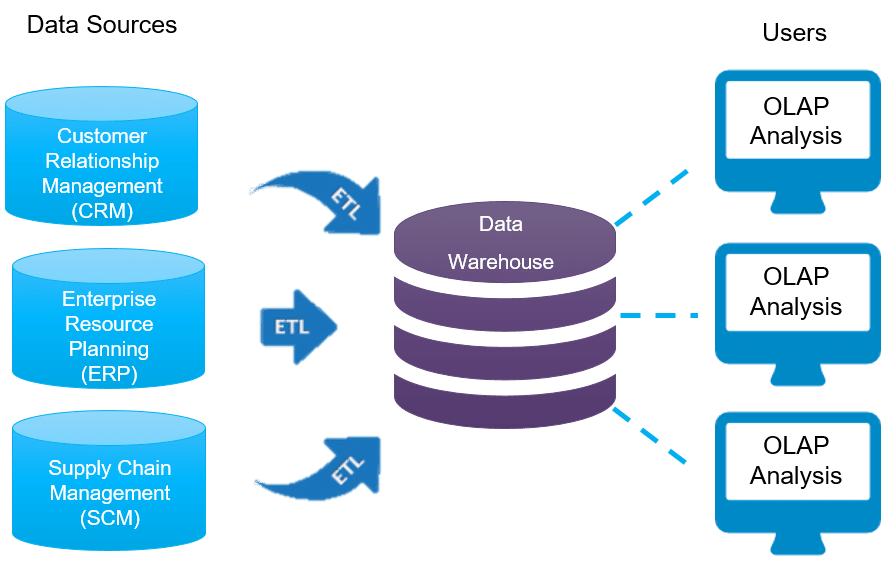
Online Analytical Processing (OLAP) is a method for quickly responding to multidimensional analytical questions in computing. OLAP frameworks are usually utilized in numerous BI and data science programs. It involves ingesting data in real-time, whether it’s streaming or in batches, for drawing analytics. OLAP systems usually maintain a data warehouse having redundancy along with maintaining time-series of datasets. They require customized queries to be computed at fast speeds. 


Pro Tip: Join our 6-months instructor-led Data Science Bootcamp to master data science & engineering 

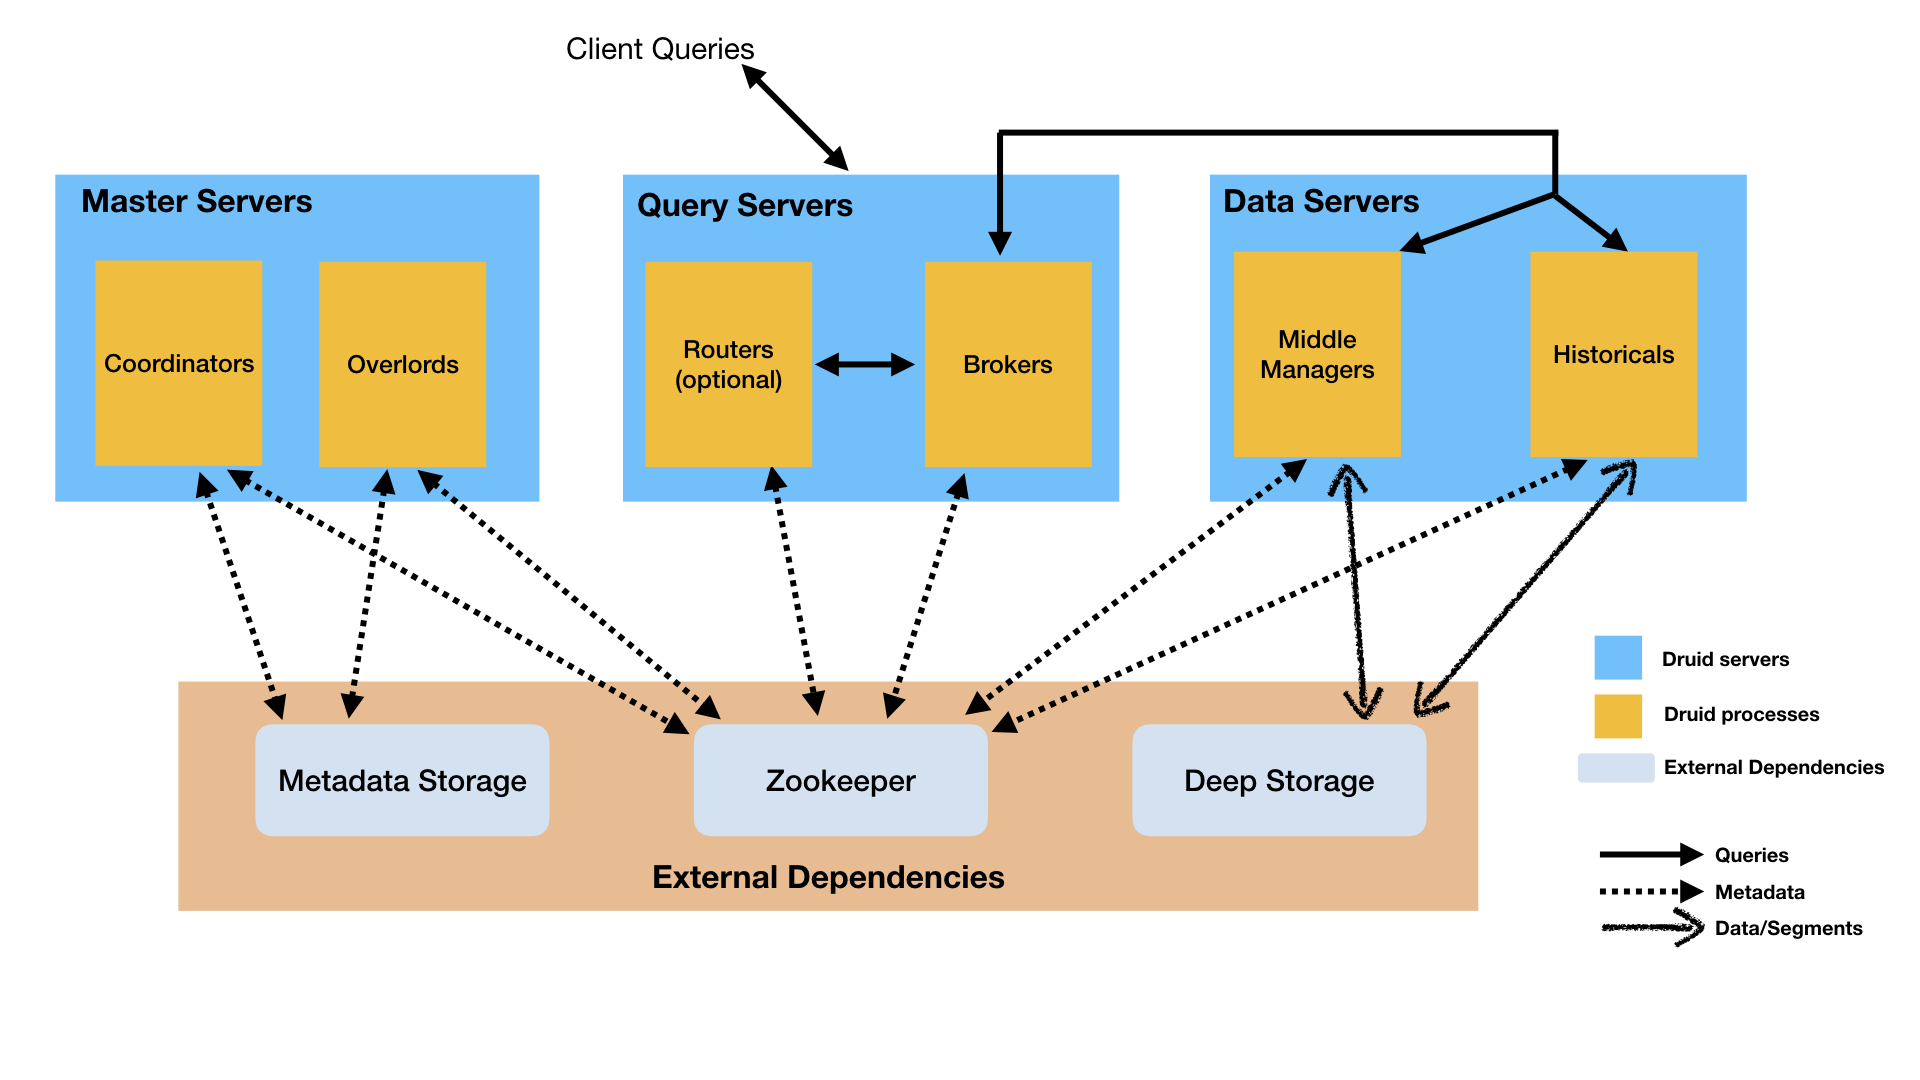
Backend services of Apache Druid  

  1. Middle Manager: This process is responsible for ingesting the data 
  2. Broker: This process is responsible for retrieving queries from external clients 
  3. Coordinator: It assigns segments to specific nodes 
  4. Overlord: It assigns ingestion tasks to middle managers 
  5. Historical: It handles the storage and querying of data 
  6. Router: Optional component to provide single API gateway for coordinators, overlords and brokers 

Obstacles for data engineers & developers 

Collection and maintenance of data from different sources was a hectic task for data engineers and developers. The organization of schema and its monitoring was another challenge in case of huge data. The requirement to response efficiently to complex OLAP queries and any sort of quick calculation was a nightmare. 

In this scenario, a unified environment to deal with the ad-hoc queries, management of different data sets, keeping the time-series of data and quick data ingestions from various sources all from one place would be enough to tackle the mentioned challenges. 

Methodology of Apache Druid  

Apache Druid is an interactive real-time database backend environment for ingesting, maintaining, and segmenting data from a variety of sources either streaming or in batches, thus making it flexible. It is a scalable distributed system with parallel processing for queries and has a column-based structure for storing datasets, indicating the properties of each ingestion.

Druid stores the data safely in deep storage and provides indexing and time-based partitioning for faster filtering and searching performance. Users can query the ingested datasets with Druid’s optimized SQL engine. It also provides automatic summarization and algorithmic approximation of data. 

druid-architecture
Druid Architecture (Picture Courtesy: https://druid.apache.org/docs/latest/design/architecture.html ) 


Major features   

  • Apache Druid has a fast and optimized user interface. Druid UI makes it easy to supervise, refresh and troubleshoot your datasets. The column-oriented organization provides ease of control to the users 
  • Any ingested data can be subjected to queries with the help of an in-browser SQL editor. It delivers the results with low latency 
  • It is an open-source tool. Developers, data engineers, DevOps, companies focusing on web and mobile analytics, solutions architects who want to monitor network performance, and anyone interested in data science can use this offer 
  • Druid provides the feature of maintaining logs of each activity. In case of failure of any operation, the logs are updated, and the user can check them on the same web server 
  • You can monitor the status of your datasets oriented in a column via the web server 


What does Data Science Dojo provide?  

Apache Druid instance packaged by Data Science Dojo serves as a pre-configured data store for managing and monitoring ingested data along with SQL support to query data without the burden of installation. It offers efficient storage, quick sifting on dimensions of data, and querying of data at a sub-second normal reaction time. It supports a variety of data sources to ingest data from. 

Features included in this offer:  

  • A Druid service that is easily accessible from the web, having a rich user interface 
  • Easy to operate and user friendly 
  • In-browser SQL coding environment to query ingested data sets 
  • Low latency automated data aggregations and approximations using algorithms 
  • Quick responsiveness and high uptime 
  • Time-based data partitioning 
  • Feature of schema configuration and data tuning at the time of ingestion 

Our instance of Apache Druid supports the following data sources: 

  • Apache Kafka 
  • HDFS 
  • HTTP(s) 
  • Local disk 
  • Azure Event Hub 
  • Paste Data 
  • Other custom sources 

By specifying credentials and adding extensions you can also ingest from : 

  • Azure Data Lake 
  • Google Cloud Storage 
  • Amazon S3 & Kinesis 

Conclusion 

Apache Druid is majorly used for OLAP systems because of its time series data ingestion, and the way the services perform indexing, and response to queries in real-time. It has a flexible and fault-tolerant architecture. When coupled with Microsoft cloud services, responsiveness and processing speed outperform their traditional counterparts because data-intensive computations aren’t performed locally, but in the cloud. 

Install the Apache Druid offer now from the Azure Marketplace by Data Science Dojo, your ideal companion in your journey to learn data science! 


Click on the button below to head over to the Azure Marketplace and deploy Apache Druid for FREE by clicking on “Try now”.   

CTA - Try now

Note: You’ll have to sign up to Azure, for free, if you do not have an existing account.   


Metabase: Analyze and learn data with just a few clicks
Saad Shaikh
| November 5, 2022

Data Science Dojo is offering Metabase for FREE on Azure Marketplace packaged with web accessible Metabase: Open-Source server. 

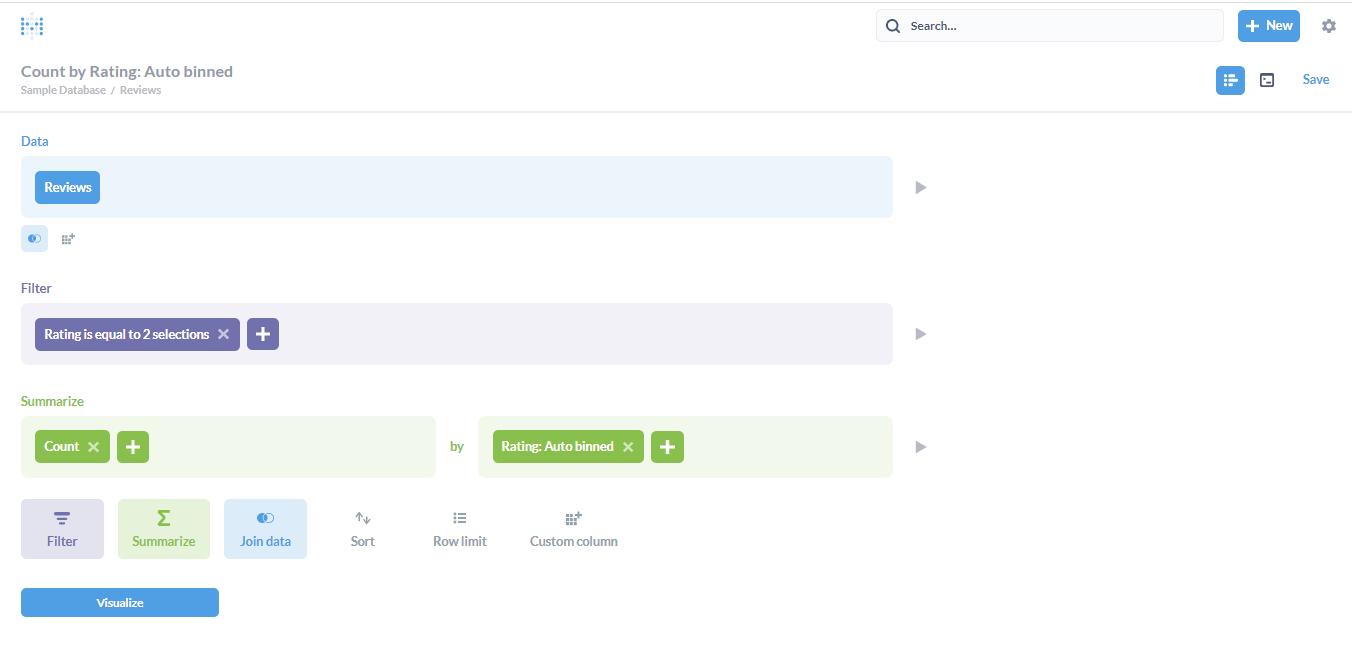
Metabase query
Metabase query


Introduction 

Organizations often adopt strategies that enhance the productivity of their selling points. One strategy is to utilize the prior business data to identify key patterns regarding any product and then take decisions for it accordingly. However, the work is quite hectic, costly, and requires domain experts. Metabase has bridged that gap of skillset. Metabase provides marketing and business professionals with an easy-to-use query builder notebook to extract required data and simultaneously visualize it without any SQL coding, with just a few clicks. 

What is Metabase and its question? 

Metabase is an open-source business intelligence framework that provides a web interface to import data from diverse databases and then analyze and visualize it with few clicks. The methodology of Metabase is based on questions and the answers to them. They form the foundation of everything else that it provides. 


A question is any kind of query that you want to perform on a data. Once you are done with the specification of query functions in the notebook editor, you can visualize the query results. After that you can save this question as well for reusability and turn it into a data model for business specific purposes. 

Pro Tip: Join our 6-months instructor-led Data Science Bootcamp to become expert at data science & analytics skillset 

Challenges for businesses  

For businesses that lack expert analysts, engineers and substantial IT department, it was costly and time-consuming to hire new domain experts or managers themselves learn to code and then explore and visualize data. Apart from that, not many pre-existing applications provide diverse data source connections which was also a challenge. 

In this regard, a straightforward interactive tool that even newbies could adapt immediately and thus get the job done would be the most ideal solution. 

Data analytics with Metabase  

Metabase concept is based on questions which are basically queries and data models (special saved questions). It provides an easy-to-use notebook through which users can gather raw data, filter it, join tables, summarize information, and add other customizations without any need for SQL coding.

Users can select the dimensions of columns from tables and then create various visualizations and embed them in different sub-dashboards. Metabase is frequently utilized for pitching business proposals to executive decision-makers because the visualizations are very simple to achieve from raw data. 


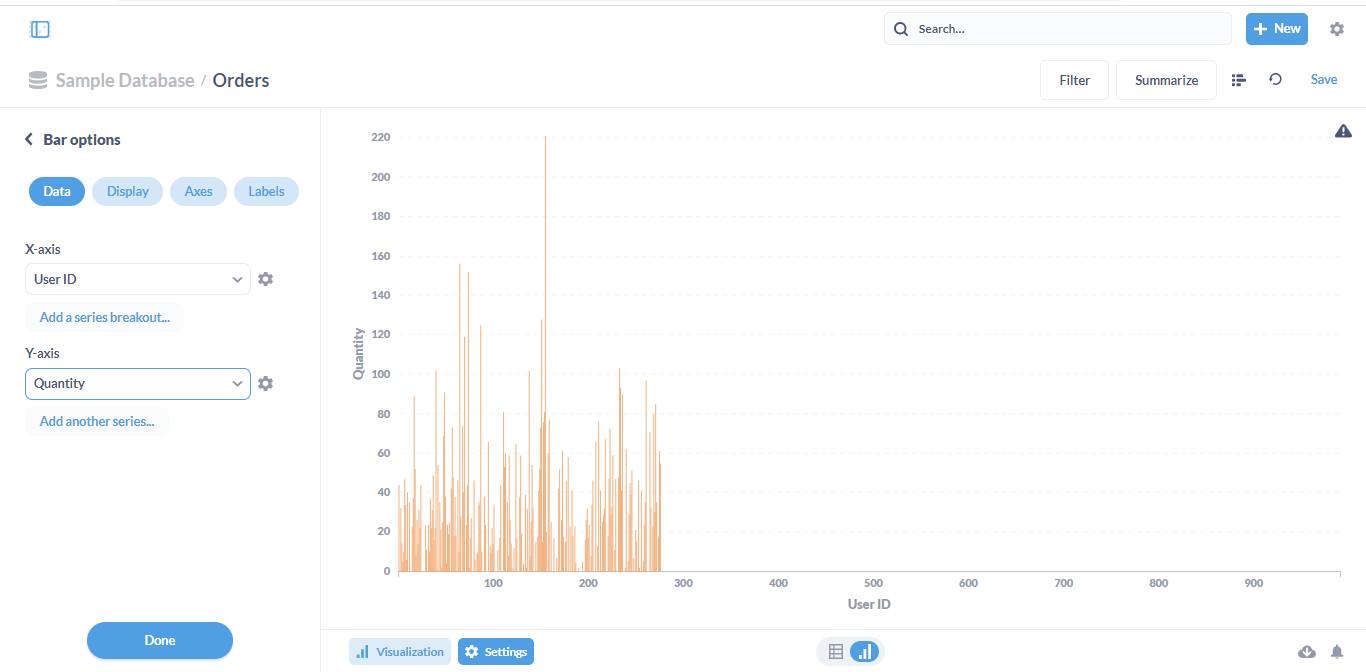
visualization on sample data
Figure 1: A visualization on sample data 


A visualization on sample data 
Figure 2:  Query builder notebook


Major characteristics 

  • Metabase delivers a notebook that enables users to select data, join with other tables, filter, and other operations just by clicking on options instead of writing a SQL query 
  • In case of complex queries, a user can also use an in-built optimized SQL editor 
  • The choice to select from various data sources like PostgreSQL, MongoDB, Spark SQL, Druid, etc., makes Metabase flexible and adaptable 
  • Under the Metabase admin dashboard, users can troubleshoot the logs regarding different tasks and jobs 
  • Has the ability to enable public sharing. It enables admins to create publicly viewable links for Questions and Dashboards  

What Data Science Dojo has for you  

Metabase instance packaged by Data Science Dojo serves as an open-source easy-to-use web interface for data analytics without the burden of installation. It contains numerous pre-designed visualization categories waiting for data.

It has a query builder which is used to create questions (customized queries) with few clicks. In our service users can also use an in-browser SQL editor for performing complex queries. Any user who wants to identify the impact of their product from the raw business data can use this tool. 

Features included in this offer:  

  • A rich web interface running Metabase: Open Source 
  • A no-code query building notebook editor 
  • In-browser optimized SQL editor for complex queries 
  • Beautiful interactive visualizations 
  • Ability to create data models 
  • Email configuration and Slack support 
  • Shareability feature 
  • Easy specification for metrics and segments 
  • Feature to download query results in CSV, XLSX and JSON format 

Our instance supports the following major databases: 

  • Druid 
  • PostgreSQL 
  • MySQL 
  • SQL Server 
  • Amazon Redshift 
  • Big Query 
  • Snowflake 
  • Google Analytics 
  • H2 
  • MongoDB 
  • Presto 
  • Spark SQL 
  • SQLite 

Conclusion  

Metabase is a business intelligence software and beneficial for marketing and product managers. By making it possible to share analytics with various teams within an enterprise, Metabase makes it simple for developers to create reports and collaborate on projects. The responsiveness and processing speed are faster than the traditional desktop environment as it uses Microsoft cloud services. 

At Data Science Dojo, we deliver data science education, consulting, and technical services to increase the power of data. We are therefore adding a free Metabase server dedicated specifically for Data Analytics operations on Azure Market Place. Hurry up and install this offer by Data Science Dojo, your ideal companion in your journey to learn data science!  

Click on the button below to head over to the Azure Marketplace and deploy Metabase for FREE by clicking on “Get it now”. 

CTA - Try now

Note: You’ll have to sign up to Azure, for free, if you do not have an existing account. 

Saad Shaikh
| October 21, 2022

Data Science Dojo is offering RStudio for FREE on Azure Marketplace packaged with a pre-installed running version of R alongside other language backends to simplify Data Science. 


What is data science? 


Data Science is one of the quickest-growing areas of work in the industry. According to Harvard Business Review, it’s regarded as the “sexiest job of the 21st century”. 

Data science joins math and measurements, programming, refined analyses, machine learning and AI to reveal significant knowledge concealed in an association’s dataset. These understandings can be utilized to direct businesses in planning and decision making. The lifecycle of Data Science involves data collection (ingestion), data pre-processing and wrangling, predictive data analysis via machine learning and finally communication of outcomes for future strategies. 


Pro Tip: Join our 6-months instructor-led Data Science Bootcamp to master data science. 


Challenges faced by developers 


Individuals who were learning or pursuing Data Science and Machine Learning through R found it difficult to code and develop models using only a terminal or command line interface. Developers who wanted to perform extensive high powered ML operations but didn’t have enough computation power to do it locally was also another challenge.  

In these circumstances an interactive environment configured with R can help the users in gaining hands-on experience with machine learning, data analysis and other statistical operations. 

Working with RStudio 


RStudio is an open-source tool that gives you an effortless coding IDE in the cloud with a pre-installed R programming language to start your data mining and analytics work. It is integrated with a set of modules that make code development, scientific computing, and graphical jobs to be more productive and easier. This tool allows developers to perform a variety of technical tasks such as predictive modeling, clustering, multivariate querying, stock market rate, spam filtering, recommendation systems, malware, and anomaly detection, image recognition, and medical diagnosis. 


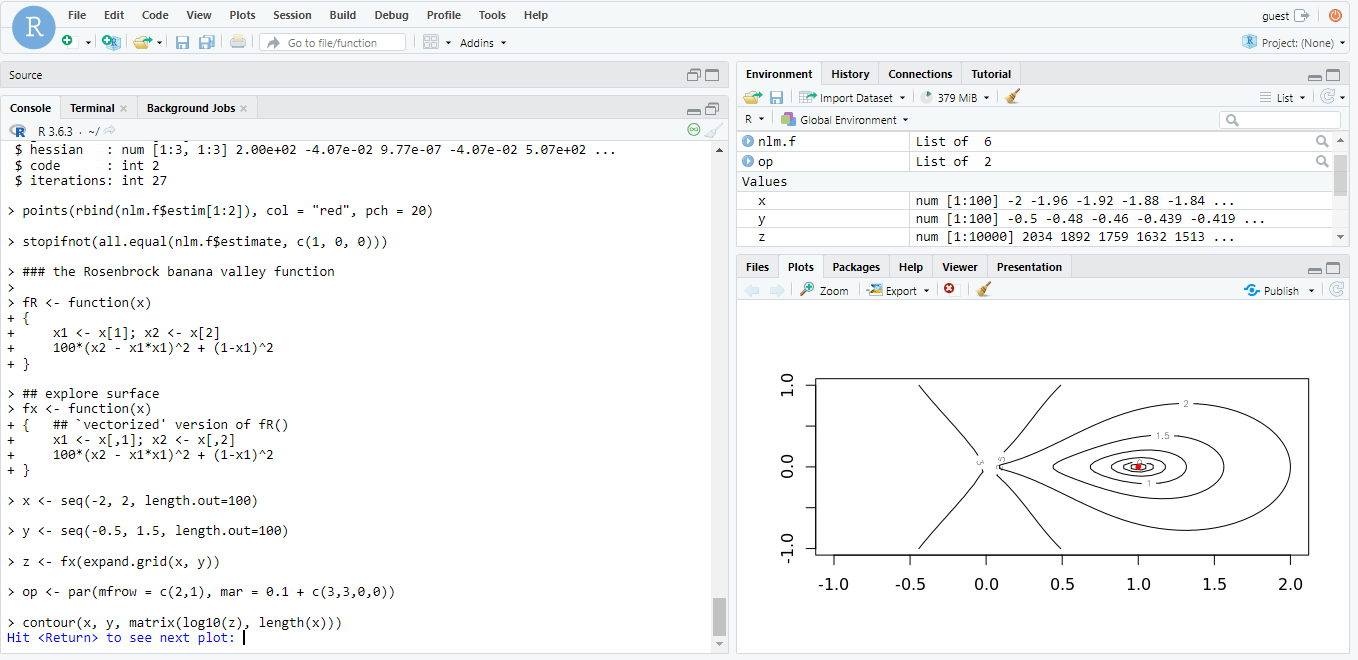
Rstudio -potential for data science
Web interface of RStudio Server executing a demo R function


Key attributes 


  • Provides an in-browser coding environment with syntax suggestions, autocomplete code feature and smart indentation 
  • Provides the user with an easy-to-use free coding platform accessible at the local web server, powered by Azure machines 
  • Apart from the primary built of R, RStudio has support for other famous interpreters as well such as Python, SQL, HTML, CSS, JS, C, Quarto and a few others 
  • In-built debugging functionality by toggling breakpoints to detect and eradicate the issues or fix them quickly 
  • As the computations are carried on Microsoft’s cloud servers, there is no memory or performance pressure on the company’s storage devices 
  • In order to optimize the workload, the RAM and compute power can be scaled accordingly, thanks to Azure services 


What Data Science Dojo has for you 


The RStudio instance packaged by Data Science Dojo provides an in-browser coding environment with a running version of R pre-deployed in it, reducing the burden of installation. With an interactive user-friendly GUI-based application, developers can perform Machine Learning tasks with comfort and flexibility.  

  • A browser based RStudio environment up and running with R pre-deployed 
  • Convenient accessibility and navigation 
  • Ability to work with different language scripts simultaneously 
  • Rich graphics and interactive environment 
  • Support for git and version control 
  • Code consoles to run code interactively, with full support for rich output 
  • Integrated R documentation and user help 
  • Readily available cheat sheets to get started 

Our instance supports the following backends: 

  • R 
  • Python 
  • HTML 
  • CSS 
  • JavaScript 
  • Quarto 
  • C 
  • SQL 
  • Shell 
  • Markdown and Header files 


Conclusion 


RStudio provides customers with an easy-to-use environment to gain hands-on experience with Machine Learning and Data Science. The responsiveness and processing speed are much better than the traditional desktop environment as it uses Microsoft cloud services. It comes with built-in support for git and version control.

Several variants of the R script can be executed in RStudio. It allows users to work on a variety of language backends at the same time with smart observability of variables and values side by side. The documentation and user support are incorporated into the tool to make it easy for developers to code. 

At Data Science Dojo, we deliver data science education, consulting, and technical services to increase the power of data. We are therefore adding a free RStudio instance dedicated specifically to Machine Learning and Data Science on Azure Marketplace. Now hurry up and avail this offer by Data Science Dojo, your ideal companion in your journey to learn data science! 


Click on the button below to head over to the Azure Marketplace and deploy Rstudio for FREE by clicking on “Get it now”.  

CTA - Try now

Note: You’ll have to sign up to Azure, for free, if you do not have an existing account.  


Saad Shaikh
| October 6, 2022

Data Science Dojo is offering SnowSQL for FREE on Azure Marketplace packaged with pre-configured CLI for data manipulation at Snowflake warehouse 


What is Snowflake? 

Snowflake is a cloud computing-based data cloud platform. It is a user-friendly data warehousing product that supports both ETL and ELT functionalities. It supports multiple data workloads from data warehouses and data lakes to enable data storage, data engineering, processing, and analytics. Further, using Snowflake can help you with better data warehouse jobs in the near future.

It is relatively new, flexible, easier and provides a pure cloud SQL based warehouse. It is not created upon any database tech and has a high affordability rate. 

Challenges for developers 

Execution issues while attempting to load and query information, shortcomings in dealing with a variety of data, absence of central source causing conflicting corrupt data, and unfortunate data sharing were a few big obstacles encountered by data engineers and developers to look forward to. 

Therefore, a data cloud warehouse capable of storing variable-length records at vast scale maybe having some fault tolerance or availability or fast processing can reduce the task overhead by a big margin. Not to forget, the data able to be transformed using any standard open-source language would suffice. 

Snowflake: SnowSQL 

Using data engineers’ one of the favorite languages, SQL, developers can now load, transform and unload data at their Snowflake cloud. SnowSQL is an interactive command line scripting-cum-query tool that allows users to perform DML and DDL operations at the CLI level. It is produced with increased protection standards and has strong integration with Snowflake core architecture.

With this tool, you can connect to your Snowflake account and configure your databases, schemas, and warehouses using simple SQL. Users can import existing databases of the data cloud into local machines and then perform various transform operations. It also allows you to unload or dump your transformed data back into the database containers. 

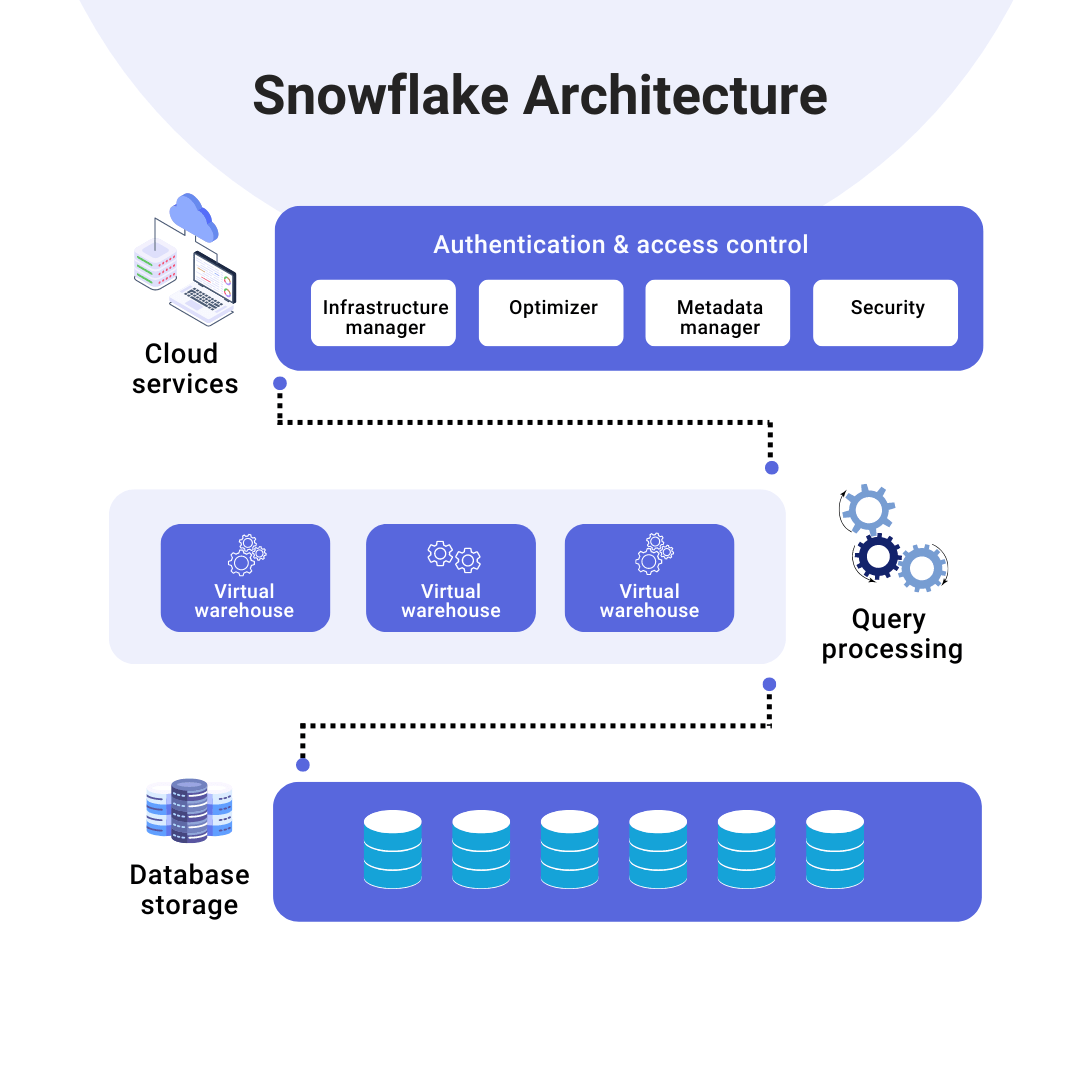
Snowflake architecture - SnowSQL
Snowflake architecture – Data Science Dojo

What we provide 

Snowflake: SnowSQL packaged by Data Science Dojo serves as a pre-installed CLI environment for the Snowflake data cloud so it provides an ease to the developers to perform SQL operations on the data from the warehouse without the burden of installation. Offer listed by Data Science Dojo, provides the following elements: 

  • A Command Line Interface (CLI) installed with SnowSQL which can be connected to your Snowflake account 
  • Support for standard SQL 
  • Robust integrations 
  • Ability load and unload data having CSV, XML, JSON, Avro etc formats 
  • Includes syntax highlighting and auto-complete 

Significant characteristics of SnowSQL 

  • Centralization and Democratization: Snowflake combines warehouses and data lakes into a focal data storage and democratizes it to enable clients for better processing and analytics 
  • Smart Data Handling: Snowflake is able to manage exponential volumes, variety, and velocity of data. Using SnowSQL we can perform ETL and ELT operations using ANSI SQL 
  • Secure and Fault Tolerant: SnowSQL secures connections to Snowflake using TLS with OCSP checks. Your data is available even if one or more nodes go down as source is fault-tolerant 
  • Recovery and Time Travel: The undrop table command is unique as it restores the table back again. The time travel feature allows the recovery of the original version of an object to reverse the updates 
  • High Elastic Performance: With SnowSQL you create multiple virtual warehouses of variable sizes which ensures your ETL process go smoothly 

Conclusion 

SnowSQL leverages the power of Azure services and Snowflake Cloud to load and process large volumes of data with continuous availability, high scalability, and data distribution from the comfort of CLI. In this way, Azure increases the fault tolerance of Snowflake clusters.

The power of Azure ensures maximum performance and high throughput for Snowflake nodes by providing a low latency network. Since SnowSQL mirrors Snowflake which stores and computes data, the elastic nature of the cloud will allow it to load data faster or run a high volume of queries. 

Recovery of data has never been this easy. It also provides optimized query parsing and strong integration. Install the SnowSQL offer now from the Azure Marketplace by Data Science Dojo, your ideal companion in your journey to learn data science! 

Click on the button below to head over to the Azure Marketplace and deploy SnowSQL for FREE by clicking on “Get it now”. 


SnowSQL Package

Note: You’ll have to sign up to Azure, for free, if you do not have an existing account. 


Saad Shaikh
| September 29, 2022

Data Science Dojo is offering DBT for FREE on Azure Marketplace packaged with support for various data warehouses and data lakes to be configured from CLI. 


What does DBT stands for? 

Traditionally, data engineers had to process extensive data available at multiple data clouds in the same available cloud environments. The next task was to migrate the data and then transform it as per the requirements, but Data migration was a task not easy to do so. DBT short for Data Build Tool, allows the analysts and engineers to manipulate massive amounts of data from various significant cloud warehouses to be processed reliably at a single workstation using modular SQL. 

It is basically the “T” in ELT for data transformation in diverse data warehouses. 


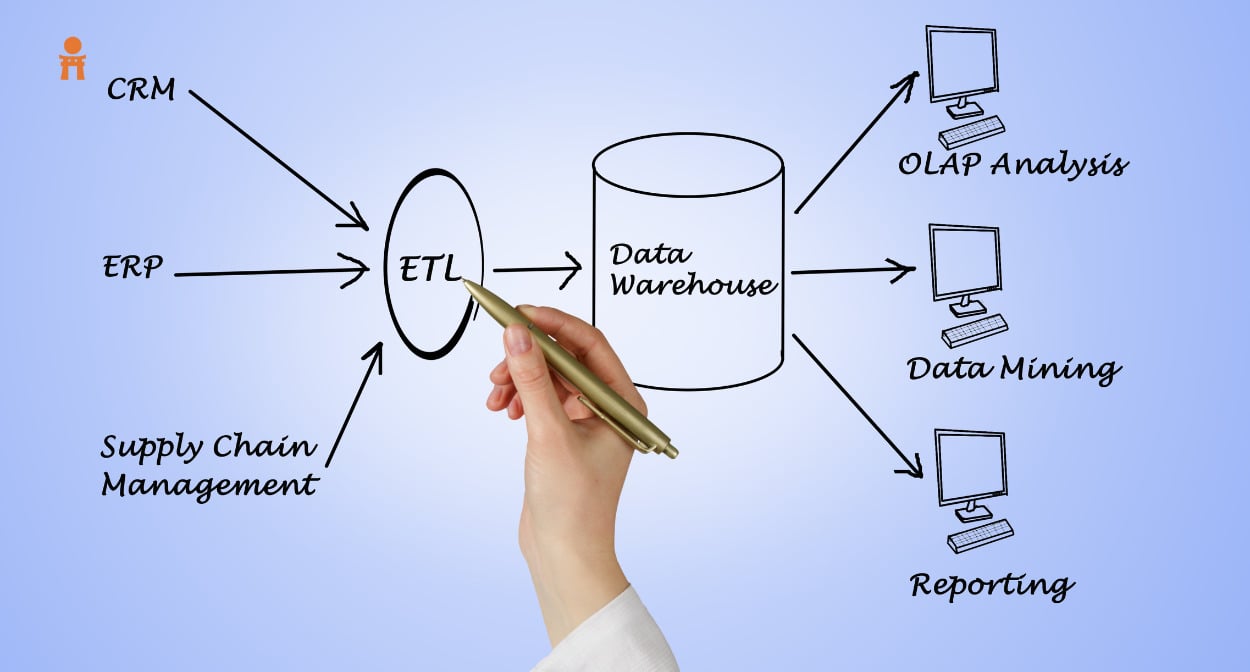
ELT vs ETL – Insights of both terms

Now what do these two terms mean? Have a look at the table below: 


ELT 

ETL 

1.  Stands for Extraction Load Transform  Stands for Extraction Transform Load 
2.  Supports structured, unstructured, semi structured and raw type of data  Requires relational and structured dataset 
3.  New technology, so it’s difficult to find experts or to create data pipelines  Old process, used for over 20 years now 
4.  Dataset is extracted from sources and warehoused in the destination and then transformed  After extraction, data is brought into the staging area where’s its transformed and then loaded into target system 
5.  Quick data loading time because data is integrated at target system once and then transformed  Takes more time as it’s a multistage process involving a staging area for transformation and twice loading operations 


Use cases for ELT 

Since dbt relates closely to ELT process, let’s discuss its use cases: 

  • Associations with huge volumes of information: Meteorological frameworks like weather forecasters gather, examine and utilize a lot of information consistently. Organizations with enormous exchange volumes additionally fall into this classification. The ELT process considers faster exchange of data 
  • Associations needing quick accessibility: Stock trades produce and utilize a lot of data continuously, where postponements can be destructive. 


Challenges for Data Build Tool (DBT)

Data distributed across multiple data centers and the ability to transform those volumes at a single place was a big challenge. 

Then testing and documenting the workflow was another problem. 

Therefore, an engine that could cater to the multiple disjointed data warehouses for data transformation would be suitable for the data engineers. Additionally, testing the complex data pipeline with the same agent would do wonders. 

Working of DBT

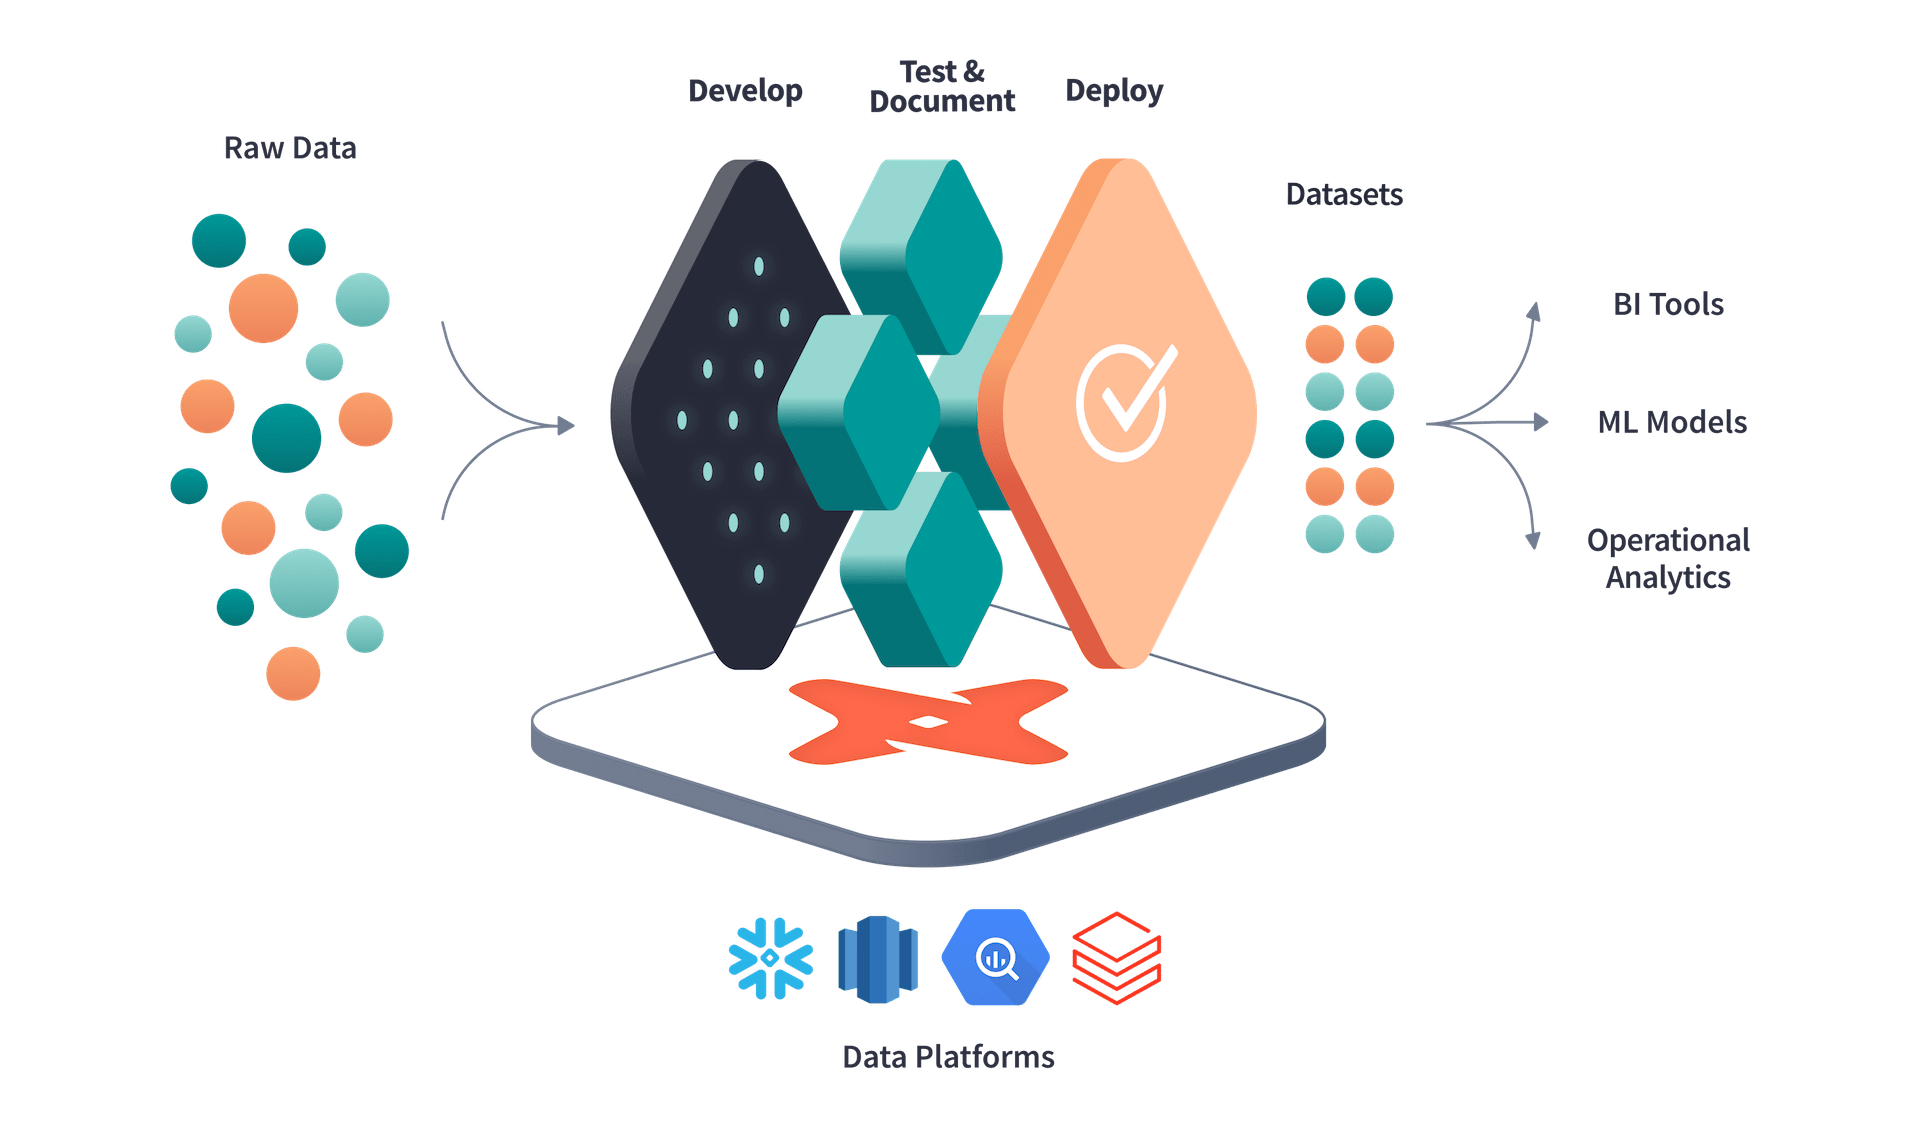
Data Build Tool is a partially open-source platform for transforming and modeling data obtained from your data warehouses all in one place. It allows the usage of simple SQL to manipulate data acquired from different sources. Users can document their files and can generate DAG diagrams thereby identifying the lineage of workflow using dbt docs. Automated tests can be run to detect flaws and missing entries in the data models as well. Ultimately, you can deploy the transformed data model to any other warehouse. DBT serves pleasantly in the cutting-edge information stack and is considered cloud agnostic meaning it operates with several significant cloud environments. 


Analytics engineering DBT

(Picture Courtesy: https://www.getdbt.com/


 Important aspects of DBT

  • DBT enables data analysts with the feasibility to take over the task of data engineers. With modular SQL at hand, analysts can take ownership of data transformation and eventually create visualizations upon it 
  • It’s cloud agnostic which means that DBT can handle multiple significant cloud environments with their warehouses such as BigQuery, Redshift, and Snowflake to process mission-critical data 
  • Users can maintain a profile specifying connections to different data sources along with schema and threads 
  • Users can document their work and can generate DAG diagrams to visualize their workflow 
  • Through the snapshot feature, you can take a copy of your data at any point in time for a variety of reasons such as tracing changes, time intervals, etc. 


What Data Science Dojo has for you 

DBT instance packaged by Data Science Dojo comes with pre-installed plugins which are ready to use from CLI without the burden of installation. It provides the flexibility to connect with different warehouses, load the data, transform it using analysts’ favorite language – SQL and finally deploy it to the data warehouse again or export it to data analysis tools. 

  • Ubuntu VM having dbt Core installed to be used from Command Line Interface (CLI) 
  • Database: PostgreSQL 
  • Support for BigQuery 
  • Support for Redshift 
  • Support for Snowflake 
  • Robust integrations 
  • A web interface at port 8080 is spun up by dbt docs to visualize the documentation and DAG workflow 
  • Several data models as samples are provided after initiating a new project 

This dbt offer is compatible with the following cloud providers: 

  • GCP 
  • Snowflake 
  • AWS 


Disclaimer: The service in consideration is the free open-source version which operates from CLI. The paid features as stated officially by DBT are not endorsed in this offer. 

Conclusion 

Incoherent sources, data consistency problems, and conflicting definitions for measurements and enterprise details lead to disarray, excess endeavors, and unfortunate data being dispersed for decision-making. DBT resolves all these issues. It was built with version control in mind. It has enabled data analysts to take on the role of data engineers. Any developer with good SQL skills is able to operate on the data – this is in fact the beauty of this tool. 

At Data Science Dojo, we deliver data science education, consulting, and technical services to increase the power of data. Therefore, to enhance your data engineering and analysis skills and make the most out of this tool, use the Data Science Bootcamp by Data Science Dojo, your ideal companion in your journey to learn data science! 

Click on the button below to head over to the Azure Marketplace and deploy DBT for FREE by clicking on “Get it now”. 

 Try now - CTA

Note: You’ll have to sign up to Azure, for free, if you do not have an existing account. 

Dave Langer

Feature engineering and data wrangling are key skills for a data scientist. Learn how to accelerate your R coding to deliver more, and better, features.

Earlier this month I had the privilege of traveling to Amsterdam to teach an excellent group of folk’s data science. As is so often the case, I learned as much from the students as they learned from me.

Understanding feature engineering and data wrangling

For example, one of the students asked for some R programming assistance around data wrangling and feature engineering. The scenario in question really intrigued me. I knew how I could solve the problem using traditional non-functional programming techniques (e.g., using loops), but I was looking for something more elegant.

In the hotel that evening I fired up RStudio and started noodling on the problem using my current go-to solution for data wrangling in R – the mighty dplyr package. I had so much fun working through the scenario, here’s some example code from the video showing dplyr in action.

[splus] #====================================================================== 
#Add the new feature for the Title of each passenger 
# 
train <- train %>% 
mutate(Title = str_extract(Name, "[a-zA-Z]+\\.")) table(train$Title)
table(train$Title)
 #====================================================================== 
 #Condense titles down to small subset 
# 
titles.lookup <- data.frame(Title = c("Mr.", "Capt.", "Col.", "Don.", "Dr.",
                                    "Jonkheer.", "Major.", "Rev.", "Sir.",
                                    "Mrs.", "Dona.", "Lady.", "Mme.", "Countess.", 
                                    "Miss.", "Mlle.", "Ms.",
                                    "Master."),
                          New.Title = c(rep("Mr.", 9),
                                        rep("Mrs.", 5),
                                        rep("Miss.", 3),
                                        "Master."),
                                        stringsAsFactors = FALSE)
View(titles.lookup)
#Replace Titles using lookup table 
train <- train %>% 
left_join(titles.lookup, by = "Title") 
View(train) 
train <- train %>% 
mutate(Title = New.Title) %>% 
select(-New.Title) 
View(train) 
[/splus]

Now compare the above elegant (if I do say so myself ;-)) code with the following code from my series:

[splus]
# Expand upon the relationship between `Survived` and `Pclass` by adding the new `Title` variable to the
# data set and then explore a potential 3-dimensional relationship.
# Create a utility function to help with title extraction
extractTitle <- function(name) {
  name <- as.character(name) if (length(grep("Miss.", name)) > 0) {
return ("Miss.")
 } else if (length(grep("Master.", name)) > 0) {
return ("Master.")
} else if (length(grep("Mrs.", name)) > 0) {
return ("Mrs.")
} else if (length(grep("Mr.", name)) > 0) {
return ("Mr.")
} else {
return ("Other")
}
}
titles <- NULL
for (i in 1:nrow(data.combined)) {
 titles <- c(titles, extractTitle(data.combined[i,"name"]))
}
data.combined$title <- as.factor(titles)
# Re-map titles to be more exact
titles[titles %in% c("Dona.", "the")] <- "Lady."
titles[titles %in% c("Ms.", "Mlle.")] <- "Miss."
titles[titles == "Mme."] <- "Mrs."
titles[titles %in% c("Jonkheer.", "Don.")] <- "Sir."
titles[titles %in% c("Col.", "Capt.", "Major.")] <- "Officer"
table(titles)

# Make title a factor
data.combined$new.title <- as.factor(titles)
# Collapse titles based on visual analysis
indexes <- which(data.combined$new.title == "Lady.")
data.combined$new.title[indexes] <- "Mrs."
indexes <- which(data.combined$new.title == "Dr." | 
             data.combined$new.title == "Rev." |
             data.combined$new.title == "Sir." |
             data.combined$new.title == "Officer")
data.combined$new.title[indexes] <- "Mr."

Beautiful!

In our Bootcamp we spend a lot of time emphasizing that in the bulk of scenarios a Data Scientist is best served by focusing their time on Data Wrangling and (most importantly) Feature Engineering. So often quality trumps everything else – algorithm selection, hyperparameter tuning, blending, etc. My work on this video series is aligned to our teachings on the importance of both in R. Hopefully folks get as much out of my new series as I am getting out of making it.

Enjoy and happy data sleuthing!
Data wrangling cheat sheet

Here is a cheat sheet:

Data wrangling-Cheat sheet

Related Topics

Top
Statistics
Programming Language
Podcasts
Machine Learning
High-Tech
Events and Conferences
DSD Insights
Discussions
Development and Operations
Demos
Data Visualization
Data Security
Data Science
Data Engineering
Data Analytics
Computer Vision
Career
Books
Blogs

Finding our reads interesting?

Become a contributor today and share your data science insights with the community

Up for a Weekly Dose of Data Science?

Subscribe to our weekly newsletter & stay up-to-date with current data science news, blogs, and resources.