Data Science Dojo is offering LAMP and LEMP for FREE on Azure Marketplace packaged with pre-installed components for Linux Ubuntu.
What are web stacks?
A complete application development environment is created by solution stacks, which are collections of separate components. These multiple layers in a web solution stack communicate and connect with each other to form a comprehensive system for the developers to create websites with efficiency and flexibility. The compatibility and frequent use of these components together make them suitable for a stack.
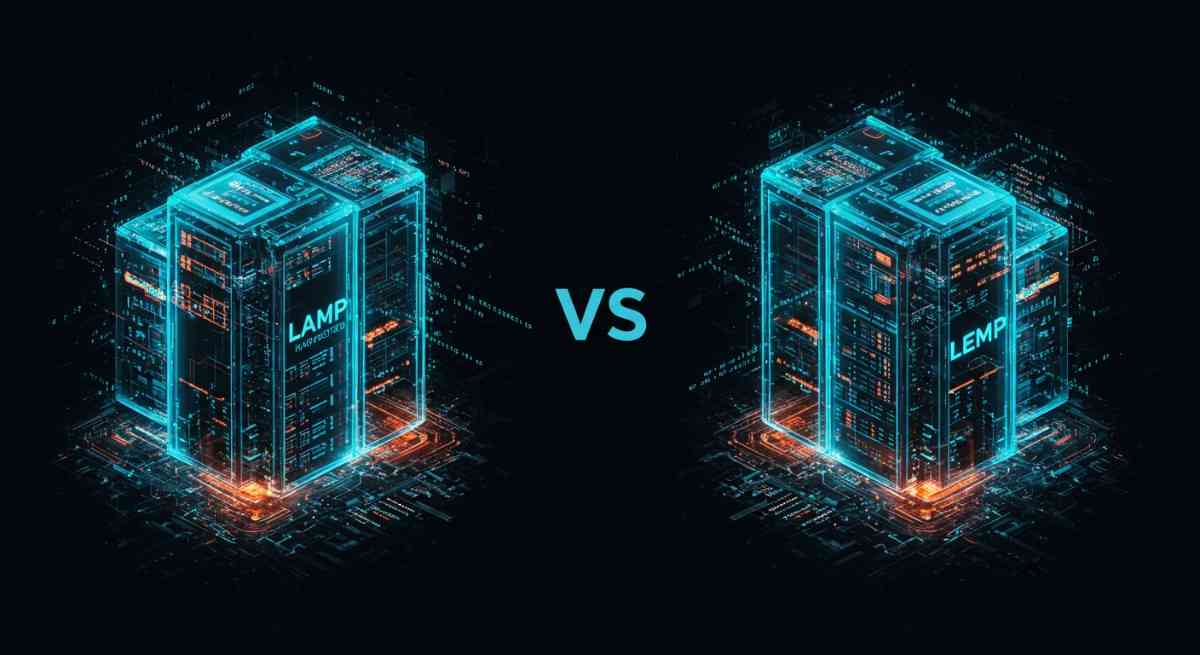
LAMP vs LEMP
Now what do these two terms mean? Have a look at the table below:
|
|
LAMP |
LEMP |
| 1. | Stands for Linux, Apache, MySQL/MariaDB, PHP/Python/Perl | Stands for Linux, Nginx (Engine-X), MySQL/MariaDB, PHP/Python/Perl |
| 2. | Supports Apache2 web server for processing requests over http | Supports Nginx web server to transfer data over http |
| 3. | Can have heavy server configurations | Lightweight reverse proxy Nginx server |
| 4. | World’s first open-source stack for web development | Variation of LAMP, relatively new technology |
| 5. | Process driven design because of Apache | Event driven design because of Nginx |
Pro Tip: Join our 6-months instructor-led Data Science Bootcamp to master data science skills
Challenges faced by web developers
Developers often faced the challenge of optimal integration during web app development. Interoperability and interdependency issues are often encountered during the development and production phase.
Apart from that, the conventional web stack would cause problems sometimes due to the heavy architecture of the web server. Thus, organizational websites had to suffer downtime.
In this scenario, programming a website and managing a database from a single machine, connected to a web server without any interdependency issues, was thought to be an ideal solution which the developers were looking forward to deploy.
Working of LAMP and LEMP
LAMP & LEMP are open-source web stacks packaged with Apache2/Nginx web server, MySQL database, and PHP object-oriented programming language, running together on top of a Linux machine. Both stacks are used for building high-performance web applications. All layers of LAMP and LEMP are optimally compatible with each other, thus both the stacks are excellent if you want to host, serve, and manage web content.
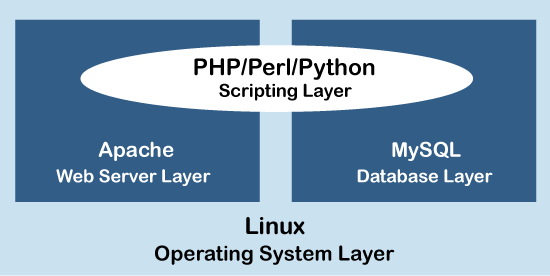
The LEMP architecture has the representation like that of LAMP except replace Apache with Nginx web server.
Major features
- All the layers of LAMP and LEMP have potent connections with no interdependency issues
- They are open-source web stacks. LAMP huge support because of the experienced LAMP community
- Both provide blisteringly fast operability whether its querying, programming, or web server performance
- Both stacks are flexible which means that any open-source tool can be switched out and used against the pre-existing layers
- LEMP focuses on low memory usage and has a lightweight architecture
What Data Science Dojo has for you
LAMP & LEMP offers packaged by Data Science Dojo are open-source web stacks for creating efficient and flexible web applications with all respective components pre-configured without the burden of installation.
- A Linux Ubuntu VM pre-installed with all LAMP/LEMP components
- Database management system of MySQL for creating databases and handling web content
- Apache2/Nginx web server whose job is to process requests and send data via HTTP over the internet
- Support for PHP programming language which is used for fully functional web development
- PhpMyAdmin which can be accessed at http://your_ip/phpmyadmin
- Customizable, meaning users can replace each component with any other alternative open-end software
Conclusion
Both the above discussed stacks on the cloud guarantee high availability as data can be distributed across multiple data centers and availability zones on the go. In this way, Azure increases the fault tolerance of data stored in the stack application. The power of Azure ensures maximum performance and high throughput for the MySQL database by providing low latency for executing complex queries.
Since LEMP/LAMP is designed to create websites, the increase in web-related data can be adequately managed by scaling up. The flexibility, performance, and scalability provided by Azure virtual machine to LAMP/LEMP makes it possible to host, manage, and modify applications of all types despite any traffic.
At Data Science Dojo, we deliver data science education, consulting, and technical services to increase the power of data. Don’t wait to install this offer by Data Science Dojo, your ideal companion in your journey to learn data science!
Note: You’ll have to sign up to Azure, for free, if you do not have an existing account.