In the domain of machine learning, evaluating the performance and results of a classification model is a mandatory step. There are numerous metrics available to get this done.
The ones discussed in this blog are the AUC (Area Under the Curve) and ROC (Receiver Operating Characteristic). It stands out for its effectiveness in measuring the performance of classification models and multi-class classification problems.
The Confusion Matrix
Before diving into the details of the metric AUC-ROC curve, it is imperative that an understanding of the confusion matrix is developed beforehand.
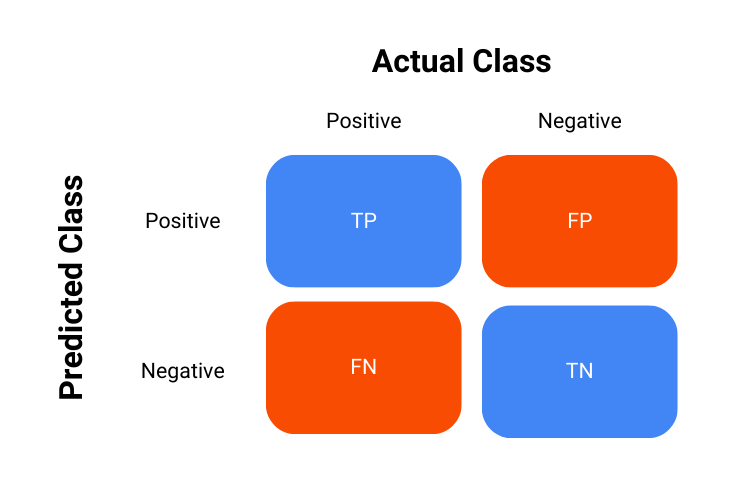
The confusion matrix is a key tool used in the process of evaluating the performance of classification models, it is essentially a table that summarizes the outcomes of the model’s predictions against the actual outcomes – in short, it shows how the model is confused.
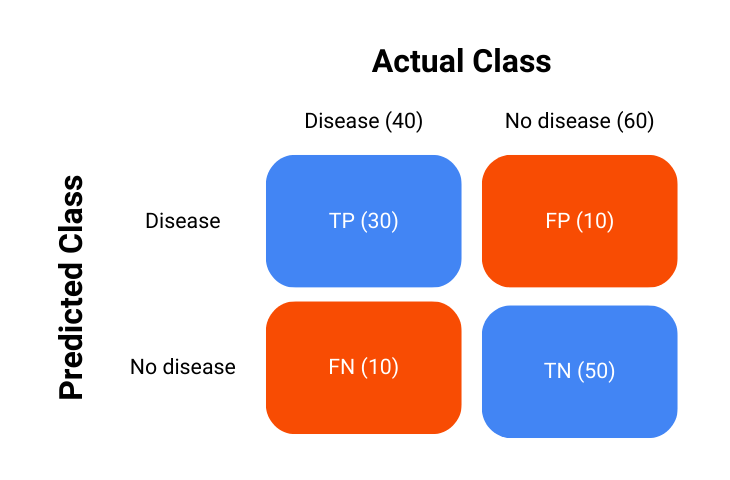
The confusion matrix is represented as follows:
True Positives (TP): Instances where the model correctly predicted the positive class.
True Negatives (TN): Instances where the model correctly predicted the negative class.
False Positives (FP): Instances where the model incorrectly predicted the positive class.
False Negatives (FN): Instances where the model incorrectly predicted the negative class.
Using this confusion matrix, many metrics are derived, and it is also used in the calculation of AUC-ROC which will now be discussed.
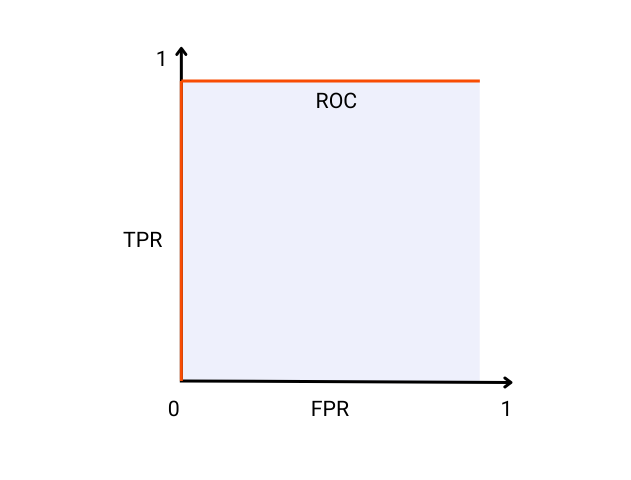
The Receiver Operating Characteristic (ROC) curve is a visual and graphical representation of a classification model’s performance across various thresholds. It is created by first calculating the True Positive Rate (TPR) and False Positive Rate (FPR) at every threshold value and then plotting them against each other.
An ideal model will have a TPR of 1 and an FPR of 0 which ultimately means it did not misclassify any instance in the data and there is perfect separation between the positive and the negative class. A visual representation of such an ideal classification model is shown below:
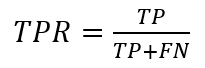
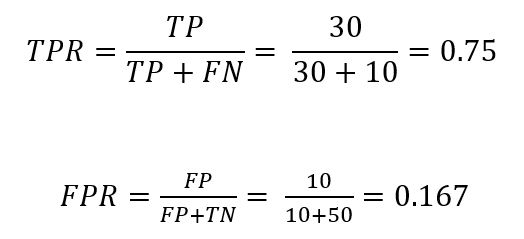
The true positive rate or TPR is calculated as:
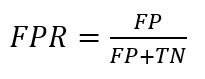
The false positive rate or FPR is calculated as:
Example
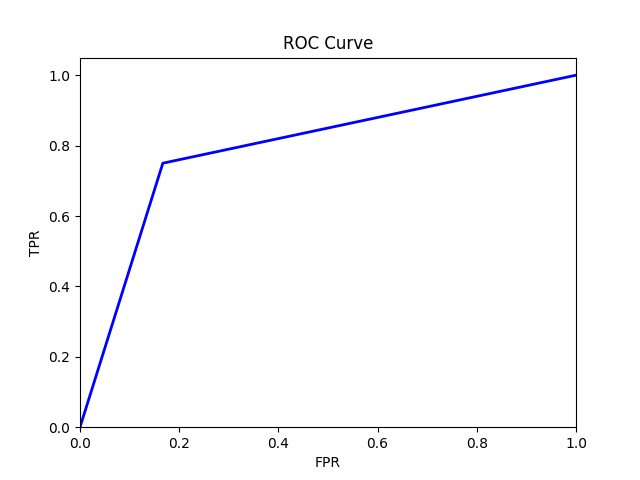
Consider a hypothetical example of a medical test to detect a certain disease. There are 100 patients and 40 of these patients have the disease. We will use this example to create the ROC curve to have an idea other than the ideal model.
Consider that our classification model performed as such:
The calculation of TPR and FPR is carried out as:
The ROC curve will then look something like this:
This plot is plotted using Python and the code for it is as follows:
What is AUC?
The Area Under the Curve (AUC) is also sometimes referred to as the area under the ROC curve. It is a single scalar value that summarizes the performance of a classification model across all threshold values.
It represents the likelihood that the model will rank a randomly chosen positive instance higher than a randomly chosen negative instance.
The ideal model as shown in the ROC curve image has an AUC of 1, which means that there is a 100% probability that the model will correctly rank a randomly chosen positive instance higher than a randomly chosen negative instance.
AUC Interpretation
To understand AUC more intuitively, consider a medical test carried out to detect a disease. An AUC score of 1 would mean that the medical test perfectly separates the healthy and diseased individuals, always giving a higher score to those with the disease.
On the other hand, an AUC score of 0.5 is not better than random guessing or a random chance model that only correctly ranks individuals with the disease half of the time.
In summary:
AUC = 1: Perfect model.
0.5 < AUC < 1: Good model, better than random chance.
AUC = 0.5: Model with no discrimination capability.
AUC < 0.5: Model worse than random chance.
Example with Real-World Data
Consider a dataset with two features, namely “Age” and “Income” and a binary target variable “Default” which shows whether a customer defaults on a loan or not.
ID
Age
Income
Default
1
25
50000
Yes
2
45
100000
No
3
35
75000
No
4
50
120000
Yes
5
23
54000
No
6
48
85000
Yes
7
33
60000
Yes
8
55
130000
No
Model Predictions
Suppose now that we train a logistic regression model and obtain the following probabilities for the “Default” target variable:
ID
Age
Income
Default
Probability
1
25
50000
Yes
0.65
2
45
100000
No
0.40
3
35
75000
No
0.55
4
50
120000
Yes
0.70
5
23
54000
No
0.30
6
48
85000
Yes
0.60
7
33
60000
Yes
0.45
8
55
130000
No
0.35
ROC and AUC Calculation
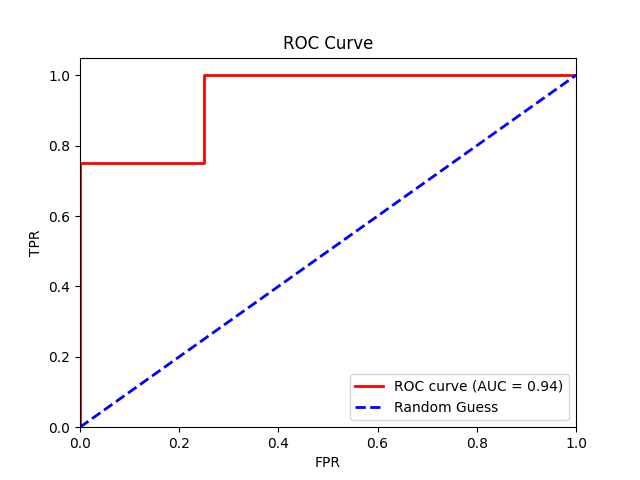
Finally, we plot the TPR against the FPR at different threshold values to create an ROC curve and calculate the AUC score of our model.
From our logistic regression model, we get an AUC of 0.94, indicating near-perfect model performance.
The code for the plot is mentioned below.
Note: Achieving near-perfect model performance is often unrealistic in real-world situations. The high score we saw is probably a result of the small sample size, which might not accurately reflect real-life situations.
Practical Applications
Model Evaluation
The ROC curve and the AUC score are widely used in the evaluation of the performance of classification models, especially when dealing with imbalance datasets.
By understanding and examining the trade-offs between TPR and FPR and identifying which is more relevant to the problem at hand, one can choose the optimal threshold to maximize the model’s effectiveness.
In practice, ROC curves greatly help in the selection of the optimal threshold for classification problems. For example, in medical diagnostics, one might choose a threshold that minimizes false negatives to ensure that fewer instances of the disease are missed, even if it means accepting a higher false positive rate.
Comparing Models
AUC is also a great measure for comparing the performance of two different models. The model with the greater area under the curve or in other words, having a higher AUC is generally preferred as it indicates better overall model performance.
Conclusion
Understanding the nuances of the ROC curve and the AUC score is essential for evaluating the performance of classification models.
These metrics provide a comprehensive picture of the trade-offs between true positive rates and false positive rates at different threshold values, effectively helping data scientists and practitioners make informed decisions about their models.
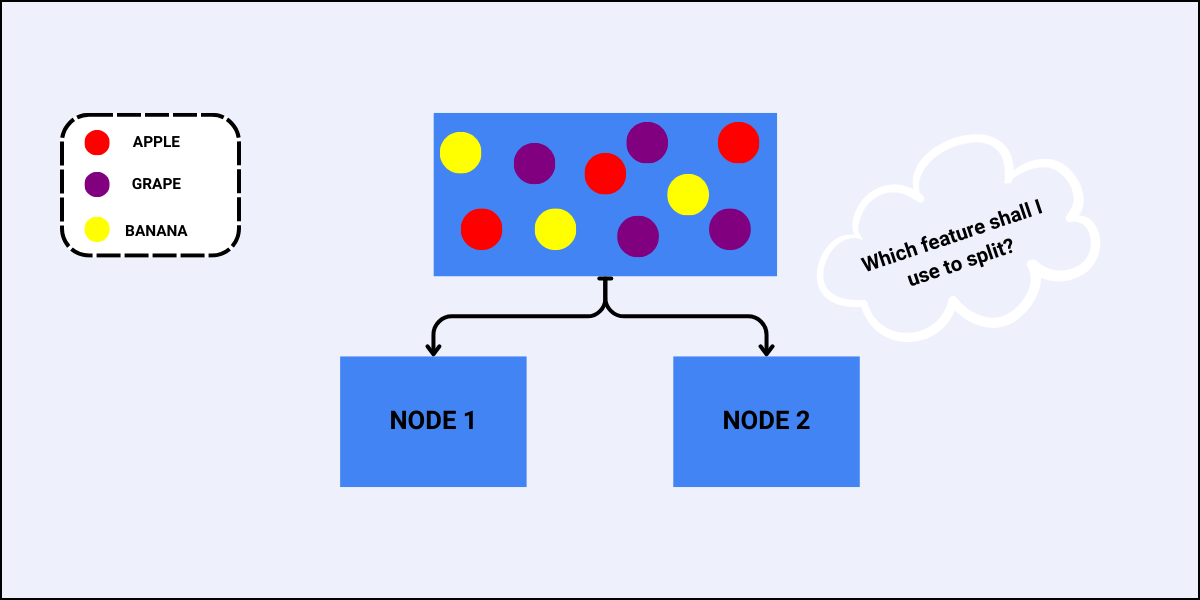
In data science and machine learning, decision trees are powerful models for both classification and regression tasks. They follow a top-down greedy approach to select the best feature for each split. Two fundamental metrics determine the best split at each node – Gini Index and Entropy.
This blog will explore what these metrics are, and how they are used with the help of an example.
What is the Gini Index?
It is a measure of impurity (non-homogeneity) widely used in decision trees. It aims to measure the probability of misclassifying a randomly chosen element from the dataset. The greater the value of the Gini Index, the greater the chances of having misclassifications.
Formula and Calculation
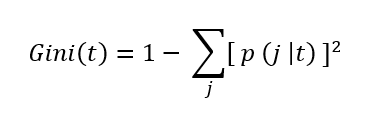
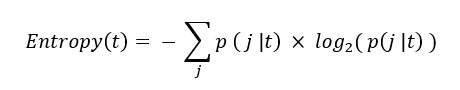
The Gini Index is calculated using the formula:
where p( j | t ) is the relative frequency of class j at node t.
The maximum value is (1 – 1/n) indicating that n classes are equally distributed.
The minimum value is 0 indicating that all records belong to a single class.
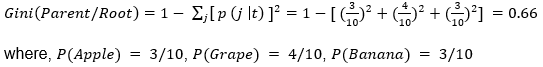
This is also the initial root node of the decision tree, with the Gini Index as:
This result shows that the root node has maximum impurity i.e., the records are equally distributed among all output classes.
Gini Split
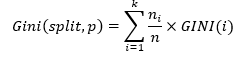
It determines the best feature to use for splitting at each node. It is calculated by taking a weighted sum of the Gini impurities (index) of the sub-nodes created by the split. The feature with the lowest Gini Split value is selected for splitting of the node.
Formula and Calculation
The Gini Split is calculated using the formula:
where
ni represents the number of records at child/sub-node i.
n represents the number of records at node p (parent-node).
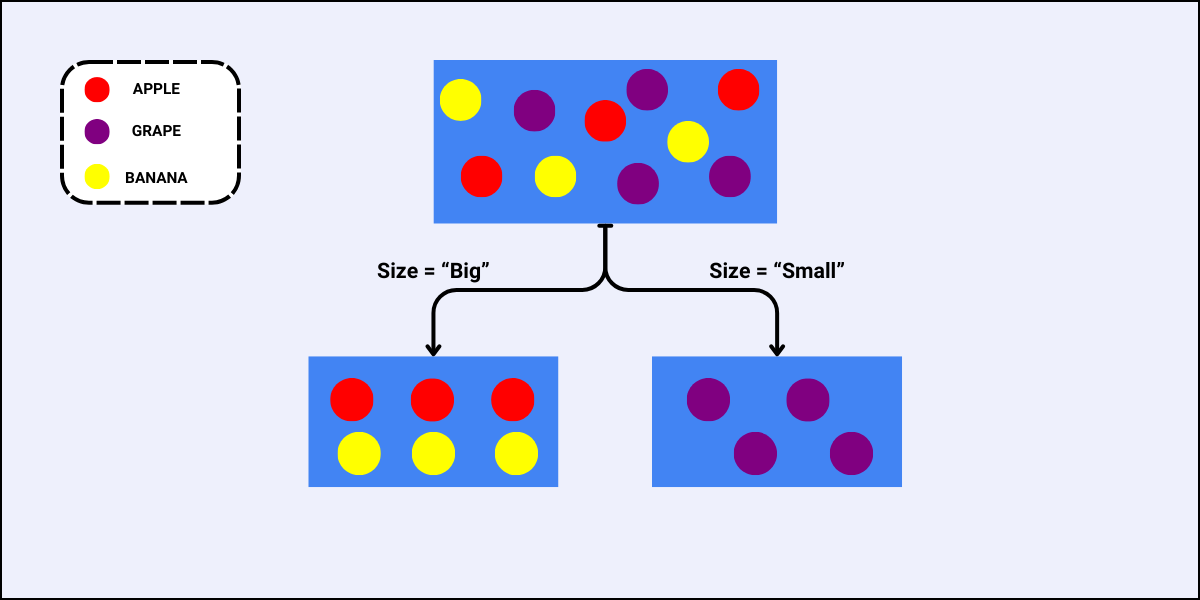
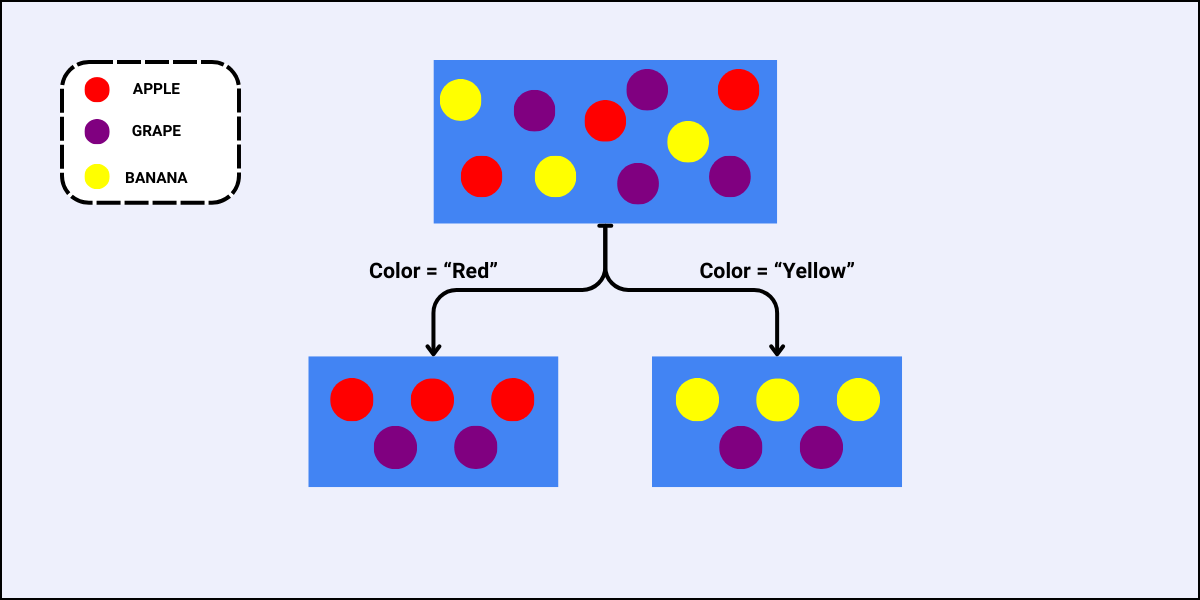
Using the same dataset, we will determine which feature to use to perform the next split.
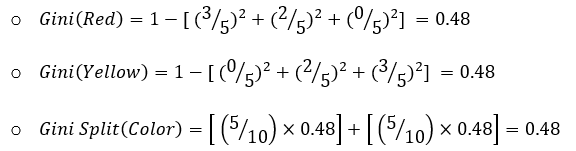
For the feature “Color”, there are two sub-nodes as there are two unique values to split the data with:
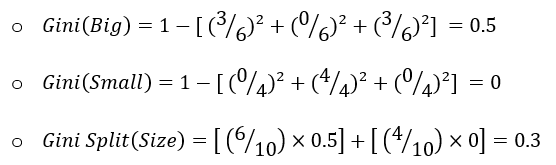
For the feature “Size”, the case is similar as that of the feature “Color”, i.e., there are also two sub-nodes when we split the data using “Size”:
Since the Gini Split for the feature “Size” is less, this is the best feature to select for this split.
What is Entropy?
Entropy is another measure of impurity, and it is used to quantify the state of disorder, randomness, or uncertainty within a set of data. In the context of decision trees, like the Gini Index, it helps in determining how a node should be split to result in sub-nodes that are as pure (homogenous) as possible.
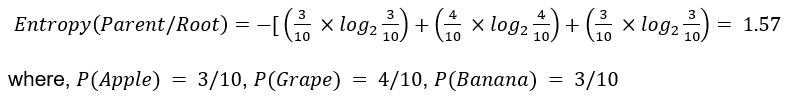
Using the same dataset and table as discussed in the example of the Gini Index, we can calculate the Entropy (impurity) of the root node as:
This result is the same as the results obtained in the Gini Index example i.e., the root node has maximum impurity.
Information Gain
Information Gain’s objective is similar to that of the Gini Split – it aims to determine the best feature for splitting the data at each node. It does this by calculating the reduction in entropy after a node is split into sub-nodes using a particular feature. The feature with the highest information gain is chosen for the node.
Formula and Calculation
The Information Gain is calculated using the formula:
Information Gain = Entropy(Parent Node) – Average Entropy(Children)
where
ni represents the number of records at child/sub-node i.
n represents the number of records at the parent node.
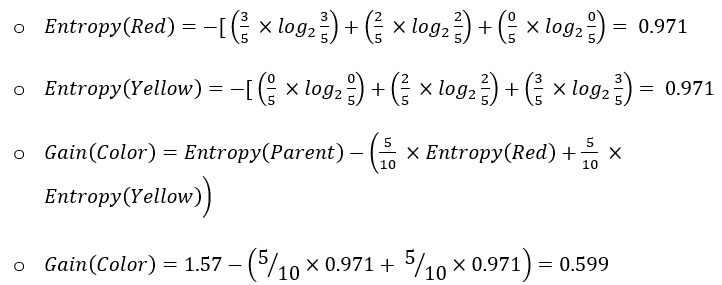
Using the same dataset, we will determine which feature to use to perform the next split:
For the feature “Color”
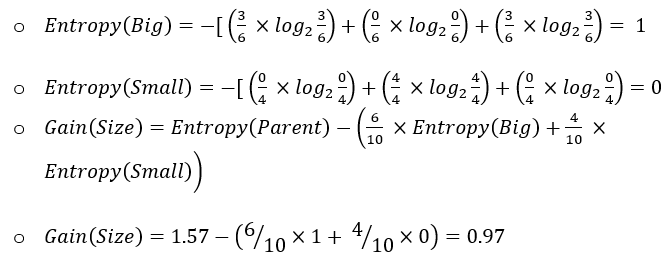
For feature “Size”:
Since the Information Gain of the split using the feature “Size” is high, this feature is the best to select at this node to perform splitting.
Gini Index vs. Entropy
Both metrics are used to determine the best splits in decision trees, but they have some differences:
The Gini Index is computationally simpler and faster to calculate because it is a linear metric.
Entropy considers the distribution of data more comprehensively, but it can be more computationally intensive because it is a logarithmic measure.
Use Cases
The Gini Index is often preferred in practical implementations of decision trees due to its simplicity and speed.
Entropy is more commonly used in theoretical discussions and algorithms like C4.5 and ID3.
Applications in Machine Learning
Decision Trees
Gini Index and Entropy are used widely in decision tree algorithms to select the best feature for splitting the data at each node/level of the decision tree. This helps improve accuracy by selecting and creating more homogeneous and pure sub-nodes.
Random Forests
Random forest algorithms, which are ensembles of decision trees, also use these metrics to improve accuracy and reduce overfitting by determining optimal splits across different trees.
Feature Selection
Both metrics also help in feature selection as they help identify features that provide the most impurity reduction, or in other words, the most information gain, which leads to more efficient and effective models.
Understanding the Gini Index and Entropy metrics is crucial for data scientists and anyone working with decision trees and related algorithms in machine learning. These metrics provide aid in creating splits that lead to more accurate and efficient models by selecting the optimal feature for splitting at each node.
While the Gini Index is often preferred in practice due to its simplicity and speed, Entropy provides a more detailed understanding of the data distribution. Choosing the appropriate metric depends on the specific requirements and details of your problem and machine learning task.
Language models are a recent advanced technology that is blooming more and more as the days go by. These complex algorithms are the backbone upon which our modern technological advancements rest and are doing wonders for natural language communication.
From virtual assistants like Siri and Alexa to personalized recommendations on streaming platforms, chatbots, and language translation services, language models are surely the engines that power it all.
The world we live in relies increasingly on natural language processing (NLP in short) for communication, information retrieval, and decision-making, making the evolution of language models not just a technological advancement but a necessity.
In this blog, we will embark on a journey through the fascinating world of language models and begin by understanding the significance of these models.
But the real star of this narrative will be PaLM 2 vs Llama 2. These are more than just names; they are the cutting edge of NLP. PaLM 2 stands for “Progressive and Adaptive Language Model 2” and Llama 2 is short for “Language Learning and Mastery Algorithm 2”.
In the later sections, we will take a closer look at both these astonishing models by exploring their features and capabilities, and we will also do a comparison of these models by evaluating their performance, strengths, and weaknesses.
By the end of this exploration, we aim to shed light on which models might hold an edge or where they complement each other in the grand landscape of language models.
Before getting into the details of the PaLM 2 and Llama 2 models, we should have an idea of what language models are and what they have achieved for us.
Language Models and their role in NLP
Natural language processing (NLP) is a field of artificial intelligence which is solely dedicated to enabling machines and computers to understand, interpret, generate, and mimic human language.
And language models as we talk about, lie at the center of NLP, they are the heart of NLP and are designed to predict the likelihood of a word or a phrase given the context of a sentence or a series of words. There are two main things or concepts when we talk about language models, they are:
Predictive Power: Language models excel in predicting what comes next in a sequence of words, making them incredibly useful in autocomplete features, language translation, and chatbots.
Statistical Foundation: Most language models are built on statistical principles, analyzing large corpora of text to learn the patterns, syntax, and semantics of human language.
Evolution of Language Models: From Inception to the Present Day
These models have come a very long way since their birth, and their journey can be roughly divided into several generations, where some significant advancements were made in each generation.
First Generation: Early language models used simple statistical techniques like n-grams to predict words based on the previous ones.
Second Generation: The advent of deep learning and neural networks revolutionized language models, giving rise to models like Word2Vec and GloVe, which had the ability to capture semantic relationships between words.
Third Generation: The introduction of recurrent neural networks (RNNs) and Long Short-Term Memory (LSTM) networks allowed models to better handle sequences of text, enabling applications like text generation and sentiment analysis.
Fourth Generation: Transformer models, such as GPT (Generative Pre-trained Transformer), marked a significant and crucial leap forward in technology. These models introduced attention mechanisms, giving them the power to capture long-range dependencies in text and perform tasks ranging from translation to question-answering.
Importance of Recent Advancements in Language Model Technology
The recent advancements in language model technology have been nothing short of revolutionary, and they are transforming the way we used to interact with machines and access information from them. Here are some of the evolutions and advancements:
Broader Applicability: The language models we have today can tackle a wider range of tasks, from summarizing text and generating code to composing poetry and simulating human conversation.
Zero-shot Learning: Some models, like GPT-3 (by OpenAI), have demonstrated the ability to perform tasks with minimal or no task-specific training, showcasing their adaptability.
Multimodal Integration: Language models are also starting to incorporate images, enabling them to understand and generate text based on visual content.
This was all for a brief introduction into the world of language models and how they have evolved over the years, understanding these foundations of language models is essential as now we will be diving deeper into the latest innovations of PaLM 2 and Llama 2.
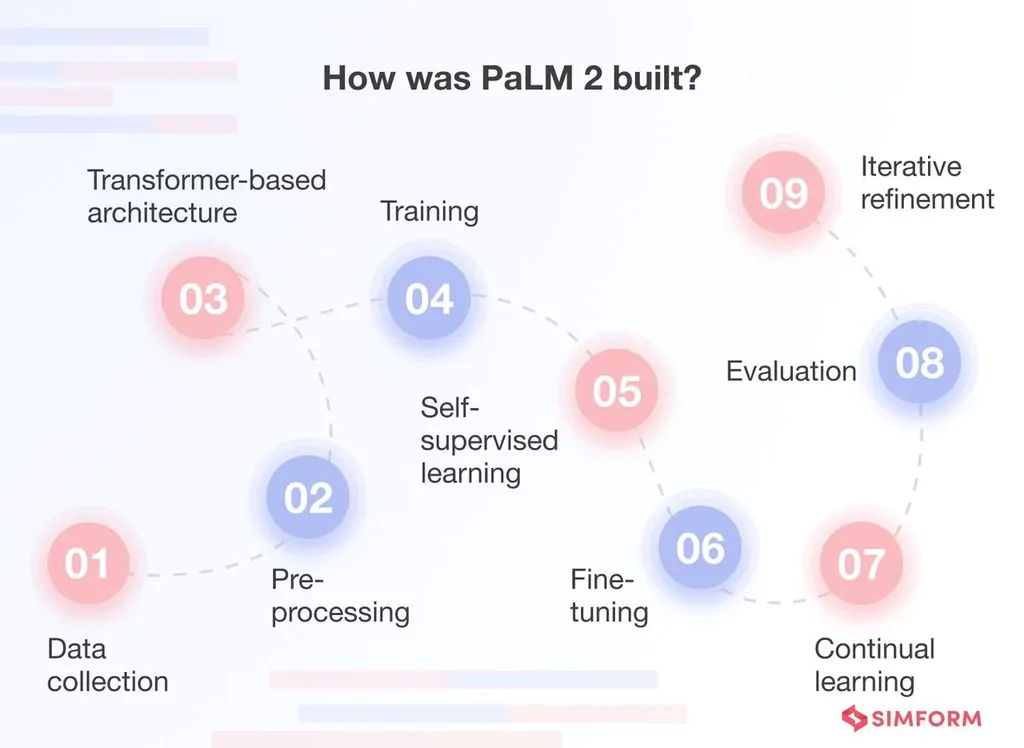
Introducing PaLM 2
The term PaLM 2 as mentioned before is short for “Progressive and Adaptive Language Model 2”, and it is a groundbreaking language model which takes us to the next step in the evolution of NLP. Acquiring the knowledge of the successes from its predecessor models, PaLM model aims to push the boundaries of what’s possible in natural language generation, understanding and interpretation.
source: simform.com
Key Features and Capabilities of PaLM 2:
PaLM 2 is not just another language model; it’s a groundbreaking innovation in the world of natural language processing and boasts a wide range of remarkable features and capabilities that sets it far apart from its predecessor models. Here, we’ll explore the distinctive features and attributes that make PaLM 2 stand out in the ever-competitive landscape of language models:
Progressive Learning:
This model has the power to continually learn and adapt to changing language patterns, which in turn, ensures its relevance in a dynamic linguistic landscape. This ability of adaptability makes it well-suited for applications where language evolves rapidly, such as social media and online trends.
Multimodal Integration:
The model can seamlessly integrate text and visual information, revealing many new possibilities in tasks that require a deep understanding of both textual and visual content. This feature is invaluable and priceless in fields like image captioning and content generation.
PaLM 2 demonstrates impressive few-shot and zero-shot learning abilities, which allows it to perform tasks with minimal examples or no explicit training data. This versatility makes it a valuable tool for a wide range of industries and applications. This feature reduces the time and resources needed for model adaptation.
Scalability:
The model’s architecture is extremely efficient and is designed to scale efficiently, accommodating large datasets and high-performance computing environments. This scalability is essential for handling the massive volumes of text and data generated daily on the internet.
Ethical Considerations:
PaLM 2 also incorporates ethical guidelines and safeguards to address concerns about misinformation, bias, and inappropriate content generation. The developers have taken a proactive stance to ensure responsible AI practices are embedded in PaLM 2’s functionality.
Real-World Applications and Use Cases of PaLM 2:
The features and capabilities of PaLM 2’s model extends to a myriad of real-world applications, revolutionizing and changing the way we interact with technology. You can see below some of the real-world applications for which this model has shown amazing wonders:
Content ceneration: Content creators can leverage PaLM 2 to automate content generation, from writing news articles and product descriptions to crafting creative marketing copy.
Customer support: PaLM 2 can power chatbots and virtual assistants, enhancing customer support by providing quick and accurate responses to the user inquiries.
Language translation: Its multilingual proficiency makes it a valuable tool for translation services, enabling seamless communication across language barriers.
Healthcare and research: In the medical field, PaLM 2 can assist in analyzing medical literature, generating reports, and even suggesting treatment options based on the latest research.
Education: PaLM 2 can play a role in personalized education by creating tailored learning materials and providing explanations for complex topics.
With its progressive learning, dynamic adaptability, multimodal integration, mastery of few-shot and zero-shot learning, scalability, real-time applicability, and ethical consciousness, PaLM 2 has redefined the way we used to interact with and harnessed the power of language models.
Its ability to evolve and adapt in real-time, coupled with its ethical safeguards, sets it apart as a versatile and responsible solution for a wide array of industries and applications.
Meet Llama 2:
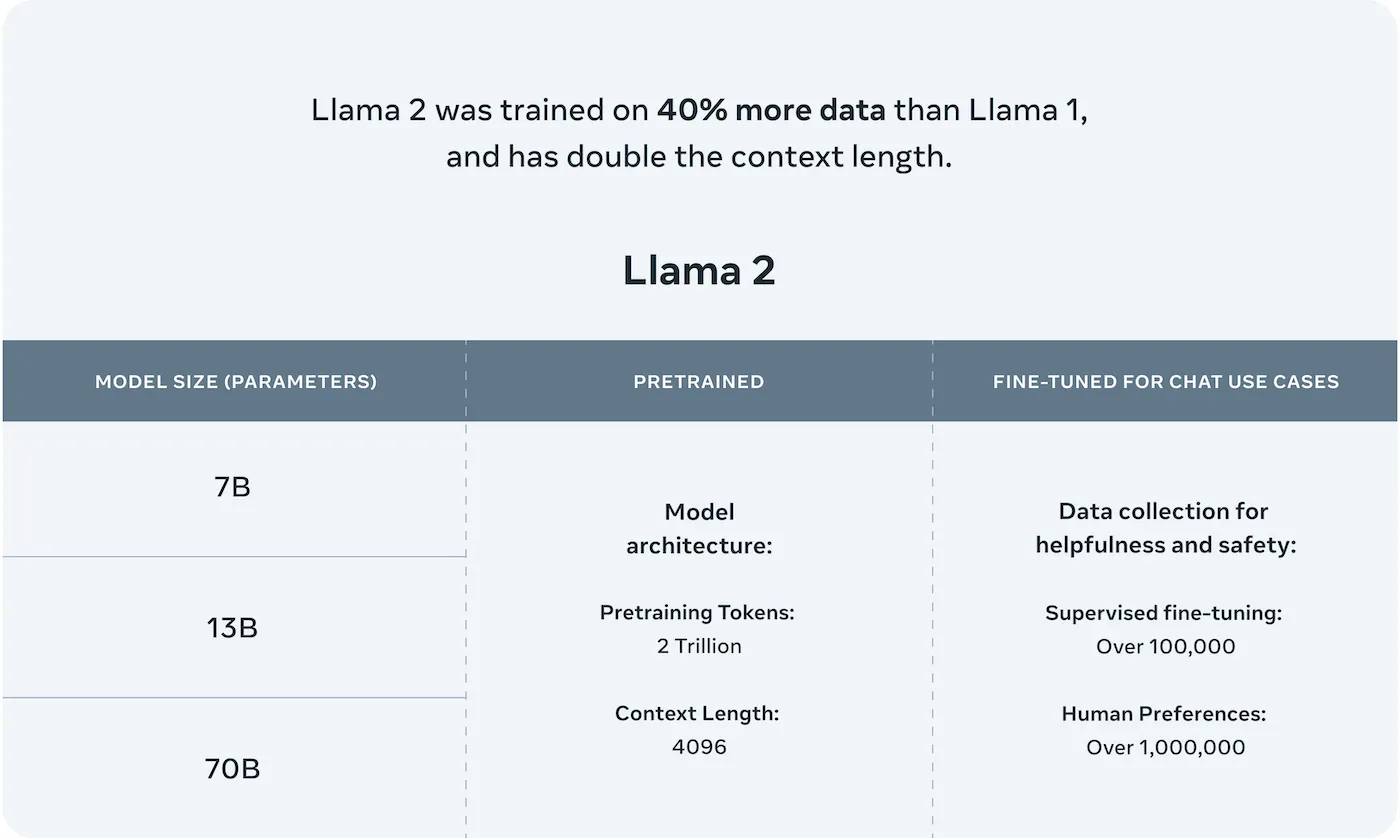
Let’s talk about Llama 2 now, that is short for “Language Learning and Mastery Algorithm 2” and emerges as a pivotal player in the realm of language models. The model has been built upon the foundations laid by its predecessor model known as Llama. It is another one of the latest advanced models and introduces a host of enhancements and innovations poised to redefine the boundaries of natural language understanding and generation.
source: llama.com
Key Features and Capabilities of Llama 2:
Beyond its impressive features, Llama 2 unveils a range of unique qualities that distinguish it as an exceptional contender in the world of language models. It distinguishes itself through its unique features and capabilities and here, we will discuss and highlight some of them briefly:
Semantic mastery: Llama 2 exhibits an exceptional grasp of semantics, allowing it to comprehend context and nuances in language with a depth that closely resembles human understanding and interpretation. This profound linguistic feature makes it a powerful tool for generating contextually relevant text.
Interdisciplinary proficiency: One of Llama 2’s standout attributes is its versatility across diverse domains, applications, and industries. Its adaptability renders it well-suited for a multitude of applications, spanning from medical research and legal documentation to creative content generation.
Multi-Language competence: The advanced model showcases an impressive multilingual proficiency, transcending language barriers to provide precise, accurate, context-aware translations and insights across a wide spectrum of languages. This feature greatly enables fostering global communication and collaboration.
Conversational excellence: Llama 2 also excels in the realm of human-computer conversation. Its ability to understand conversational cues, context switches, and generate responses with a human touch makes it invaluable for applications like chatbots, virtual assistants, and customer support.
Interdisciplinary collaboration: Another amazing aspect of Llama 2 is interdisciplinary collaboration as this model bridges the gap between technical and non-technical experts. This enables professionals from different fields to leverage the model’s capabilities effectively for their respective domains.
Ethical focus: Like PaLM 2, Llama 2 also embeds ethical guidelines and safeguards into its functioning to ensure responsible and unbiased language processing, addressing the ethical concerns associated with AI-driven language models.
The adaptability and capabilities of Llama 2 extend across a plethora of real-world scenarios, ushering in transformative possibilities for our interaction with language and technology. Here are some domains in which Llama 2 excels with proficiency:
Advanced healthcare assistance: In the healthcare sector, Llama 2 lends valuable support to medical professionals by extracting insights from complex medical literature, generating detailed patient reports, and assisting in intricate diagnosis processes.
Legal and compliance support: Legal practitioners also benefit from Llama 2’s capacity to analyze legal documents, generate precise contracts, and ensure compliance through its thorough understanding of legal language.
Creative content generation: Content creators and marketers harness Llama 2’s semantic mastery to craft engaging content, compelling advertisements, and product descriptions that resonate with their target audience.
Multilingual communication: In an increasingly interconnected and socially evolving world, Llama 2 facilitates seamless multilingual communication, offering accurate translations and promoting international cooperation and understanding.
In summary, Llama 2, emerges as a transformative force in the realm of language models. With its profound grasp of semantics, interdisciplinary proficiency, multilingual competence, conversational excellence, and a host of unique attributes, Llama 2 sets new standards in natural language understanding and generation.
Its adaptability across diverse domains and unwavering commitment to ethical considerations make it a versatile and responsible solution for a myriad of real-world applications, from healthcare and law to creative content generation and fostering global communication.
PaLM 2 vs Llama 2
Now we know that both PaLM 2 and LLaMA 2 are shaping the future of AI, powering applications ranging from chatbots to content generation. But how do they compare in terms of performance, accuracy, efficiency, and scalability? Let’s dive into their strengths and weaknesses and analyze how they stand against each other.
1. Performance Metrics and Benchmarks
Both PaLM 2 and LLaMA 2 have undergone rigorous benchmarking on various natural language processing (NLP) tasks, including text generation, reasoning, and multilingual understanding.
PaLM 2 has been trained on a massive 540 billion parameters, giving it exceptional depth in reasoning and understanding across complex queries.
LLaMA 2, while significantly smaller at 70 billion parameters, has been optimized for efficiency, making it highly competitive despite its reduced size.
Both models were trained on 560 billion words, ensuring a vast knowledge base, but their training objectives and optimizations impact their real-world performance differently.
Benchmark tests indicate that:
PaLM 2 excels in tasks requiring logical reasoning, problem-solving, and multilingual fluency.
LLaMA 2 performs strongly in context understanding, conversational AI, and computational efficiency.
2. Strengths and Weaknesses
Feature
PaLM 2
LLaMA 2
Accuracy
Higher accuracy in complex reasoning, coding, and multilingual tasks.
Strong accuracy in dialogue and context understanding but slightly less refined for complex reasoning.
Efficiency
Requires extensive computational power due to its large size.
More efficient and accessible due to its smaller size while maintaining competitive performance.
Scalability
Best suited for enterprise-level AI applications that demand high computational resources.
Easier to scale for research and open-source projects due to lower resource requirements.
Multilingual Capabilities
Strong multilingual support with improved fluency in various languages.
Good multilingual support but may not match PaLM 2’s fluency in low-resource languages.
3. Accuracy, Efficiency, and Scalability
Accuracy
PaLM 2 has a superior grasp of logical reasoning, structured tasks, and multilingual comprehension, making it highly effective for content generation and AI research.
LLaMA 2 delivers strong contextual understanding and conversational capabilities, excelling in chatbot and dialogue-based applications.
Efficiency
PaLM 2 is more computationally demanding due to its larger model size and complexity.
LLaMA 2 is significantly lighter and optimized for efficiency, making it more accessible for developers with limited computing power.
PaLM 2 is better suited for large-scale AI deployments, requiring advanced infrastructure.
LLaMA 2, with its open-source nature, allows for greater adaptability and customization, making it ideal for AI research and decentralized applications.
4. User Experiences and Feedback
User feedback highlights the following:
PaLM 2 is favored by enterprises and AI developers for its high accuracy and multilingual capabilities, but its computational demands can be a barrier.
LLaMA 2 is widely praised for its open-source accessibility, efficiency, and strong contextual understanding, making it popular in research and smaller-scale AI projects.
Conclusion:
In conclusion, both PaLM 2 and Llama 2 stand as pioneering language models with the capacity to reshape our interaction with technology and address critical global challenges.
PaLM 2, possessing greater power and versatility, boasts an extensive array of capabilities and excels at adapting to novel scenarios and acquiring new skills. Nevertheless, it comes with the complexity and cost of training and deployment.
On the other hand, Llama 2, while smaller and simpler, still demonstrates impressive capabilities. It shines in generating imaginative and informative content, all while maintaining cost-effective training and deployment.
The choice between these models hinges on the specific application at hand. For those seeking a multifaceted, safe model for various tasks, PaLM 2 is a solid pick. If the goal is a creative and informative content generation, Llama 2 is the ideal choice. Both PaLM 2 and Llama 2 remain in active development, promising continuous enhancements in their capabilities. These models signify the future of natural language processing, holding the potential to catalyze transformative change on a global scale.
Unlock the full potential of your data with the power of data visualization! Go through this blog and discover why visualizations are crucial in Data Science and explore the most effective and game-changing types of visualizations that will revolutionize the way you interpret and extract insights from your data. Get ready to take your data analysis skills to the next level!
What are Data Visualizations?
Data visualizations involve using different charts, graphs, and other visual elements to represent data and information graphically and the purpose of it is to make complex and hard to understand and complex datasets easily understandable, accessible, and interpretable.
This powerful tool enables businesses to explore, analyze and identify trends, patterns and relationships from the raw data that are usually hidden by just looking at the data itself or its statistics.
By mastering the ability of data visualization, businesses and organizations can make effective and important decisions and actions based on the data and the insights gained. These decisions are additionally referred to as ‘Data-Driven Decisions’. By presenting data in a visual format, analysts can effectively communicate their findings to their team and to their clients, which is a challenging task as clients sometimes can’t interpret raw data and need a medium that they can interpret easily.
Importance of Data Visualization
Here is a list of some benefits data visualization offers that make us understand its importance and its usefulness:
1. Simplifying complex data: It enables complex data to be presented in a simplified and understandable manner. By using visual representations such as graphs and charts, data can be made more accessible to individuals who are not familiar with the underlying data.
2. Enhancing insights: It can help to identify patterns and trends that might not be immediately apparent from raw data. By presenting data visually, it is easier to identify correlations and relationships between variables, enabling analysts to draw insights and make more informed decisions.
3. Enhanced communication: It makes it easier to communicate complex data to a wider audience, including non-technical stakeholders in a way that is easy to understand and engage with. Visualizations can be used to tell a story, convey complex information, and facilitate collaboration among stakeholders, team members, and decision makers.
4. Increasing efficiency: It can save time and increase efficiency by enabling analysts to quickly identify patterns and relationships in raw data. This can help to streamline the analysis process and enable analysts to focus their efforts on areas that are most likely to yield insights.
5.Identifying anomalies and errors: It can help to identify errors or anomalies in the data. By presenting data visually, it is easier to spot outliers or unusual patterns that might indicate errors in data collection or processing. This can help analysts to clean and refine the data, ensuring that the insights derived from the data are accurate and reliable.
6.Faster and more effective decision-making: It can help you make more informed and data-driven decisions by presenting information in a way that is easy to digest and interpret. Visualizations can help you identify key trends, outliers, and insights that can inform your decision-making, leading to faster and more effective outcomes.
7. Improved data exploration and analysis:It enables you to explore and analyze your data in a more intuitive and interactive way. By visualizing data in different formats and at different levels of detail, you can gain new insights and identify areas for further exploration and analysis.
Choosing the Right Type of Visualization
This is the only challenge faced when working with data visualizations, and to master this skill completely, you must have a clear idea about choosing the right type of visual for creating amazing, clear, attractive, and pleasing visuals. Keeping the following points in mind will help you in this:
Identify Purpose
The first and most crucial step in choosing the right visualization is clearly identifying why you’re creating it. Are you trying to compare values, show relationships, highlight distributions, or illustrate compositions? Each of these goals aligns best with a specific type of chart or graph.
For example:
If your goal is to compare categories, a bar chart may work best.
To show how something changes over time, a line chart might be more appropriate.
If you’re highlighting the proportion of parts to a whole, consider using a pie chart or stacked bar chart.
When you’re interested in patterns or relationships between variables, scatter plots or bubble charts can provide more insight.
Being clear about your objective from the start will prevent miscommunication and make your visual more impactful and efficient.
Understanding Audience
Knowing your audience is just as important as understanding your data. Your audience’s background, familiarity with the topic, and their expectations all influence how your visual should be designed.
A non-technical audience, such as clients or stakeholders, might prefer simplified visuals like bar charts or infographics with minimal jargon.
Consider whether your audience will view the visualization on a small screen, in a presentation, or as part of a report—this impacts layout, detail, and interactivity.
Tailoring your visuals to your audience ensures that the message is not only understood but also resonates with them. Remember, the best visuals bridge the gap between data and decision-making by speaking the audience’s language.
Selecting the Appropriate Visual
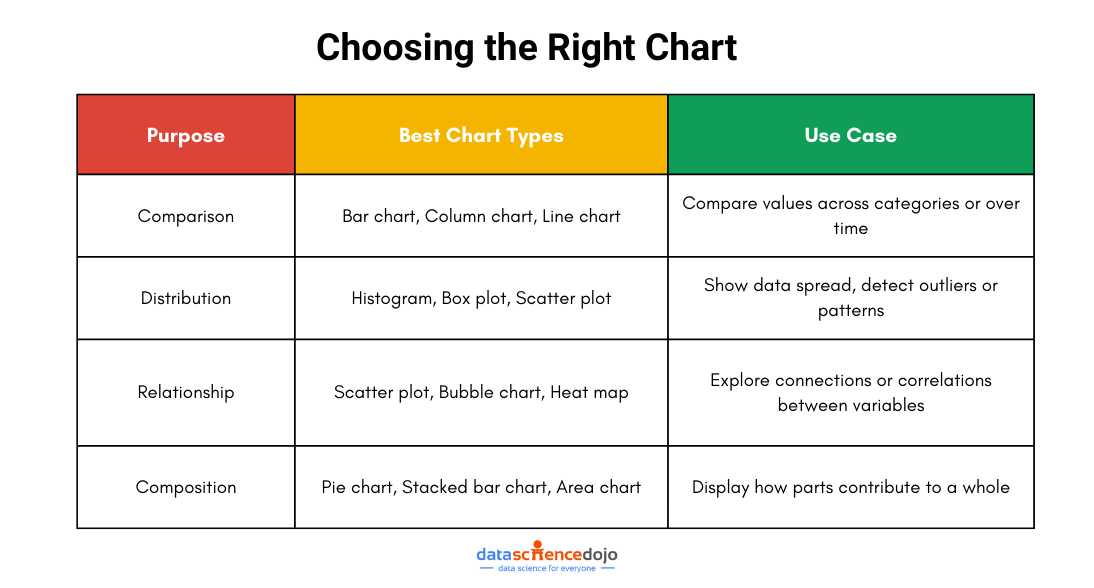
Once you have clearly defined your purpose and understand your audience, the next step is to choose the most suitable visualization to convey your insights. The right type of visual ensures that your data story is both meaningful and easy to grasp. Here are some common categories of data visualizations and when to use them:
Comparison Charts: These charts are ideal when you want to compare values across different groups or categories. Use them when you’re analyzing trends, changes over time, or differences between entities. Common examples include bar charts, column charts, and line charts.
Distribution Charts: If your goal is to understand the spread or range of your data, distribution charts are the way to go. They help you spot patterns, outliers, and the overall shape of your data. Histograms, box plots, and scatter plots fall under this category.
Relationship Charts: These visuals are used to reveal the correlation or connection between two or more variables. They are especially helpful in uncovering trends or associations. Scatter plots, bubble charts, and heat maps are commonly used for this purpose.
Composition Charts: When your data represents parts of a whole, composition charts help break it down. They show how different segments contribute to the total. Pie charts, stacked bar charts, and area charts are typical examples.
Choosing the right chart type is not just a technical step—it’s a storytelling decision. When done right, your visual not only looks good but also delivers insights in a clear and engaging way.
Ethics of Data Visualization
In many cases, data visualization may also be used to misinterpret information intentionally or unintentionally. An example includes manipulating data by using specific scales or omitting specific data points to support a particular narrative and not showing the actual view of the data. Some considerations regarding the ethics of data visualization include:
Accuracy of data: Data should be accurate and should not be presented in a way to misinterpret information.
Appropriateness of visualization type: The type of visual selected should be appropriate for the data being presented and the message being conveyed.
Clarity of message: The message conveyed through visualization should be clear and easy to understand.
Avoiding bias and discrimination: Each data visualization should be clear of bias and discrimination.
Avoiding Misleading Representations
You want to represent your data in the most efficient way possible which can be easily interpreted and free of ambiguities, now that’s not always the case, there are times when your data can mislead your visualization and convey the wrong message. In those cases, you can take help from the following points to avoid misleadingness:
Use consistent scales and axes in your charts and graphs.
Avoid using truncated axes and skewed data ranges which cause data to appear less significant.
Label your data points and axes properly for clarity.
Avoid cherry-picking the data to support a particular narrative.
Provide clear and concise context for the data you are presenting.
Types of Data Visualizations
There are numerous visualizations available, each with its own use and importance, and the choice of a visual depends on your need i.e., what kind of data you want to analyze, and what type of insight are you looking for. Nonetheless, here are some most common visuals used in data science:
Bar Charts:Bar charts are normally used to compare categorical data, such as the frequency or proportion of different categories. They are used to visualize data that can be organized or split into different discrete groups or categories.
Line Graphs: Line graphs are a type of visualization that uses lines to represent data values. They are typically used to represent continuous data.
Scatter Plots: Scatter plot is a type of data visualization that displays the relationship between two quantitative (numerical) variables. They are used to explore and analyze the correlation or association between two continuous variables.
Histograms: A histogram graph represents the distribution of a continuous numerical variable by dividing it into intervals and counting the number of observations. They are used to visualize the shape and spread of data.
Heatmaps:Heatmaps are commonly used to show the relationships between two variables, such as the correlation between different features in a dataset.
Box and Whisker Plots:They are also known as boxplots and are used to display the distribution of a dataset. A box plot consists of a box that spans the first quartile (Q1) to the third quartile (Q3) of the data, with a line inside the box representing the median.
Count Plots:A count plot is a type of bar chart that displays the number of occurrences of a categorical variable. The x-axis represents the categories, and the y-axis represents the count or frequency of each category.
Point Plots: A point plot is a type of line graph that displays the mean (or median) of a continuous variable for each level of a categorical variable. They are useful for comparing the values of a continuous variable across different levels.
Choropleth Maps:Choropleth map is a type of geographical visualization that uses color to represent data values for different geographic regions, such as countries, states, or counties.
Tree Maps:This visualization is used to display hierarchical data as nested rectangles, with each rectangle representing a node in the hierarchy. Treemaps are useful for visualizing complex hierarchical data in a way that highlights the relative sizes and values of different nodes.
Conclusion
So, this blog was all about introducing you to this powerful tool in the world of data science. Now you have a clear idea about what data visualization is, and what is its importance for analysts, businesses, and stakeholders.
You also learned about how you can choose the right type of visual, the ethics of data visualization and got familiar with 10 new different data visualizations and how they look like. The next step for you is to learn about how you can create these visuals using Python libraries such as matplotlib, seaborn and plotly.