
In a rapidly changing world, where anthropogenic activities continuously sculpt and modify our planet’s surface, understanding the complex dynamics of land cover is becoming increasingly critical.
Land cover classification (LCC), an exciting and increasingly vital field of study, offers a powerful lens to observe these changes, interpret their implications, and chart potential solutions for a sustainable future.
The intricate mosaic of forests, agricultural lands, urban areas, water bodies, and other terrestrial features form the planet’s land cover. Our ability to classify and monitor these regions with accuracy can influence everything from climate change predictions and biodiversity conservation strategies to urban planning and agricultural productivity optimization.
Statistics on the use of agricultural land are highly informative. However, land use classification requires maps of field boundaries, potentially covering large areas containing thousands of farms. It takes work to obtain such a map.
However, there are more options and opportunities thanks to technological development, including AI algorithms and field boundary detection with satellite technologies. In this piece, we will delve into technologies driving the field, such as remote sensing and cutting-edge algorithms.
Satellite Imagery and Land Cover Classification
In the quest to accurately classify and monitor Earth’s land cover, researchers have found an indispensable tool: satellite imagery. Harnessing the power of different satellite platforms that offer satellite imagery, scientists can keep a watchful eye over the globe, identifying and documenting changes in land use with remarkable precision.
At the heart of this discipline is remote sensing, a technique that involves the capture and analysis of data from sensors that can detect reflected, emitted, or backscattered radiation. Satellites equipped with these sensors orbit the Earth, collecting valuable data on different land cover types ranging from dense forests and sprawling urban landscapes to vast oceans and arid deserts.
Advancements in machine learning and artificial intelligence have further propelled the potential of satellite imagery in land cover classification. Algorithms can be trained to automatically identify and categorize different land cover types based on their spectral signatures.
This process, often referred to as supervised classification, has greatly improved the speed and accuracy of large-scale land cover mapping.

For instance, the EOSDA scientific team continually refines neural network models for land cover classification, employing a custom fully connected regression model (FCRM) to ensure precision. In the process, they initially collect and preprocess satellite images alongside corresponding ground truth data (such as weather conditions) for various land cover categories.
Next, they design an FCRM for each class, which transforms into a linear regression on the output, establishing a linear relationship between the input (satellite data) and output.
The data is then divided into training, validation, and testing subsets, ensuring a balanced representation of classes. Each FCRM is trained separately on the training set, to minimize the Mean Squared Error (MSE) between predicted probabilities and ground truth labels.
Optimization algorithms and regularization techniques are used to update model parameters and prevent overfitting, respectively. Then the team monitors the FCRM’s performance on the validation set during training and adjusts hyperparameters as needed to optimize performance.
Then, by using ensemble methods, the scientists combine predictions from individual FCRMs to achieve a final land cover classification. Afterward, they assess the overall algorithm performance on the test data, using various metrics like statistical error.
Here’s a list of key statistical distributions in ML
Then, iterate through the previous steps to fine-tune and improve the classification performance. Finally, the output visualizations are prepared according to predefined Area of Interest (AOI) coordinates.
Field Boundaries Detection With Satellite Technologies
Remote sensing images provide detailed spatial information on agricultural land use that is otherwise difficult to collect. Manual interpretation is labor-intensive, so researchers use automatic field boundary detection and land use classification methods, often with a time series of images.
EOS Data Analytics provides cutting-edge technological solutions based on high-resolution imagery and boundary detection algorithms that provide detailed field delineation, with models customized to any region using locally-sourced client data.
EOSDA solution offers over 80% accuracy, depending on various factors, including season and region. Advanced algorithms entirely automate the task so that field boundary maps can be created seamlessly and accurately, even for large territories.

Convolutional Neural Network: Stellar Algorithms in LCC
As a subset of machine learning algorithms, CNNs have revolutionized the way we interpret and analyze satellite imagery, turning what was once a time-consuming, manual task into an automated, efficient process.
In the context of land cover classification, a CNN can be trained to recognize different land cover types based on their spectral and textural characteristics in satellite imagery. The network scans through the image, identifies unique features of each land cover type, and assigns a class label accordingly — such as water, urban area, forest, or agriculture.
CNNs offer several advantages in land cover classification.
Firstly, they eliminate the need for manual feature extraction, a traditionally laborious step in image classification. Instead, they automatically learn relevant features from the data, often resulting in improved classification accuracy.
Secondly, due to their hierarchical nature, they can recognize patterns at different scales, making them versatile for different sizes and resolutions of images.
Examples of Land Cover Classification with EOSDA
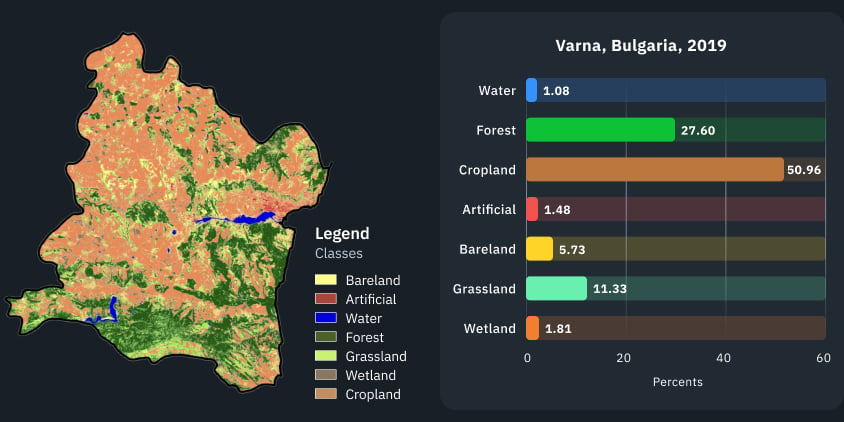
Let’s examine the Land Use and Land Cover (LULC) classification results achieved by the EOS Data Analytics model in Bulgaria. The model accurately identified classes such as forests, water bodies, and croplands. It’s important to note that the precision of the cropland class is closely tied to the quantity of input images, seasonal variations, and the resulting output.
The output demonstrates the model’s training on ample high-quality input data, as shown by the EOSDA scientists. Infrastructure, such as pavements, is meticulously captured within the bare land class. The model has also successfully identified man-made structures.
Another example of LULC classification by EOSDA is in Africa. The training output indicates that the model effectively classified Nigeria’s arid regions as the bare land class. Simultaneously, it precisely detected limited areas of water and grassland. The model’s identification of minor wetland territories provides insights into seasonal flooding patterns or their absence, which could suggest drought conditions.
Final Thoughts: The Future of Land Cover Classification
As technology and AI continue to advance, land cover classification is poised to become an even more essential tool for managing our planet’s resources. With satellite imagery, machine learning, and innovative techniques like EOSDA’s high-resolution boundary detection and neural network models, we are gaining deeper insights into Earth’s changing landscapes.
These developments promise to enhance our ability to tackle climate change, protect biodiversity, and improve agricultural practices, paving the way for a more sustainable future.