

Time series data, a continuous stream of measurements captured over time, is the lifeblood of countless fields. From stock market trends to weather patterns, it holds the key to understanding and predicting the future.
Traditionally, unraveling these insights required wading through complex statistical analysis and code. However, a new wave of technology is making waves: Large Language Models (LLMs) are revolutionizing how we analyze time series data, especially with the use of LangChain agents.
Explore LLM Guide
In this article, we will navigate the exciting world of LLM-based time series analysis. We will explore how LLMs can be used to unearth hidden patterns in your data, forecast future trends, and answer your most pressing questions about time series data using plain English.

We will see how to integrate Langchain’s Pandas Agent, a powerful LLM tool, into your existing workflow for seamless exploration.
Uncover Hidden Trends with LLMs
LLMs are powerful AI models trained on massive amounts of text data. They excel at understanding and generating human language. But their capabilities extend far beyond just words. Researchers are now unlocking their potential for time series analysis by bridging the gap between numerical data and natural language.
Understand How LLM Development is making Chatbots Smarter.
Here’s how LLMs are transforming the game:
- Natural Language Prompts: Imagine asking questions about your data like, “Is there a correlation between ice cream sales and temperature?” LLMs can be prompted in natural language, deciphering your intent, and performing the necessary analysis on the underlying time series data.
- Pattern Recognition: LLMs excel at identifying patterns in language. This ability translates to time series data as well. They can uncover hidden trends, periodicities, and seasonality within the data stream.
- Uncertainty Quantification: Forecasting the future is inherently uncertain. LLMs can go beyond just providing point predictions. They can estimate the likelihood of different outcomes, giving you a more holistic picture of potential future scenarios.
LLM Applications Across Various Industries
While LLM-based time series analysis is still evolving, it holds immense potential for various applications:
- Financial analysis: Analyze market trends, predict stock prices, and identify potential risks with greater accuracy.
Learn more about LLM Finance
- Supply chain management: Forecast demand fluctuations, optimize inventory levels, and prevent stockouts.
- Scientific discovery: Uncover hidden patterns in environmental data, predict weather patterns, and accelerate scientific research.
- Anomaly detection: Identify unusual spikes or dips in data streams, pinpointing potential equipment failures or fraudulent activities.

LangChain Pandas Agent
Lang Chain Pandas Agent is a Python library built on top of the popular Pandas library. It provides a comprehensive set of tools and functions specifically designed for data analysis. The agent simplifies the process of handling, manipulating, and visualizing time series data, making it an ideal choice for both beginners and experienced data analysts.
Know more about LangChain and its Key Features
It exemplifies the power of LLMs for time series analysis. It acts as a bridge between these powerful language models and the widely used Panda’s library for data manipulation. Users can interact with their data using natural language commands, making complex analysis accessible to a wider audience.
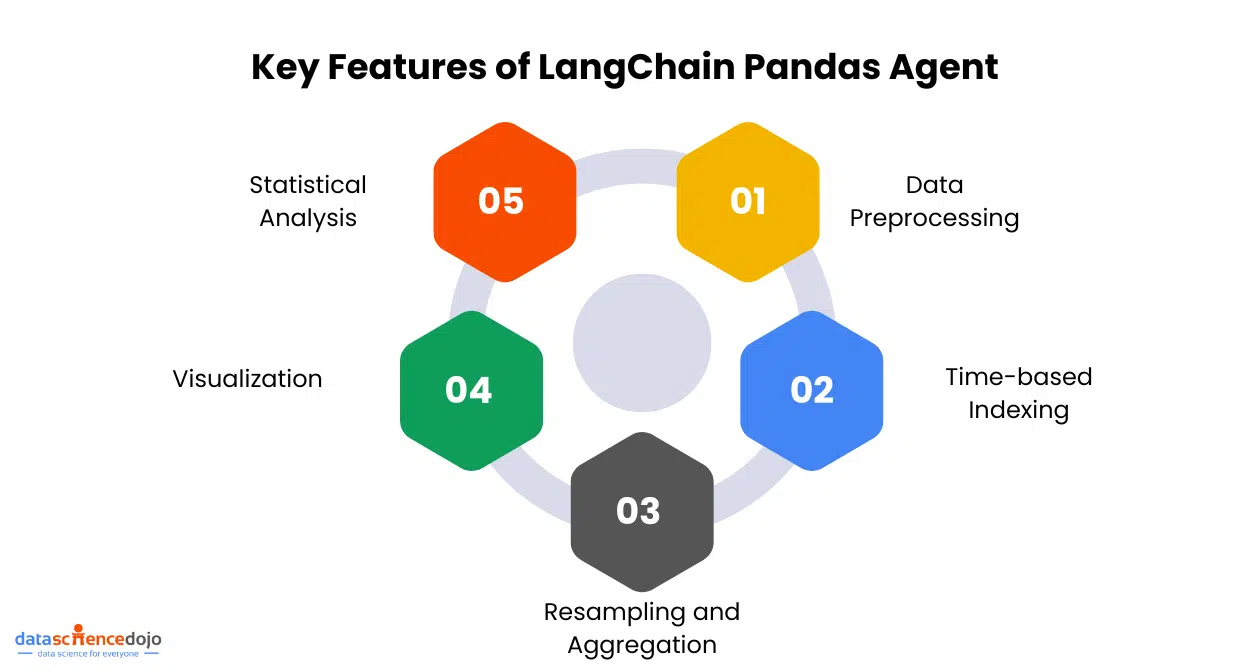
Key Features
- Data Preprocessing: The agent offers various techniques for cleaning and preprocessing time series data, including handling missing values, removing outliers, and normalizing data.
- Time-based Indexing: Lang Chain Pandas Agent allows users to easily set time-based indexes, enabling efficient slicing, filtering, and grouping of time series data.
- Resampling and Aggregation: The agent provides functions for resampling time series data at different frequencies and aggregating data over specific time intervals.
- Visualization: With built-in plotting capabilities, the agent allows users to create insightful visualizations such as line plots, scatter plots, and histograms to analyze time series data.
- Statistical Analysis: Lang Chain Pandas Agent offers a wide range of statistical functions to calculate various metrics like mean, median, standard deviation, and more.
Read along to understand sentiment analysis in LLMs
Time Series Analysis with LangChain Pandas Agent
Using LangChain Pandas Agent, we can perform a variety of time series analysis techniques, including:
Trend Analysis: By applying techniques like moving averages and exponential smoothing, we can identify and analyze trends in time series data.
Understand emerging AI and Machine Learning trends
Seasonality Analysis: The agent provides tools to detect and analyze seasonal patterns within time series data, helping us understand recurring trends.
Forecasting: With the help of advanced forecasting models like ARIMA and SARIMA, Lang Chain Pandas Agent enables us to make predictions based on historical time series data.
LLMs in Action with LangChain Agents
Suppose you are using LangChain, a popular data analysis platform. LangChain’s Pandas Agent seamlessly integrates LLMs into your existing workflows. Here is how:
- Load your time series data: Simply upload your data into LangChain as you normally would.
- Engage the LLM: Activate LangChain’s Pandas Agent, your LLM-powered co-pilot.
- Ask away: Fire away your questions in plain English. “What factors are most likely to influence next quarter’s sales?” or “Is there a seasonal pattern in customer churn?” The LLM will analyze your data and deliver clear, concise answers.
Learn to build custom chatbots using LangChain
Now Let’s explore Tesla’s stock performance over the past year and demonstrate how Language Models (LLMs) can be utilized for data analysis and unveil valuable insights into market trends.
To begin, we download the dataset and import it into our code editor using the following snippet:
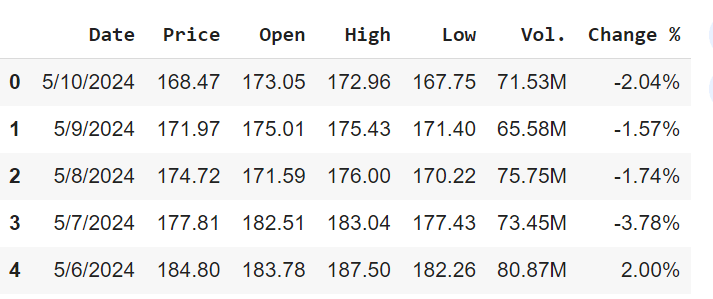
Dataset Preview
Below are the first five rows of our dataset
Next, let’s install and import important libraries from LangChain that are instrumental in data analysis.
Following that, we will create a LangChain Pandas DataFrame agent utilizing OpenAI’s API.
With just these few lines of code executed, your LLM-based agent is now primed to extract valuable insights using simple language commands.
Initial Understanding of Data
Prompt
Explanation
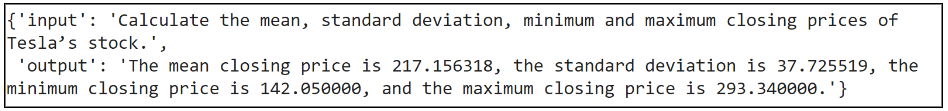
The analysis of Tesla’s closing stock prices reveals that the average closing price was $217.16. There was a standard deviation of $37.73, indicating some variation in the daily closing prices. The minimum closing price was $142.05, while the maximum reached $293.34.
This comprehensive overview offers insights into the distribution and fluctuation of Tesla’s stock prices during the period analyzed.
Prompt

Explanation
The daily change in Tesla’s closing stock price is calculated, providing valuable insights into its day-to-day fluctuations. The average daily change, computed at 0.0618, signifies the typical amount by which Tesla’s closing stock price varied over the specified period.
This metric offers investors and analysts a clear understanding of the level of volatility or stability exhibited by Tesla’s stock daily, aiding in informed decision-making and risk assessment strategies.
Detecting Anomalies
Prompt
Explanation
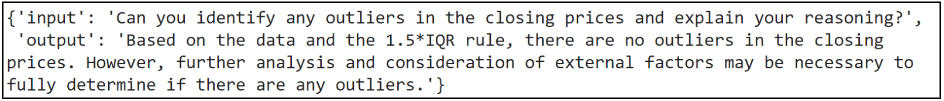
In the realm of anomaly detection within financial data, the absence of outliers in closing prices, as determined by the 1.5*IQR rule, is a notable finding. This suggests that within the dataset under examination, there are no extreme values that significantly deviate from the norm.
However, it is essential to underscore that while this statistical method provides a preliminary assessment, a comprehensive analysis should incorporate additional factors and context to conclusively ascertain the presence or absence of outliers.
This comprehensive approach ensures a more nuanced understanding of the data’s integrity and potential anomalies, thus aiding in informed decision-making processes within the financial domain.
Visualizing Data
Prompt

Explanation
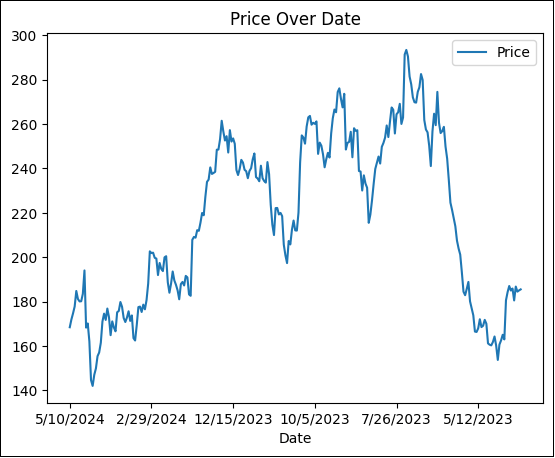
The chart above depicts the daily closing price of Tesla’s stock plotted over the past year. The horizontal x-axis represents the dates, while the vertical y-axis shows the corresponding closing prices in USD. Each data point is connected by a line, allowing us to visualize trends and fluctuations in the stock price over time.
By analyzing this chart, we can identify trends like upward or downward movements in Tesla’s stock price. Additionally, sudden spikes or dips might warrant further investigation into potential news or events impacting the stock market.
Forecasting
Prompt
Explanation
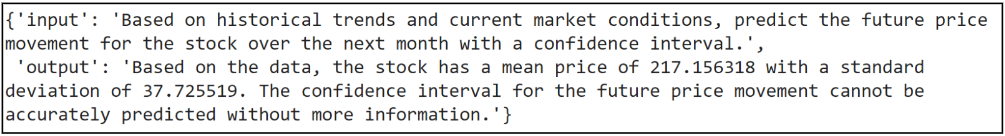
Even with historical data, predicting the future is a complex task for Large Language Models. Large language models excel at analyzing information and generating text, they cannot reliably forecast stock prices. The stock market is influenced by many unpredictable factors, making precise predictions beyond historical trends difficult.
The analysis reveals an average price of $217.16 with some variation, but for a more confident prediction of Tesla’s price next month, human experts and consideration of current events are crucial.
Key Findings
Prompt
Explanation
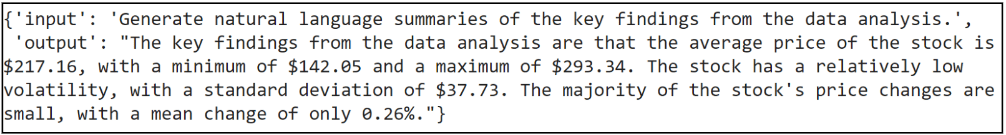
The generated natural language summary encapsulates the essential insights gleaned from the data analysis. It underscores the stock’s average price, revealing its range from $142.05 to $293.34. Notably, the analysis highlights the stock’s low volatility, a significant metric for investors gauging risk.
With a standard deviation of $37.73, it paints a picture of stability amidst market fluctuations. Furthermore, the observation that most price changes are minor, averaging just 0.26%, provides valuable context on the stock’s day-to-day movements.
This concise summary distills complex data into digestible nuggets, empowering readers to grasp key findings swiftly and make informed decisions.
Limitations and Considerations
While LLMs offer significant advantages in time series analysis, it is essential to be aware of its limitations. These include the lack of domain-specific knowledge, sensitivity to input wording, biases in training data, and a limited understanding of context.
Data scientists must validate responses with domain expertise, frame questions carefully, and remain vigilant about biases and errors.
- LLMs are most effective as a supplementary tool. They can be an asset for uncovering hidden patterns and providing context, but they should not be the sole basis for decisions, especially in critical areas like finance.
- Combining LLMs with traditional time series models can be a powerful approach. This leverages the strengths of both methods – the ability of LLMs to handle complex relationships and the interpretability of traditional models.
Overall, LLMs offer exciting possibilities for time series analysis, but it is important to be aware of their limitations and use them strategically alongside other tools for the best results.

Best Practices for Using LLMs in Time Series Analysis
To effectively utilize LLMs like ChatGPT or Langchain in time series analysis, the following best practices are recommended:
- Combine LLM’s insights with domain expertise to ensure accuracy and relevance.
- Perform consistency checks by asking LMMs multiple variations of the same question.
- Verify critical information and predictions with reliable external sources.
- Use LLMs iteratively to generate ideas and hypotheses that can be refined with traditional methods.
- Implement bias mitigation techniques to reduce the risk of biased responses.
- Design clear prompts specifying the task and desired output.
- Use a zero-shot approach for simpler tasks, and fine-tune for complex problems.

LLMs: A Powerful Tool for Data Analytics
In summary, Large Language Models (LLMs) represent a significant shift in data analysis, offering an accessible avenue to obtain desired insights and narratives. The examples displayed highlight the power of adept prompting in unlocking valuable interpretations.
Read more on Bootcamps for LLM Training
However, this is merely the tip of the iceberg. With a deeper grasp of effective prompting strategies, users can unleash a wealth of analyses, comparisons, and visualizations.
Mastering the art of effective prompting allows individuals to navigate their data with the skill of seasoned analysts, all thanks to the transformative influence of LLMs.