In the world of machine learning, evaluating the performance of a model is just as important as building the model itself. One of the most fundamental tools for this purpose is the confusion matrix. This powerful yet simple concept helps data scientists and machine learning practitioners assess the accuracy of classification algorithms, providing insights into how well a model is performing in predicting various classes.
In this blog, we will explore the concept of a confusion matrix using a spam email example. We highlight the 4 key metrics you must understand and work on while working with a confusion matrix.
What is a Confusion Matrix?
A confusion matrix is a table that is used to describe the performance of a classification model. It compares the actual target values with those predicted by the model. This comparison is done across all classes in the dataset, giving a detailed breakdown of how well the model is performing.
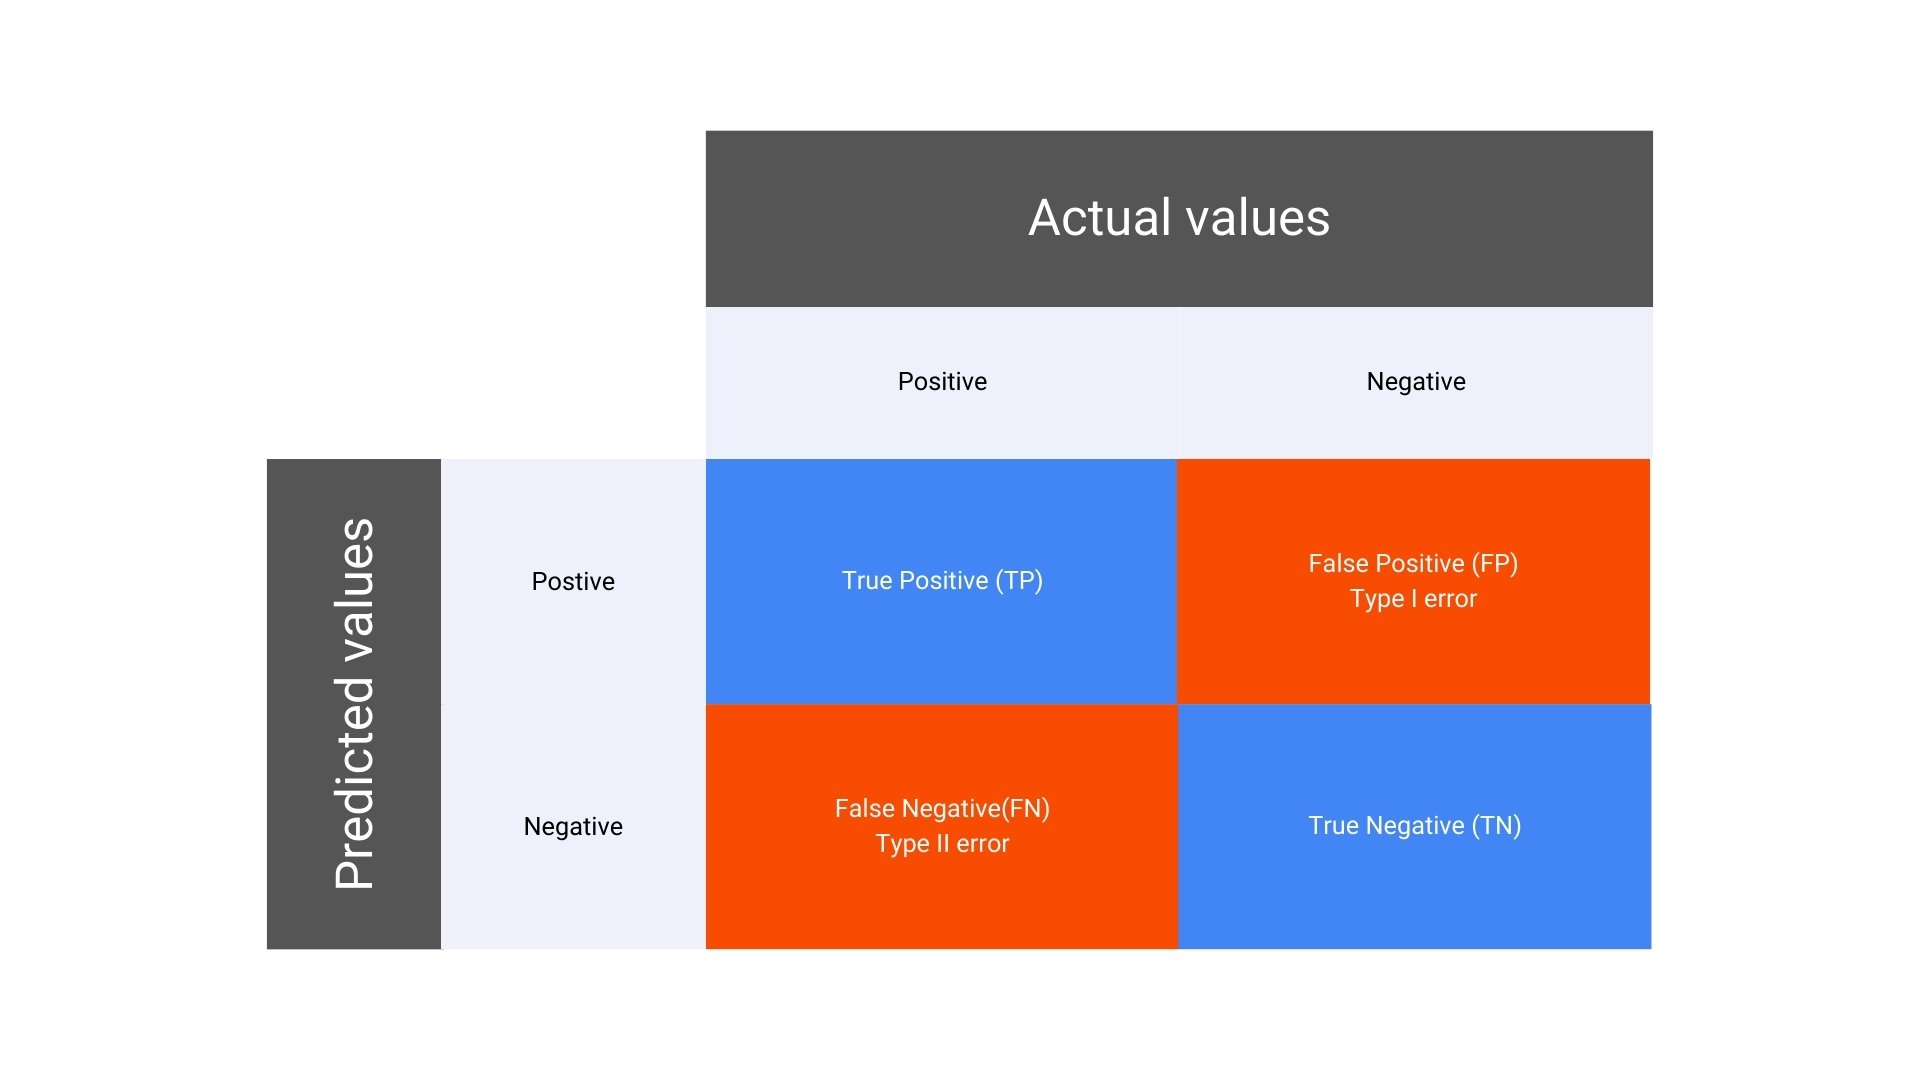
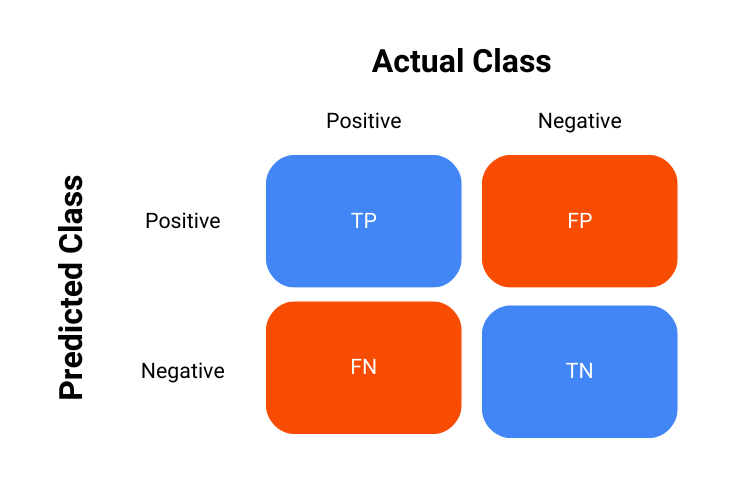
Here’s a simple layout of a confusion matrix for a binary classification problem:
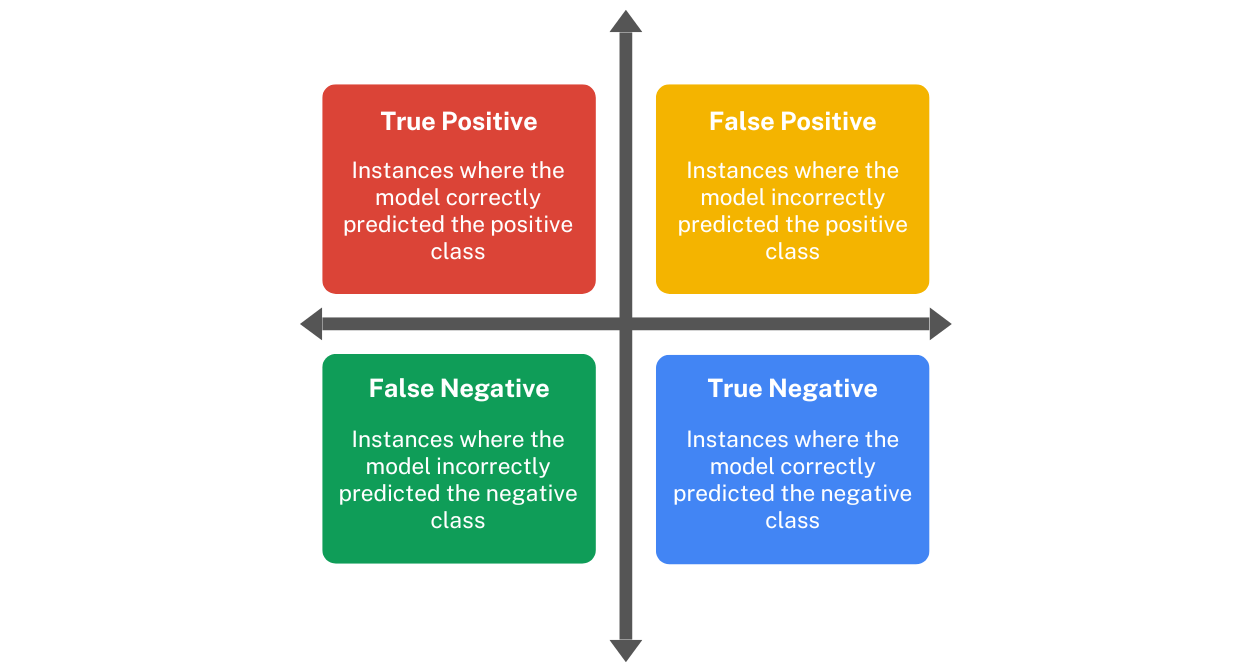
In a binary classification problem, the confusion matrix consists of four key components:
True Positive (TP): The number of instances where the model correctly predicted the positive class.
False Positive (FP): The number of instances where the model incorrectly predicted the positive class when it was actually negative. Also known as Type I error.
False Negative (FN): The number of instances where the model incorrectly predicted the negative class when it was actually positive. Also known as Type II error.
True Negative (TN): The number of instances where the model correctly predicted the negative class.
Why is the Confusion Matrix Important?
The confusion matrix provides a more nuanced view of a model’s performance than a single accuracy score. It allows you to see not just how many predictions were correct, but also where the model is making errors, and what kind of errors are occurring. This information is critical for improving model performance, especially in cases where certain types of errors are more costly than others.
For example, in medical diagnosis, a false negative (where the model fails to identify a disease) could be far more serious than a false positive. In such cases, the confusion matrix helps in understanding these errors and guiding the development of models that minimize the most critical types of errors.
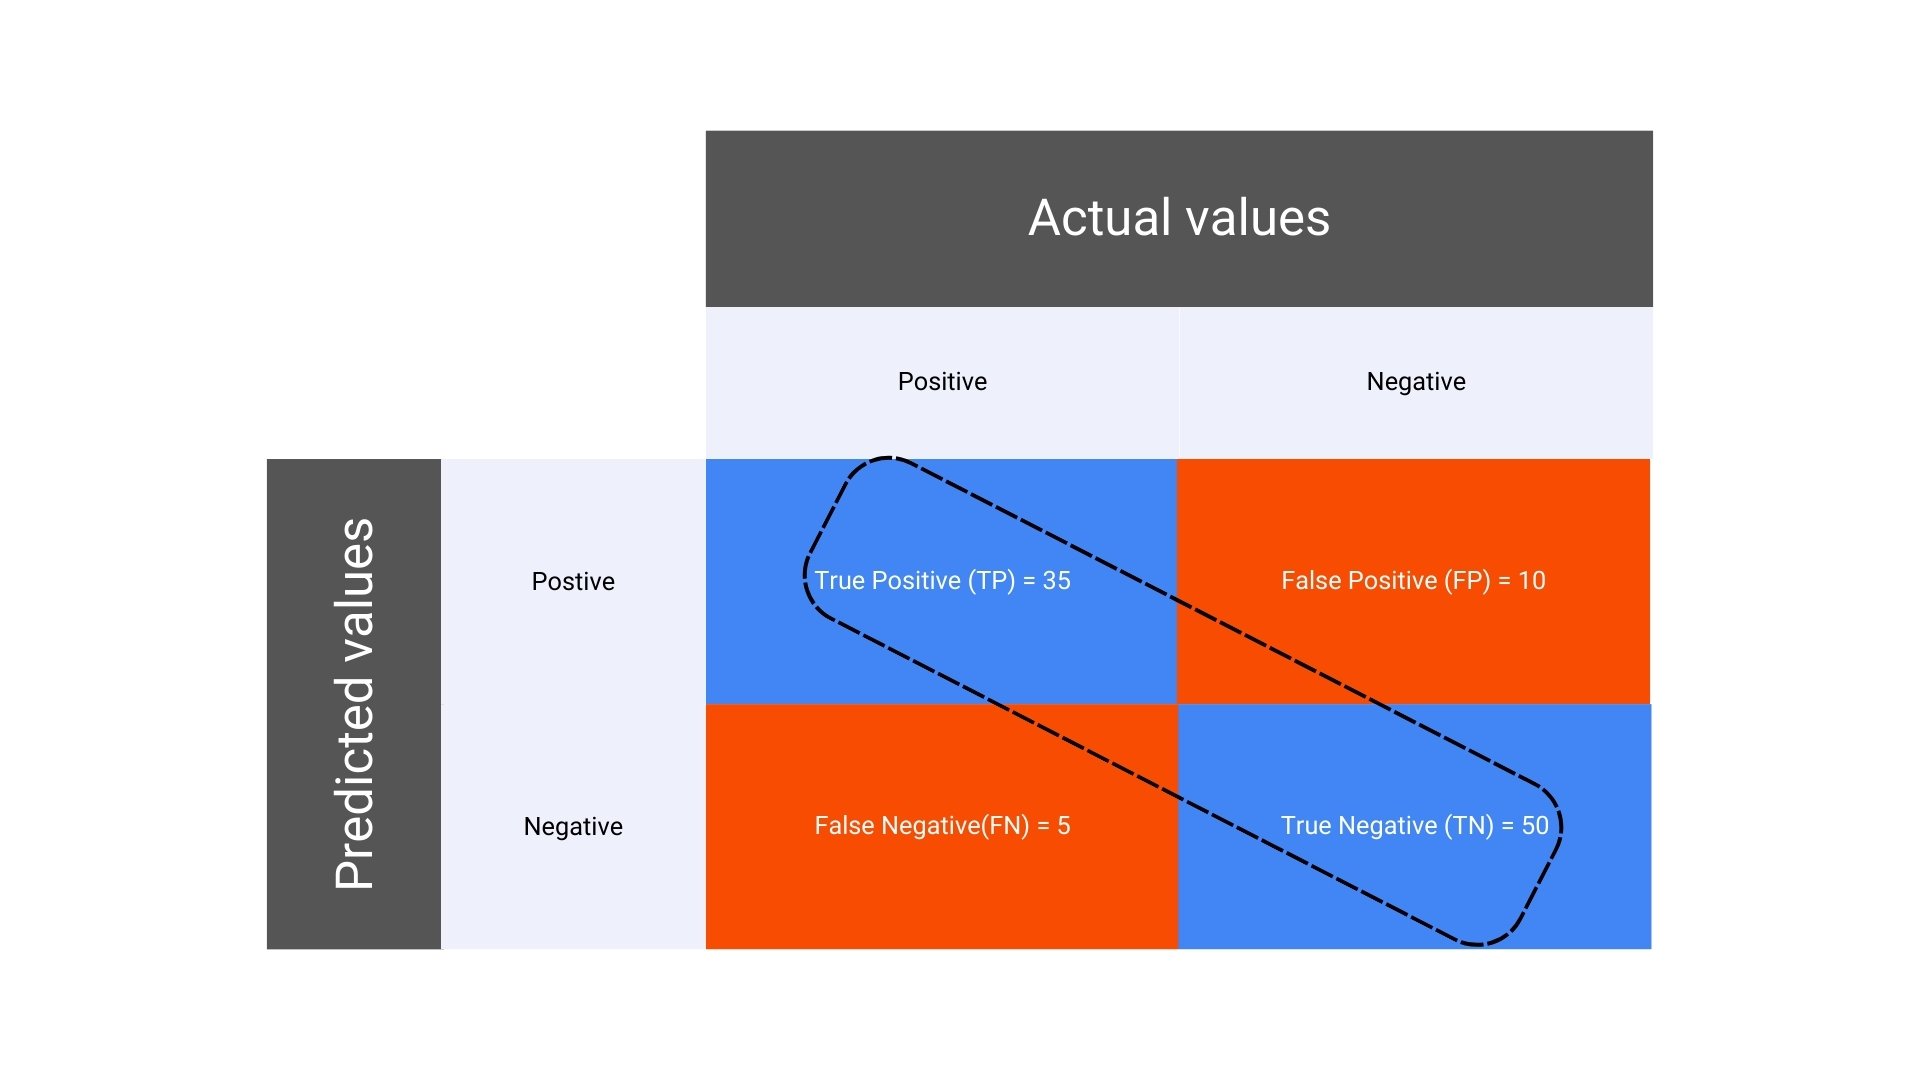
Suppose you have built a machine learning model to classify emails as either “Spam” or “Not Spam.” You test your model on a dataset of 100 emails, and the actual and predicted classifications are compared. Here’s how the results could break down:
Total emails: 100
Actual Spam emails: 40
Actual Not Spam emails: 60
After running your model, the results are as follows:
Incorrectly predicted Not Spam emails (False Negatives, FN): 5
Correctly predicted Not Spam emails (True Negatives, TN): 50
Understanding 4 Key Metrics Derived from the Confusion Matrix
The confusion matrix serves as the foundation for several important metrics that are used to evaluate the performance of a classification model. These include:
1. Accuracy
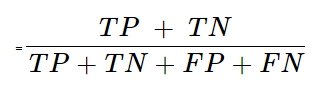
Formula for Accuracy in a Confusion Matrix:
Explanation: Accuracy measures the overall correctness of the model by dividing the sum of true positives and true negatives by the total number of predictions.
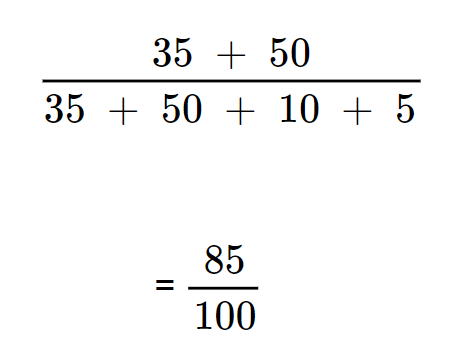
Calculation for accuracy in the given confusion matrix:
This equates to = 0.85 (or 85%). It means that the model correctly predicted 85% of the emails.
2. Precision
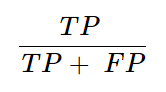
Formula for Precision in a Confusion Matrix:
Explanation: Precision (also known as positive predictive value) is the ratio of correctly predicted positive observations to the total predicted positives.
It answers the question: Of all the positive predictions, how many were actually correct?
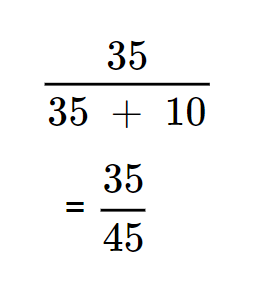
Calculation for precision of the given confusion matrix
It equates to ≈ 0.78 (or 78%) which highlights that of all the emails predicted as Spam, 78% were actually Spam.
3. Recall (Sensitivity or True Positive Rate)
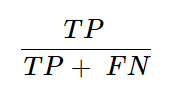
Formula for Recall in a Confusion Matrix
Explanation: Recall measures the model’s ability to correctly identify all positive instances. It answers the question: Of all the actual positives, how many did the model correctly predict?
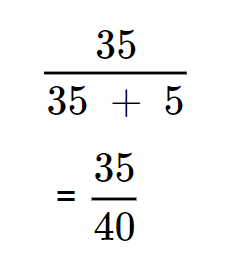
Calculation for recall in the given confusion matrix
It equates to = 0.875 (or 87.5%), highlighting that the model correctly identified 87.5% of the actual Spam emails.
4. F1 Score
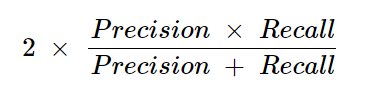
F1 Score Formula:
Explanation: The F1 score is the harmonic mean of precision and recall. It is especially useful when the class distribution is imbalanced, as it balances the two metrics.
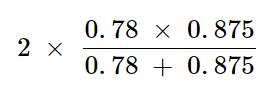
F1 Calculation:
This calculation equates to ≈ 0.82 (or 82%). It indicates that the F1 score balances Precision and Recall, providing a single metric for performance.
High Recall: The model is good at identifying actual Spam emails (high Recall of 87.5%).
Moderate Precision: However, it also incorrectly labels some Not Spam emails as Spam (Precision of 78%).
Balanced Accuracy: The overall accuracy is 85%, meaning the model performs well, but there is room for improvement in reducing false positives and false negatives.
Solid F1 Score: The F1 Score of 82% reflects a good balance between Precision and Recall, meaning the model is reasonably effective at identifying true positives without generating too many false positives. This balanced metric is particularly valuable in evaluating the model’s performance in situations where both false positives and false negatives are important.
Conclusion
The confusion matrix is an indispensable tool in the evaluation of classification models. By breaking down the performance into detailed components, it provides a deeper understanding of how well the model is performing, highlighting both strengths and weaknesses. Whether you are a beginner or an experienced data scientist, mastering the confusion matrix is essential for building effective and reliable machine learning models.
In the domain of machine learning, evaluating the performance and results of a classification model is a mandatory step. There are numerous metrics available to get this done.
The ones discussed in this blog are the AUC (Area Under the Curve) and ROC (Receiver Operating Characteristic). It stands out for its effectiveness in measuring the performance of classification models and multi-class classification problems.
The Confusion Matrix
Before diving into the details of the metric AUC-ROC curve, it is imperative that an understanding of the confusion matrix is developed beforehand.
The confusion matrix is a key tool used in the process of evaluating the performance of classification models, it is essentially a table that summarizes the outcomes of the model’s predictions against the actual outcomes – in short, it shows how the model is confused.
The confusion matrix is represented as follows:
True Positives (TP): Instances where the model correctly predicted the positive class.
True Negatives (TN): Instances where the model correctly predicted the negative class.
False Positives (FP): Instances where the model incorrectly predicted the positive class.
False Negatives (FN): Instances where the model incorrectly predicted the negative class.
Using this confusion matrix, many metrics are derived, and it is also used in the calculation of AUC-ROC which will now be discussed.
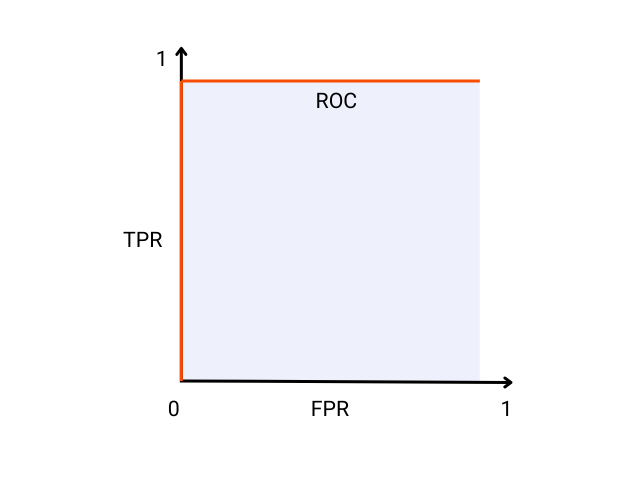
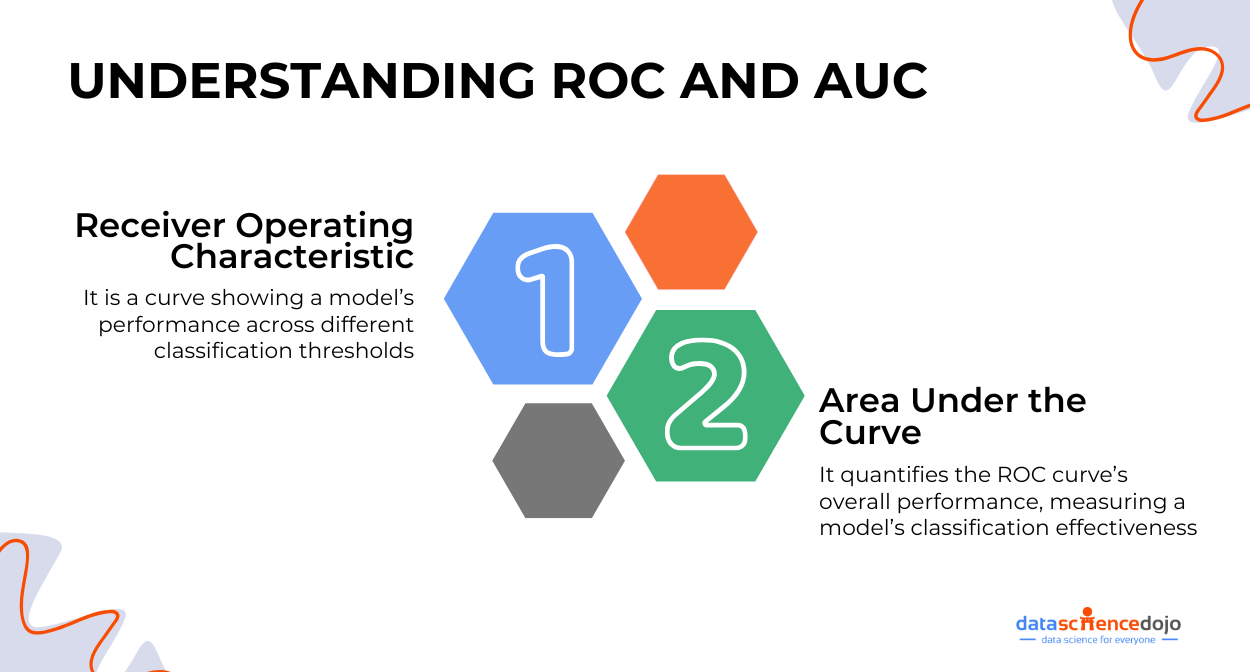
The Receiver Operating Characteristic (ROC) curve is a visual and graphical representation of a classification model’s performance across various thresholds. It is created by first calculating the True Positive Rate (TPR) and False Positive Rate (FPR) at every threshold value and then plotting them against each other.
An ideal model will have a TPR of 1 and an FPR of 0 which ultimately means it did not misclassify any instance in the data and there is perfect separation between the positive and the negative class. A visual representation of such an ideal classification model is shown below:
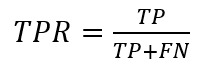
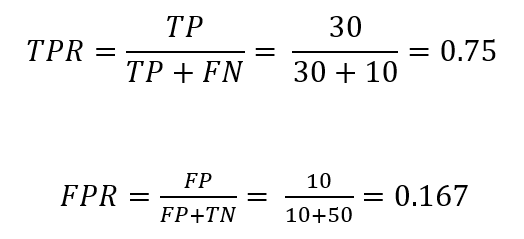
The true positive rate or TPR is calculated as:
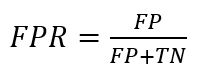
The false positive rate or FPR is calculated as:
Example
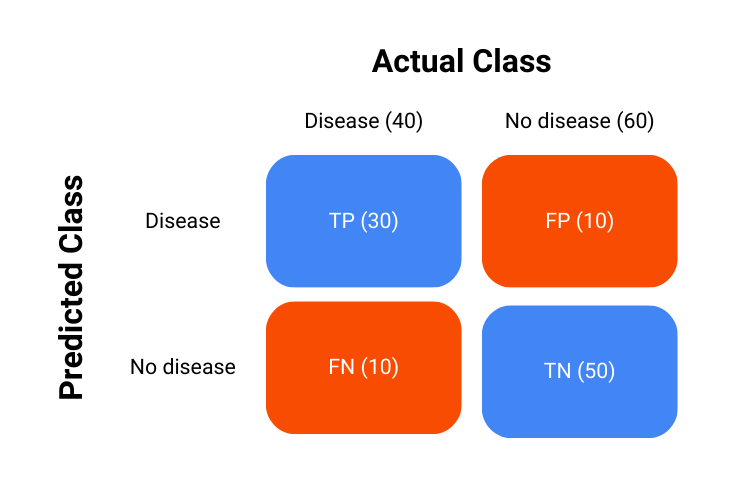
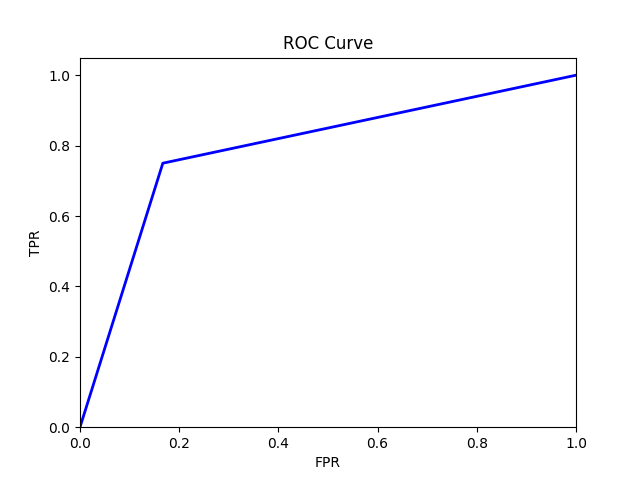
Consider a hypothetical example of a medical test to detect a certain disease. There are 100 patients and 40 of these patients have the disease. We will use this example to create the ROC curve to have an idea other than the ideal model.
Consider that our classification model performed as such:
The calculation of TPR and FPR is carried out as:
The ROC curve will then look something like this:
This plot is plotted using Python and the code for it is as follows:
What is AUC?
The Area Under the Curve (AUC) is also sometimes referred to as the area under the ROC curve. It is a single scalar value that summarizes the performance of a classification model across all threshold values.
It represents the likelihood that the model will rank a randomly chosen positive instance higher than a randomly chosen negative instance.
The ideal model as shown in the ROC curve image has an AUC of 1, which means that there is a 100% probability that the model will correctly rank a randomly chosen positive instance higher than a randomly chosen negative instance.
AUC Interpretation
To understand AUC more intuitively, consider a medical test carried out to detect a disease. An AUC score of 1 would mean that the medical test perfectly separates the healthy and diseased individuals, always giving a higher score to those with the disease.
On the other hand, an AUC score of 0.5 is not better than random guessing or a random chance model that only correctly ranks individuals with the disease half of the time.
In summary:
AUC = 1: Perfect model.
0.5 < AUC < 1: Good model, better than random chance.
AUC = 0.5: Model with no discrimination capability.
AUC < 0.5: Model worse than random chance.
Example with Real-World Data
Consider a dataset with two features, namely “Age” and “Income” and a binary target variable “Default” which shows whether a customer defaults on a loan or not.
ID
Age
Income
Default
1
25
50000
Yes
2
45
100000
No
3
35
75000
No
4
50
120000
Yes
5
23
54000
No
6
48
85000
Yes
7
33
60000
Yes
8
55
130000
No
Model Predictions
Suppose now that we train a logistic regression model and obtain the following probabilities for the “Default” target variable:
ID
Age
Income
Default
Probability
1
25
50000
Yes
0.65
2
45
100000
No
0.40
3
35
75000
No
0.55
4
50
120000
Yes
0.70
5
23
54000
No
0.30
6
48
85000
Yes
0.60
7
33
60000
Yes
0.45
8
55
130000
No
0.35
ROC and AUC Calculation
Finally, we plot the TPR against the FPR at different threshold values to create an ROC curve and calculate the AUC score of our model.
From our logistic regression model, we get an AUC of 0.94, indicating near-perfect model performance.
The code for the plot is mentioned below.
Note: Achieving near-perfect model performance is often unrealistic in real-world situations. The high score we saw is probably a result of the small sample size, which might not accurately reflect real-life situations.
Practical Applications
Model Evaluation
The ROC curve and the AUC score are widely used in the evaluation of the performance of classification models, especially when dealing with imbalance datasets.
By understanding and examining the trade-offs between TPR and FPR and identifying which is more relevant to the problem at hand, one can choose the optimal threshold to maximize the model’s effectiveness.
In practice, ROC curves greatly help in the selection of the optimal threshold for classification problems. For example, in medical diagnostics, one might choose a threshold that minimizes false negatives to ensure that fewer instances of the disease are missed, even if it means accepting a higher false positive rate.
Comparing Models
AUC is also a great measure for comparing the performance of two different models. The model with the greater area under the curve or in other words, having a higher AUC is generally preferred as it indicates better overall model performance.
Conclusion
Understanding the nuances of the ROC curve and the AUC score is essential for evaluating the performance of classification models.
These metrics provide a comprehensive picture of the trade-offs between true positive rates and false positive rates at different threshold values, effectively helping data scientists and practitioners make informed decisions about their models.
In the vast forest of machine learning algorithms, one algorithm stands tall like a sturdy tree – Random Forest. It’s an ensemble learning method that’s both powerful and flexible, widely used for classification and regression tasks.
But what makes the random forest algorithm so effective? How does it work?
In this blog, we’ll explore the inner workings of Random Forest, its advantages, limitations, and practical applications.
What is a Random Forest Algorithm?
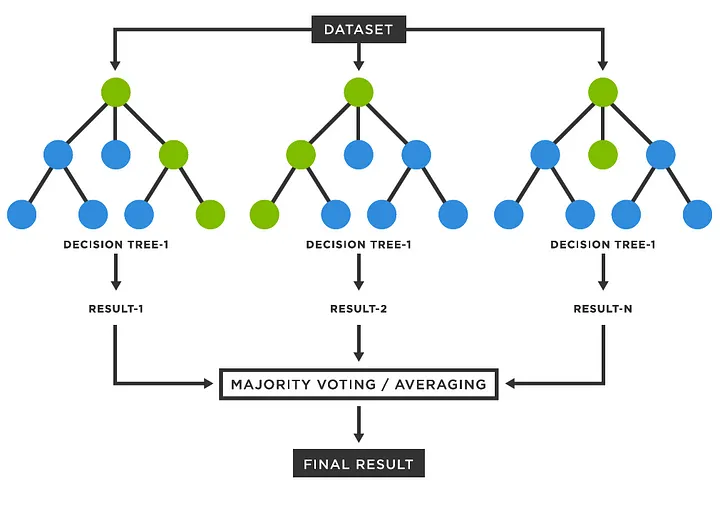
Imagine a dense forest with numerous trees, each offering a different path to follow. Random Forest Algorithm is like that: an ensemble of decision trees working together to make more accurate predictions.
By combining the results of multiple trees, the algorithm improves the overall model performance, reducing errors and variance.
Why the Name ‘Random Forest’?
The name “Random Forest” comes from the combination of two key concepts: randomness and forests. The “random” part refers to the random selection of data samples and features during the construction of each tree, while the “forest” part refers to the ensemble of decision trees.
This randomness is what makes the algorithm robust and less prone to overfitting.
Common Use Cases of Random Forest Algorithm
Random Forest Algorithm is highly versatile and is used in various applications such as:
Before diving into Random Forest, let’s quickly revisit the concept of Decision Trees.
Decision Trees Recap
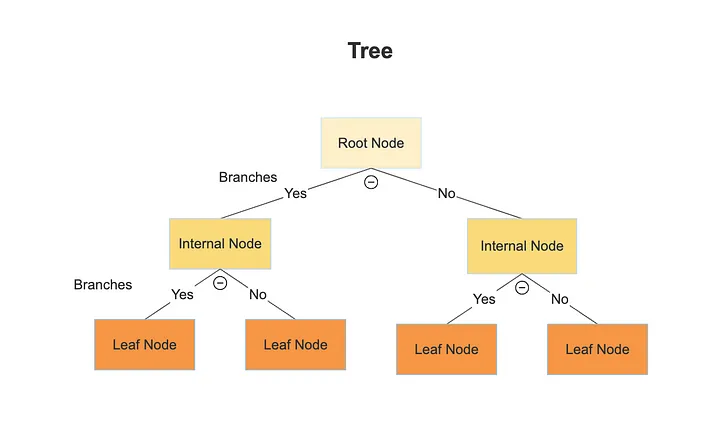
A decision tree is a flowchart-like structure where internal nodes represent decisions based on features, branches represent the outcomes of these decisions, and leaf nodes represent final predictions. While decision trees are easy to understand and interpret, they can be prone to overfitting, especially when the tree is deep and complex.
Representation of a decision tree – Source: Medium
Key Concepts in Random Forest
Ensemble Learning: This technique combines multiple models to improve performance. Random Forest is an example of ensemble learning where multiple decision trees work together to produce a more accurate and stable prediction.
Bagging (Bootstrap Aggregating): In Random Forest, the algorithm creates multiple subsets of the original dataset by sampling with replacement (bootstrapping). Each tree is trained on a different subset, which helps in reducing variance and preventing overfitting.
Feature Randomness: During the construction of each tree, Random Forest randomly selects a subset of features to consider at each split. This ensures that the trees are diverse and reduces the likelihood that a few strong predictors dominate the model.
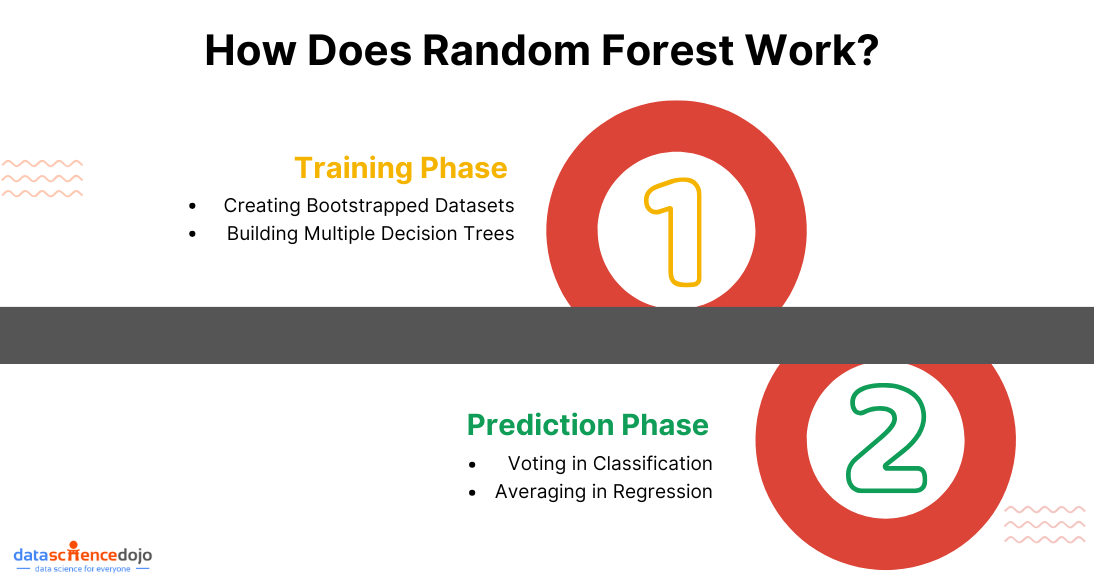
Let’s break down the process into two main phases: training and prediction.
Training Phase
Creating Bootstrapped Datasets: The algorithm starts by creating multiple bootstrapped datasets by randomly sampling the original data with replacement. This means some data points may be repeated, while others may be left out.
Building Multiple Decision Trees: For each bootstrapped dataset, a decision tree is constructed. However, instead of considering all features at each split, the algorithm randomly selects a subset of features. This randomness ensures that the trees are different from each other, leading to a more generalized model.
Prediction Phase
Voting in Classification: When it’s time to make predictions, each tree in the forest casts a vote for the class label. The final prediction is determined by the majority vote among the trees.
Averaging in Regression: For regression tasks, instead of voting, the predictions from all the trees are averaged to get the result.
Random Forest is popular for good reasons. Some of these include:
High Accuracy
By aggregating the predictions of multiple trees, Random Forest often achieves higher accuracy than individual decision trees. The ensemble approach reduces the impact of noisy data and avoids overfitting, making the model more reliable.
Robustness to Overfitting
Overfitting occurs when a model performs well on the training data but poorly on unseen data. Random Forest combats overfitting by averaging the predictions of multiple trees, each trained on different parts of the data. This ensemble approach helps the model generalize better.
Handles Missing Data
Random Forest can handle missing values naturally by using the split with the majority of the data and by averaging the outputs from trees trained on different parts of the data.
Feature Importance
One of the perks of Random Forest is its ability to measure the importance of each feature in making predictions. This is done by evaluating the impact of each feature on the model’s performance, providing insights into which features are most influential.
Limitations of Random Forest
While Random Forest is a powerful tool, it’s not without its drawbacks. A few limitations associated with random forests are:
Computational Cost
Training multiple decision trees can be computationally expensive, especially with large datasets and a high number of trees. The algorithm’s complexity increases with the number of trees and the depth of each tree, leading to longer training times.
Interpretability
While decision trees are easy to interpret, Random Forest, being an ensemble of many trees, is more complex and harder to interpret. The lack of transparency can be a disadvantage in situations where model interpretability is crucial.
Bias-Variance Trade-off
Random Forest does a good job managing the bias-variance trade-off, but it’s not immune to it. If not carefully tuned, the model can still suffer from bias or variance issues, though typically less so than a single decision tree.
Hyperparameter Tuning in Random Forest
While we understand the benefits and limitations of Random Forest, let’s take a deeper look into working with the algorithm. Understanding and working with relevant hyperparameters is a crucial part of the process.
It is an important aspect because tuning the hyperparameters of a Random Forest can significantly impact its performance. Here are some key hyperparameters to consider:
Number of Trees (n_estimators): The number of trees in the forest. Increasing this generally improves performance but with diminishing returns and increased computational cost.
Maximum Depth (max_depth): The maximum depth of each tree. Limiting the depth can help prevent overfitting.
Number of Features (max_features): The number of features to consider when looking for the best split. Lower values increase diversity among trees but can also lead to underfitting.
Techniques for Tuning
Grid Search: This exhaustive search technique tries every combination of hyperparameters within a specified range to find the best combination. While thorough, it can be time-consuming.
Random Search: Instead of trying every combination, Random Search randomly selects combinations of hyperparameters. It’s faster than Grid Search and often finds good results with less computational effort.
Cross-Validation: Cross-validation is essential in hyperparameter tuning. It splits the data into several subsets and uses different combinations for training and validation, ensuring that the model’s performance is not dependent on a specific subset of data.
Practical Implementation
To understand how Random Forest works in practice, let’s look at a step-by-step implementation using Python.
Setting Up the Environment
You’ll need the following Python libraries: scikit-learn for the Random Forest implementation, pandas for data handling, and numpy for numerical operations.
Example Dataset
For this example, we’ll use the famous Iris dataset, a simple yet effective dataset for demonstrating classification algorithms.
Step-by-Step Code Walkthrough
Data Preprocessing: Start by loading the data and handling any missing values, though the Iris dataset is clean and ready to use.
Training the Random Forest Model: Instantiate the Random Forest classifier and fit it to the training data.
Evaluating the Model: Use the test data to evaluate the model’s performance.
Hyperparameter Tuning: Use Grid Search or Random Search to find the optimal hyperparameters.
Comparing Random Forest with Other Algorithms
Random Forest vs. Decision Trees
While a single decision tree is easy to interpret, it’s prone to overfitting, especially with complex data. Random Forest reduces overfitting by averaging the predictions of multiple trees, leading to better generalization.
Both are ensemble methods, but they differ in approach. Random Forest builds trees independently, while Gradient Boosting builds trees sequentially, where each tree corrects the errors of the previous one. Gradient Boosting often achieves better accuracy but at the cost of higher computational complexity and longer training times.
Random Forest vs. Support Vector Machines (SVM)
SVMs are powerful for high-dimensional data, especially when the number of features exceeds the number of samples. However, SVMs are less interpretable and more sensitive to parameter tuning compared to Random Forest. Random Forest tends to be more robust and easier to use out of the box.
Explore the Impact of Random Forest Algorithm
Random Forest is a powerful and versatile algorithm, capable of handling complex datasets with high accuracy. Its ensemble nature makes it robust against overfitting and capable of providing valuable insights into feature importance.
As you venture into the world of machine learning, remember that a well-tuned Random Forest can be the key to unlocking insights hidden deep within your data. Keep experimenting, stay curious, and let your models grow as robust as the forest itself!
In the realm of statistics and machine learning, understanding various probability distributions is paramount. One such fundamental distribution is the Binomial Distribution.
This distribution is not only a cornerstone in probability theory but also plays a crucial role in various machine learning algorithms and applications.
In this blog, we will delve into the concept of binomial distribution, its mathematical formulation, and its significance in the field of machine learning.
What is Binomial Distribution?
The binomial distribution is a discrete probability distribution that describes the number of successes in a fixed number of independent and identically distributed Bernoulli trials.
A Bernoulli trial is a random experiment where there are only two possible outcomes:
success (with probability ( p ))
failure (with probability ( 1 – p ))
Mathematical Formulation
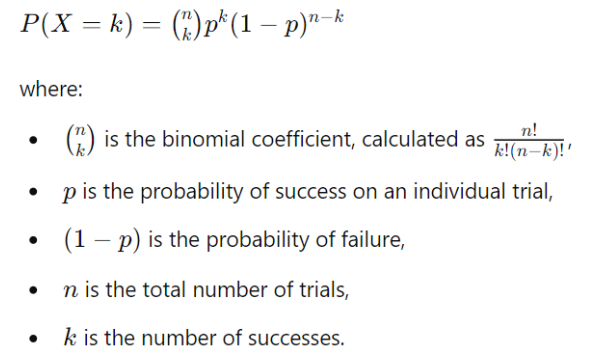
The probability of observing exactly k successes in n trials is given by the binomial probability formula:
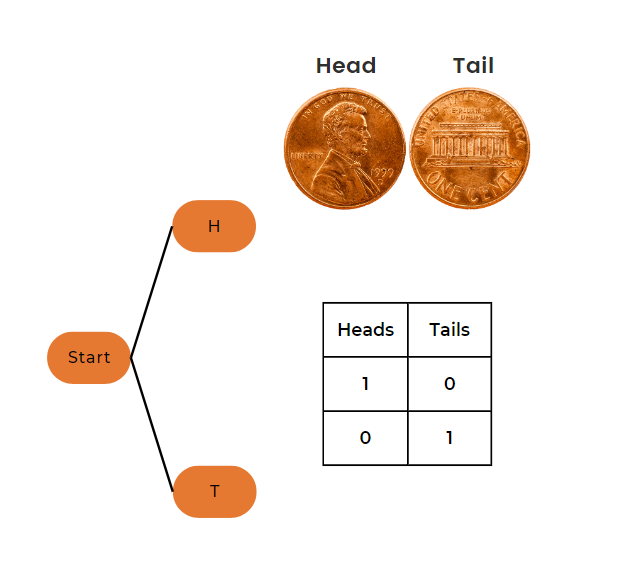
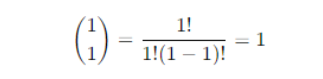
Example 1: Tossing One Coin
Let’s start with a simple example of tossing a single coin.
Parameters
Number of trials (n) = 1
Probability of heads (p) = 0.5
Number of heads (k) = 1
Calculation
Binomial coefficient
Probability
So, the probability of getting exactly one head in one toss of a coin is 0.5 or 50%.
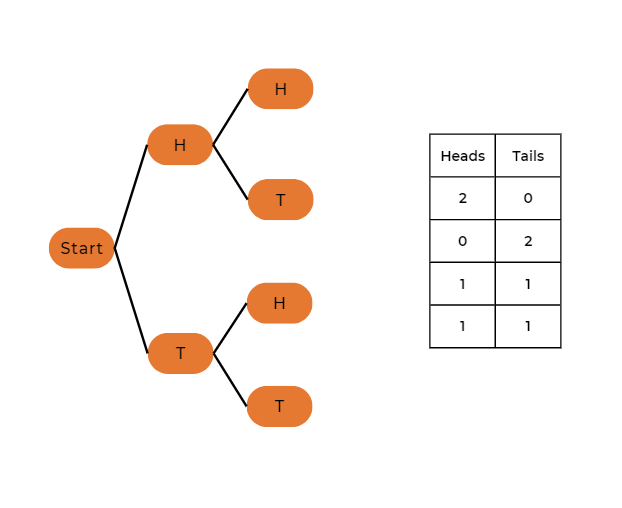
Example 2: Tossing Two Coins
Now, let’s consider the case of tossing two coins.
So, the probabilities for different numbers of heads in two-coin tosses are:
P(X = 0) = 0.25 – no heads
P(X = 1) = 0.5 – one head
P(X = 2) = 0.25 – two heads
Detailed Example: Predicting Machine Failure
Let’s consider a more practical example involving predictive maintenance in an industrial setting. Suppose we have a machine that is known to fail with a probability of 0.05 during a daily checkup. We want to determine the probability of the machine failing exactly 3 times in 20 days.
Step-by-Step Calculation
1. Identify Parameters
Number of trials (n) = 20 days
Probability of success (p) = 0.05 – failure is considered a success in this context
Number of successes (k) = 3 failures
2. Apply the Formula
3. Compute Binomial Coefficient
4. Calculate Probability
Plugging the values into the binomial formula
Substitute the values
P(X = 3) = 1140 × (0.05)3 × (0.95)17
Calculate (0.05)3
(0.05)3 = 0.000125
Calculate (0.95)17
(0.95)17 ≈ 0.411
5. Multiply all Components Together
P(X = 3) = 1140 × 0.000125 × 0.411 ≈ 0.0585
Therefore, the probability of the machine failing exactly 3 times in 20 days is approximately 0.0585 or 5.85%.
Role of Binomial Distribution in Machine Learning
The binomial distribution is integral to several aspects of machine learning, providing a foundation for understanding and modeling binary events, hypothesis testing, and beyond.
Let’s explore how it intersects with various machine-learning concepts and techniques.
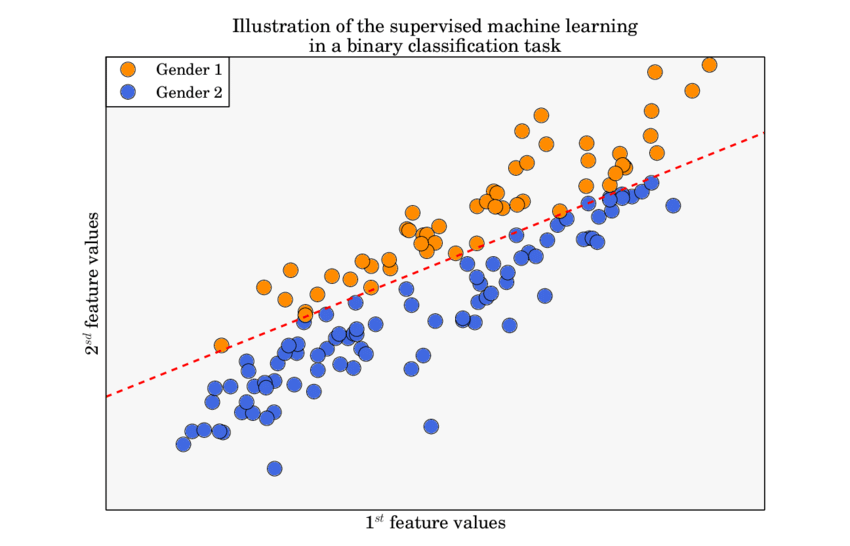
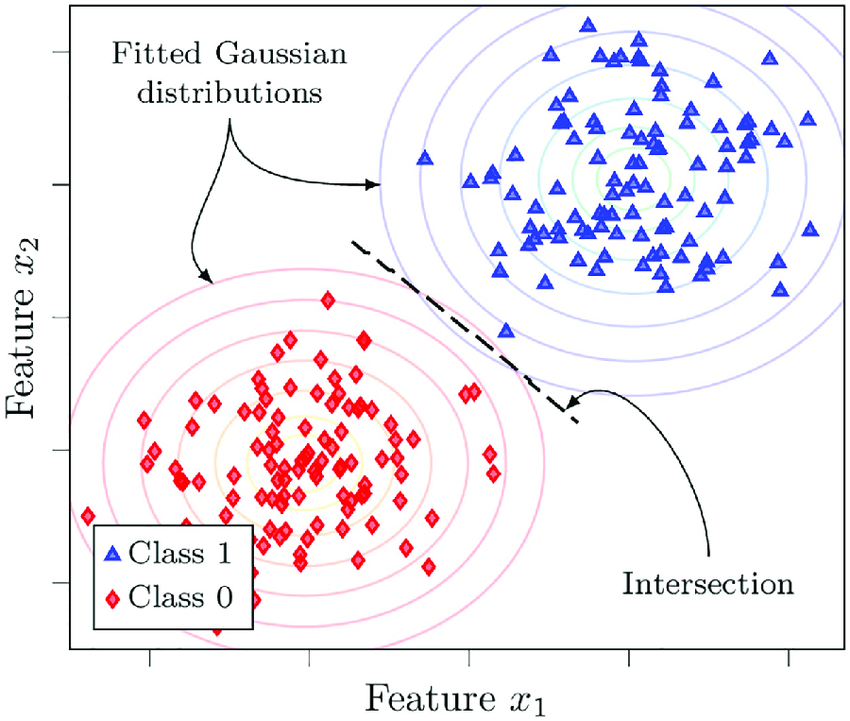
Binary Classification
In binary classification problems, where the outcomes are often categorized as success or failure, the binomial distribution forms the underlying probabilistic model. For instance, if we are predicting whether an email is spam or not, each email can be thought of as a Bernoulli trial.
Algorithms like Logistic Regression and Support Vector Machines (SVM) are particularly designed to handle these binary outcomes.
An example of binary classification – ResearchGate
Understanding the binomial distribution helps in correctly interpreting the results of these classifiers. The performance metrics such as accuracy, precision, recall, and F1-score ultimately derive from the binomial probability model.
This understanding ensures that we can make informed decisions about model improvements and performance evaluation.
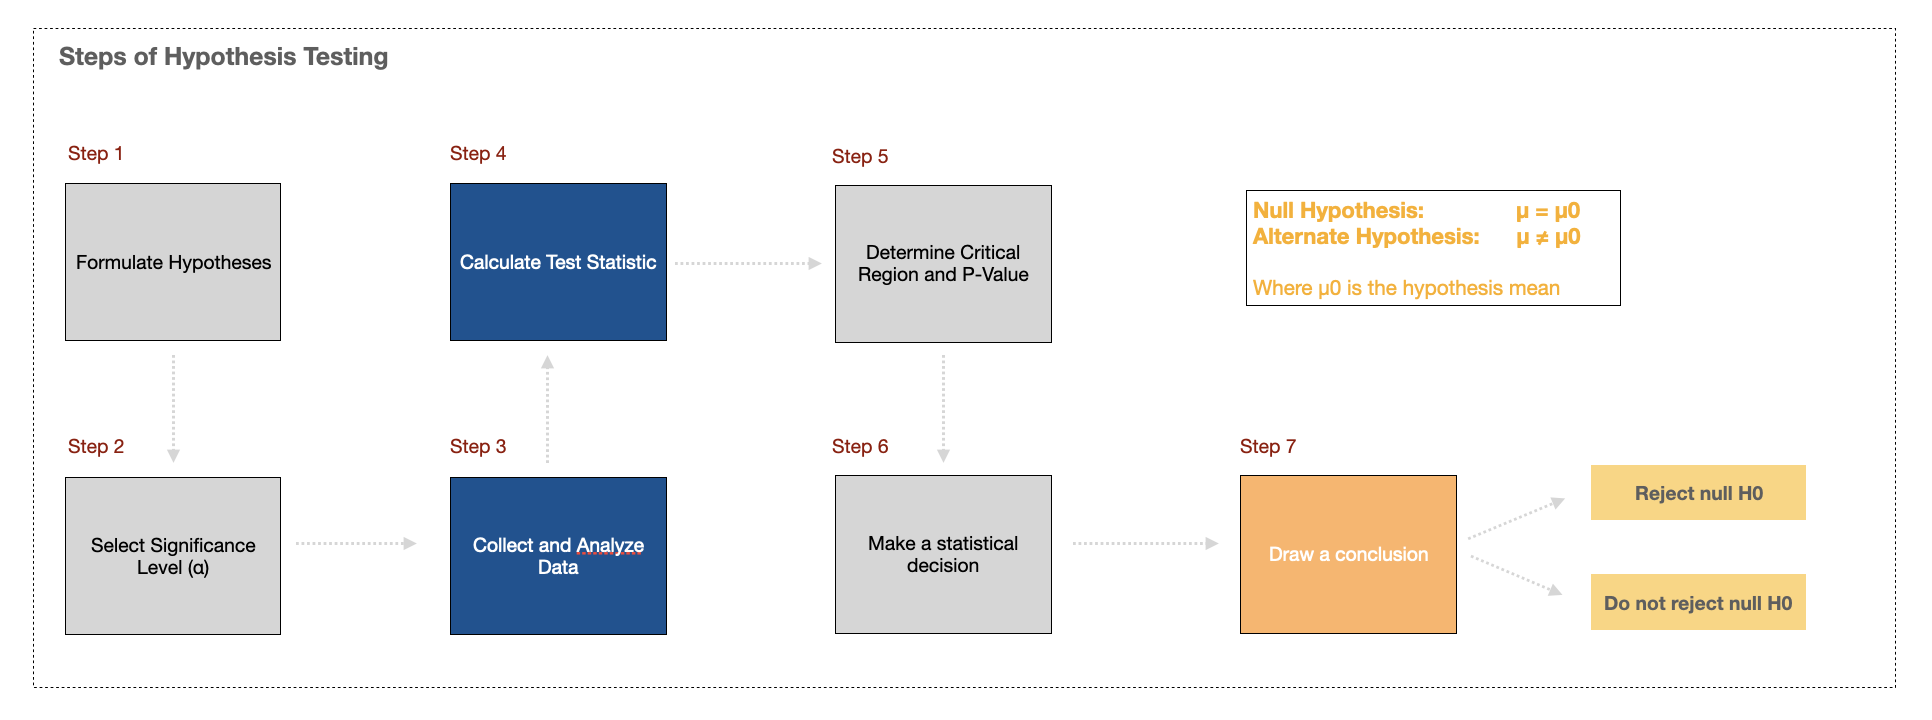
Hypothesis Testing
Statistical hypothesis testing, essential in validating machine learning models, often employs the binomial distribution to ascertain the significance of observed outcomes.
A typical process of hypothesis testing – Source: LinkedIn
For instance, in A/B testing, which is widely used in machine learning for comparing model performance or feature impact, the binomial distribution helps in calculating p-values and confidence intervals.
Consider an example where we want to determine if a new feature in a recommendation system improves user click-through rates. By modeling the click events as a binomial distribution, we can perform a hypothesis test to evaluate if the observed improvement is statistically significant or just due to random chance.
Generative Models
Generative models such as Naive Bayes leverage binomial distributions to model the probability of observing certain classes given specific features. This is particularly useful when dealing with binary or categorical data.
An illustration of Naive Bayes classifier – Source: ResearchGate
In text classification tasks, for example, the presence or absence of certain words (features) in a document can be modeled using binomial distributions to predict the document’s category (class).
By understanding the binomial distribution, we can better grasp how these models work under the hood, leading to more effective feature engineering and model tuning.
Monte Carlo simulations, which are used in various machine learning applications for uncertainty estimation and decision-making, often rely on binomial distributions to model and simulate binary events over numerous trials.
These simulations can help in understanding the variability and uncertainty in model predictions, providing a robust framework for decision-making in the presence of randomness.
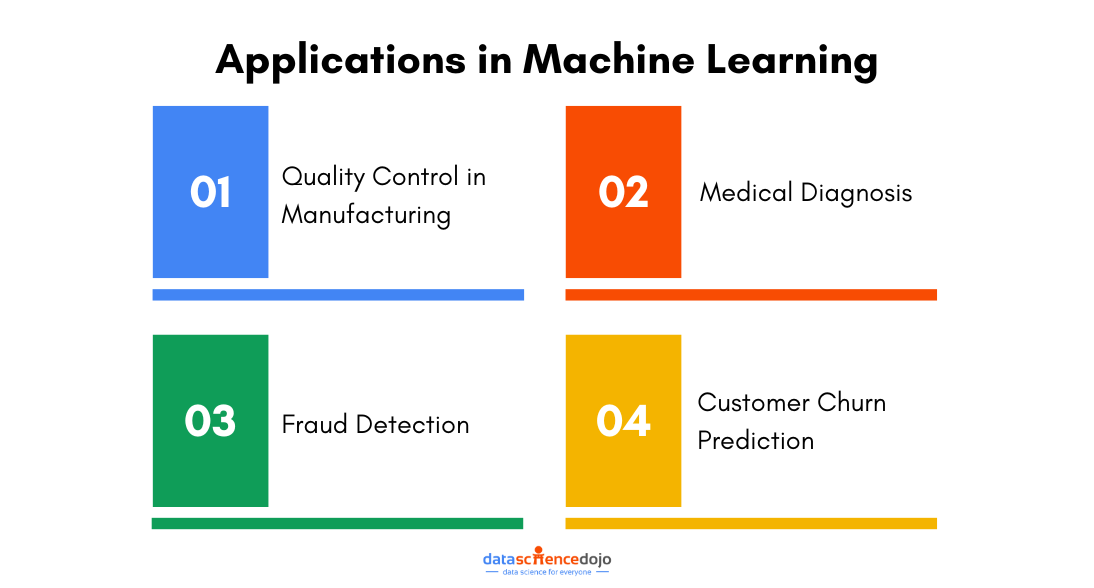
Practical Applications in Machine Learning
Quality Control in Manufacturing
In manufacturing, maintaining high-quality standards is crucial. Machine learning models are often deployed to predict the likelihood of defects in products.
Here, the binomial distribution is used to model the number of defective items in a batch. By understanding the distribution, we can set appropriate thresholds and confidence intervals to decide when to take corrective actions.
In medical diagnosis, machine learning models assist in predicting the presence or absence of a disease based on patient data. The binomial distribution provides a framework for understanding the probabilities of correct and incorrect diagnoses.
This is critical for evaluating the performance of diagnostic models and ensuring they meet the necessary accuracy and reliability standards.
Fraud Detection
Fraud detection systems in finance and e-commerce rely heavily on binary classification models to distinguish between legitimate and fraudulent transactions. The binomial distribution aids in modeling the occurrence of fraud and helps in setting detection thresholds that balance false positives and false negatives effectively.
Predicting customer churn is vital for businesses to retain their customer base. Machine learning models predict whether a customer will leave (churn) or stay (retain). The binomial distribution helps in understanding the probabilities of churn events and in setting up retention strategies based on these probabilities.
Why Use Binomial Distribution?
Binomial distribution is a fundamental concept that finds extensive application in machine learning. From binary classification to hypothesis testing and generative models, understanding and leveraging this distribution can significantly enhance the performance and interpretability of machine learning models.
By mastering the binomial distribution, you equip yourself with a powerful tool for tackling a wide range of problems in statistics and machine learning.
Feel free to dive deeper into this topic, experiment with different values, and explore the fascinating world of probability distributions in machine learning!
In the world of data analysis, drawing insights from a limited dataset can often be challenging. Traditional statistical methods sometimes fall short when it comes to deriving reliable estimates, especially with small or skewed datasets. This is where bootstrap sampling, a powerful and versatile statistical technique, comes into play.
In this blog, we’ll explore what bootstrap sampling is, how it works, and its various applications in the field of data analysis.
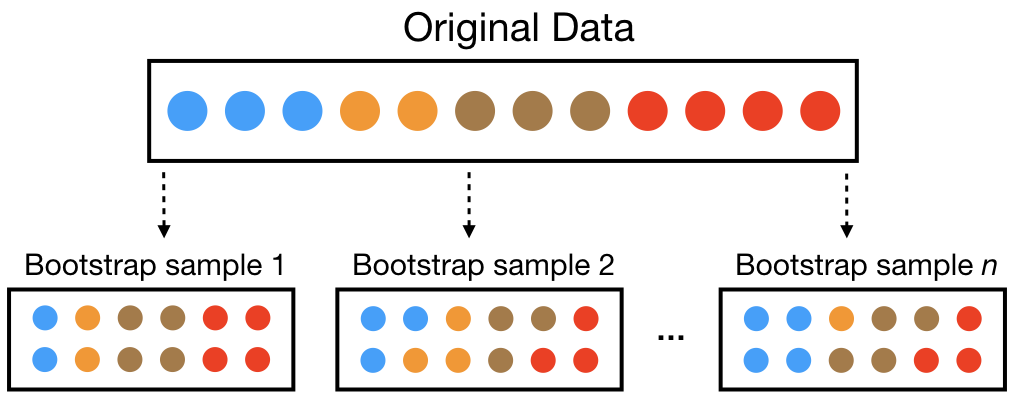
What is Bootstrap Sampling?
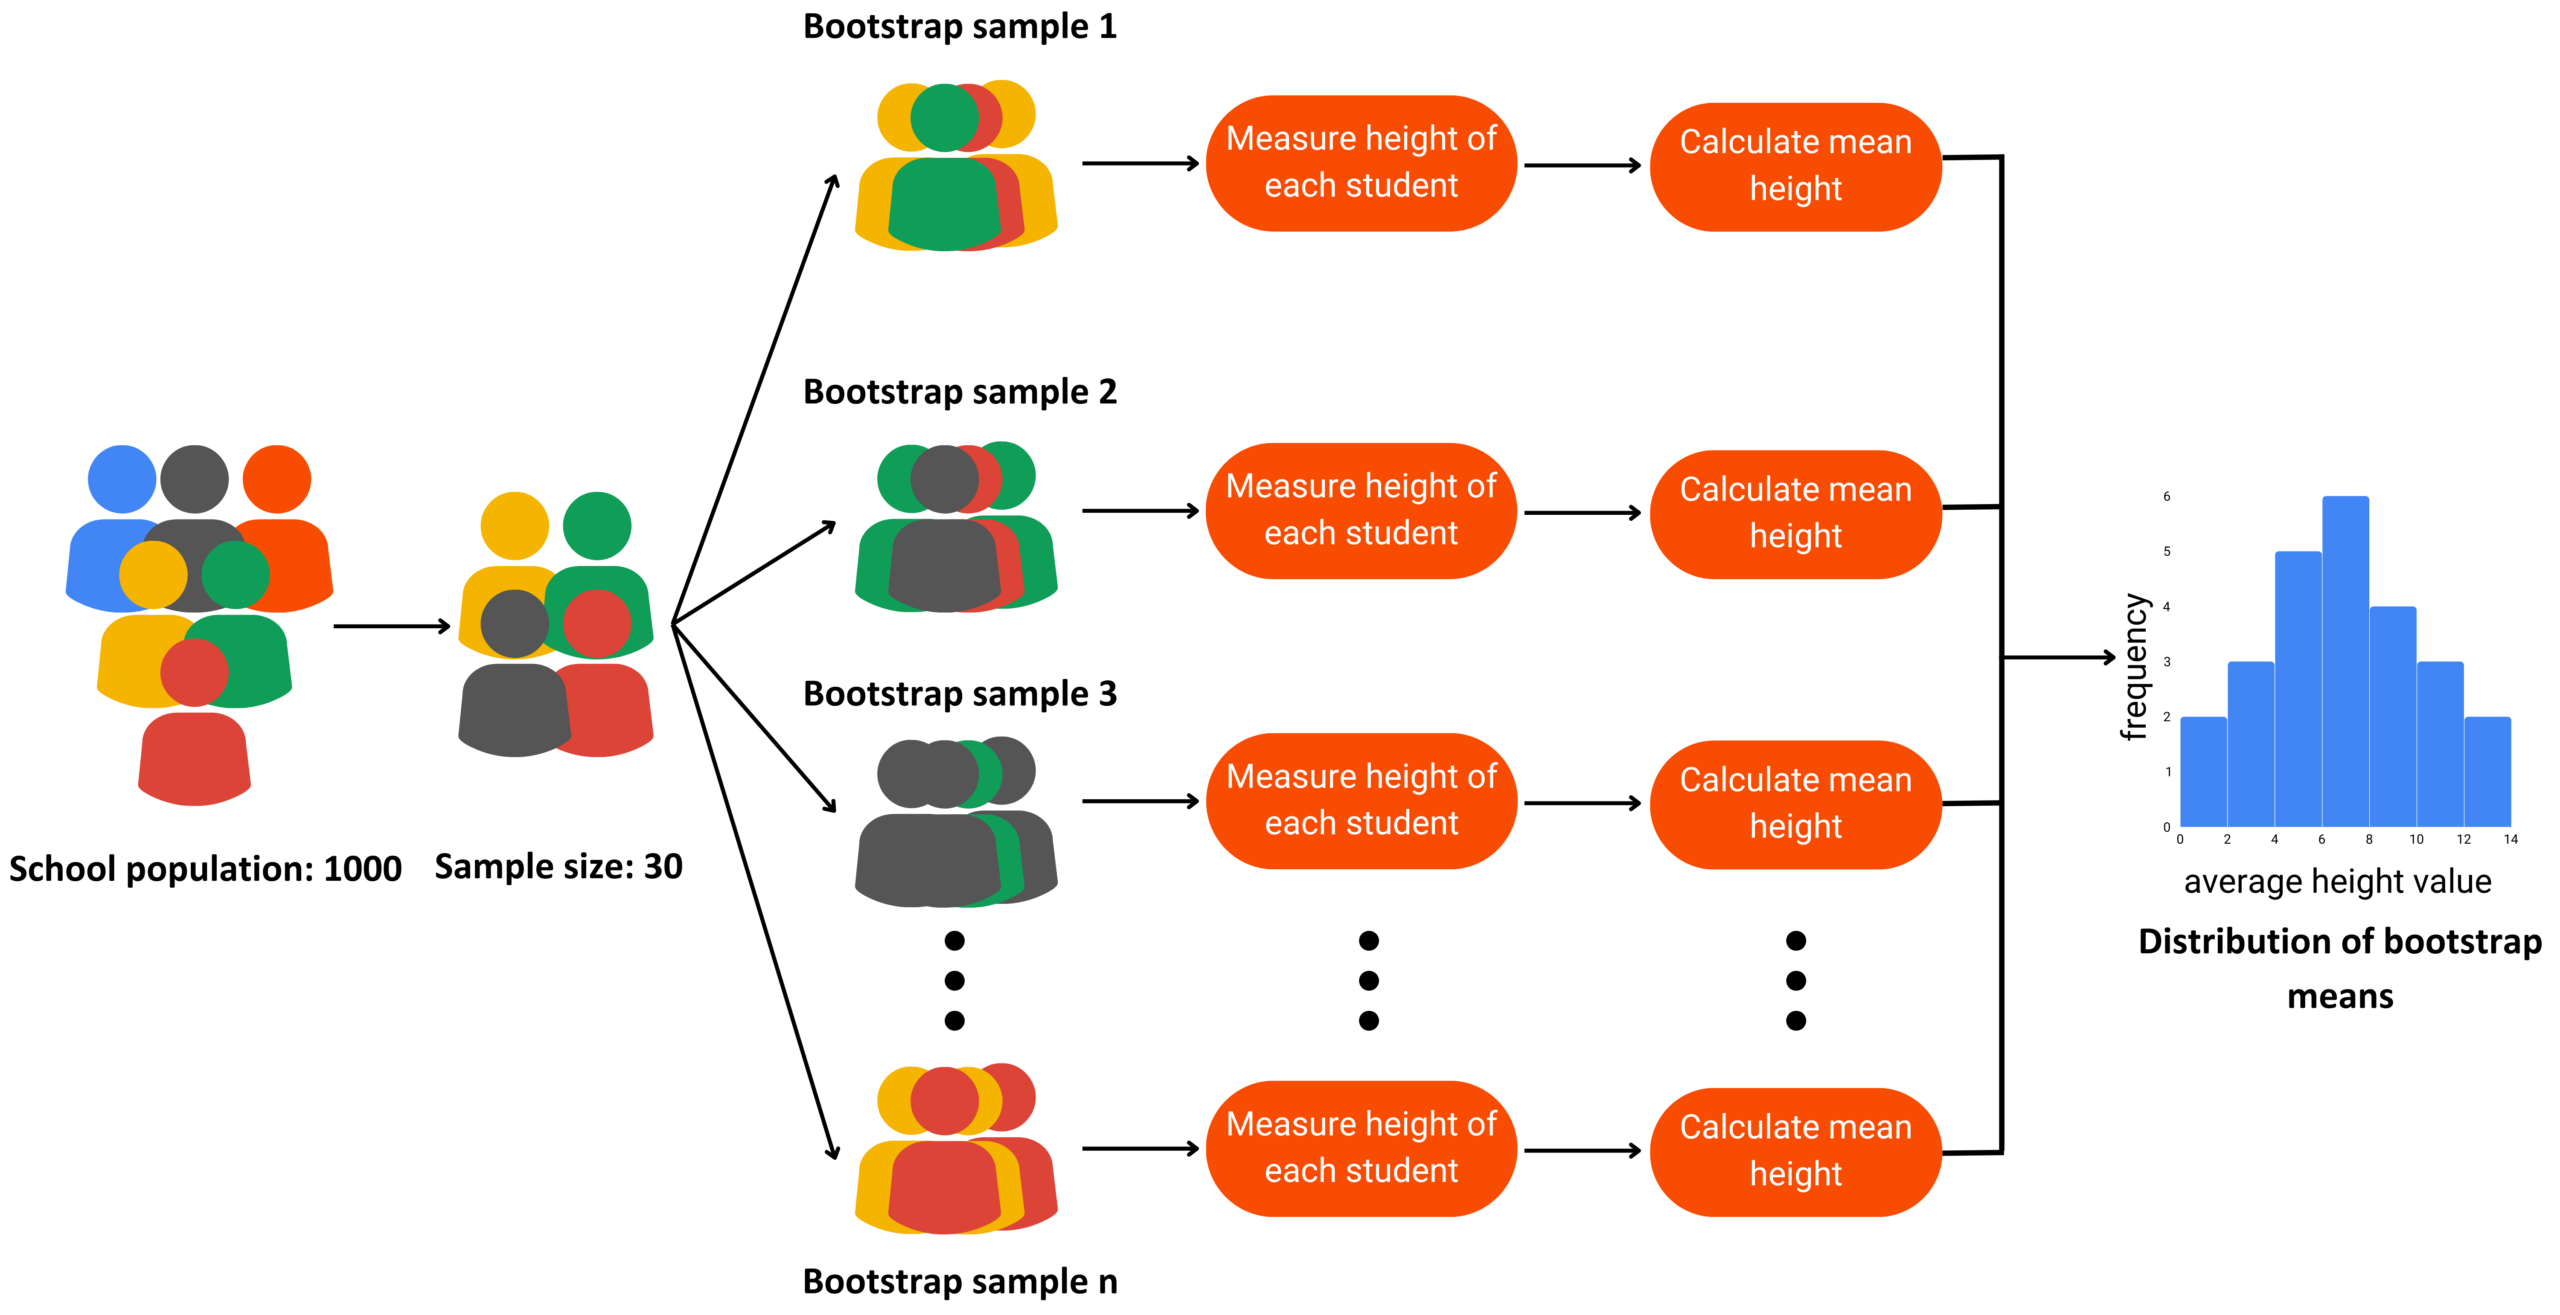
A visual representation of the bootstrap sampling scheme
Bootstrap sampling is a resampling method that involves repeatedly drawing samples from a dataset with replacements to estimate the sampling distribution of a statistic.
Essentially, you take multiple random samples from your original data, calculate the desired statistic for each sample, and use these results to infer properties about the population from which the original data was drawn.
This is a fundamental question I’ve seen machine learning enthusiasts grapple with. What is the point of bootstrap sampling? Where can you use it? Let me take an example to explain this.
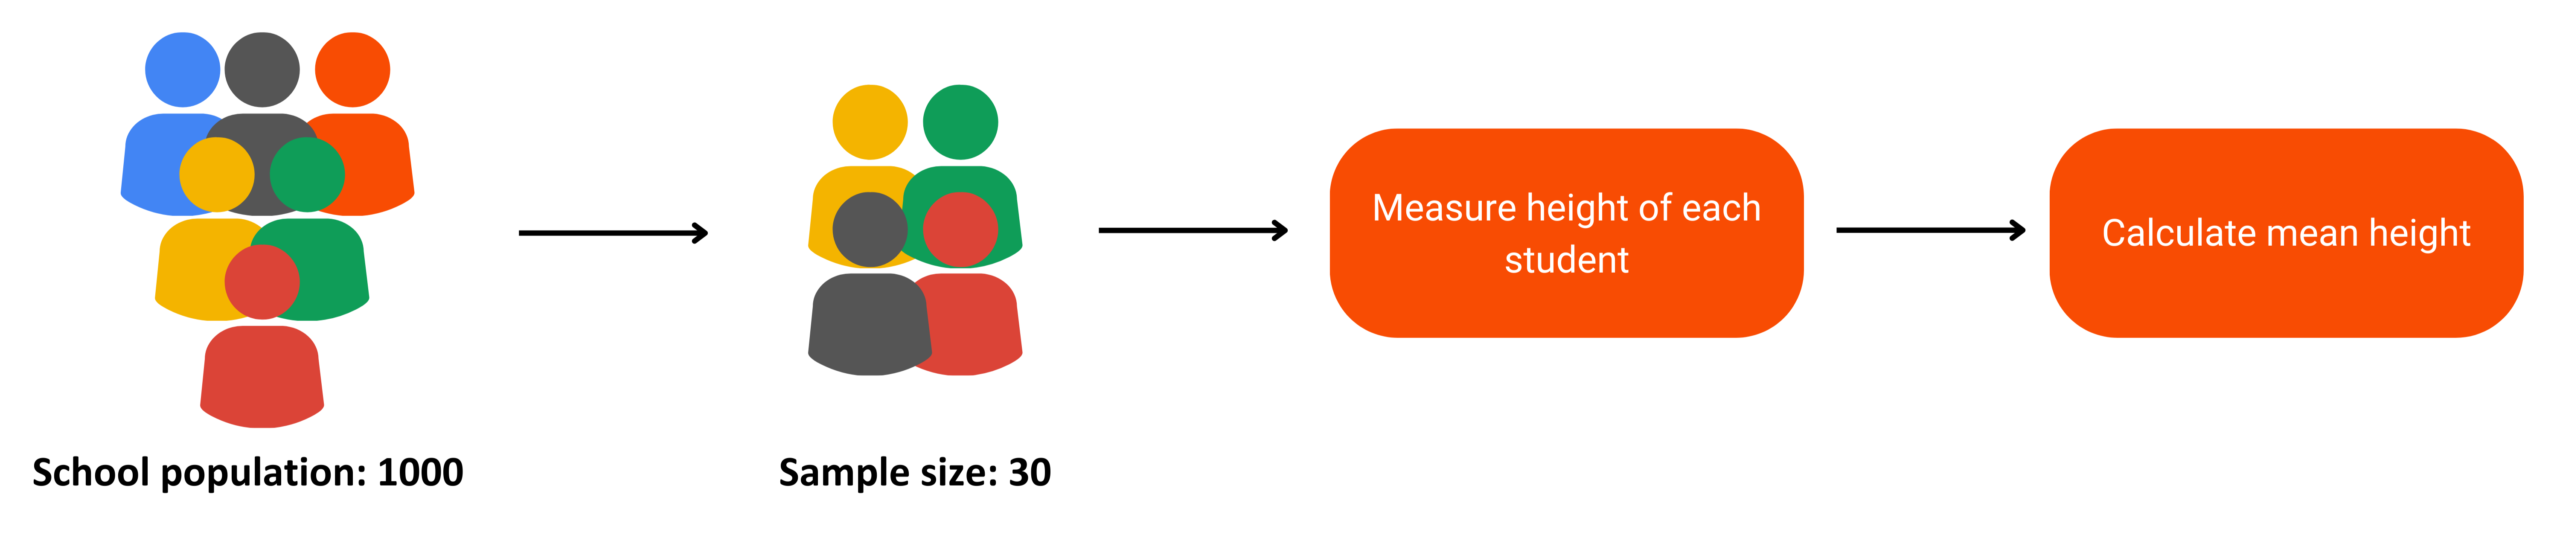
Let’s say we want to find the mean height of all the students in a school (which has a total population of 1,000). So, how can we perform this task?
One approach is to measure the height of a random sample of students and then compute the mean height. I’ve illustrated this process below.
Traditional Approach
Traditional method to sampling a distribution
Draw a random sample of 30 students from the school.
Measure the heights of these 30 students.
Compute the mean height of this sample.
However, this approach has limitations. The mean height calculated from this single sample might not be a reliable estimate of the population mean due to sampling variability. If we draw a different sample of 30 students, we might get a different mean height.
To address this, we need a way to assess the variability of our estimate and improve its accuracy. This is where bootstrap sampling comes into play.
Bootstrap Approach
Implementing bootstrap sampling
Draw a random sample of 30 students from the school and measure their heights. This is your original sample.
From this original sample, create many new samples (bootstrap samples) by randomly selecting students with replacements. For instance, generate 1,000 bootstrap samples.
For each bootstrap sample, calculate the mean height.
Use the distribution of these 1,000 bootstrap means to estimate the mean height of the population and to assess the variability of your estimate.
Implementation in Python
To illustrate the power of bootstrap sampling, let’s calculate a 95% confidence interval for the mean height of students in a school using Python. We will break down the process into clear steps.
Step 1: Import Necessary Libraries
First, we need to import the necessary libraries. We’ll use `numpy` for numerical operations and `matplotlib` for visualization.
Step 2: Create the Original Sample
We will create a sample dataset of heights. In a real-world scenario, this would be your collected data.
Step 3: Define the Bootstrap Function
We define a function that generates bootstrap samples and calculates the mean for each sample.
data: The original sample.
n_iterations: Number of bootstrap samples to generate.
-bootstrap_means: List to store the mean of each bootstrap sample.
-n_size: The original sample’s size will be the same for each bootstrap sample.
-np.random.choice: Randomly select elements from the original sample with replacements to create a bootstrap sample.
We use the function to generate 1,000 bootstrap samples and calculate the mean for each.
Step 5: Calculate the Confidence Interval
We calculate the 95% confidence interval from the bootstrap means.
np.percentile: Computes the specified percentile (2.5th and 97.5th) of the bootstrap means to determine the confidence interval.
Step 6: Visualize the Bootstrap Means
Finally, we can visualize the distribution of bootstrap means and the confidence interval.
plt.hist: Plots the histogram of bootstrap means.
plt.axvline: Draws vertical lines for the confidence interval.
By following these steps, you can use bootstrap sampling to estimate the mean height of a population and assess the variability of your estimate. This method is simple yet powerful, making it a valuable tool in statistical analysis and data science.
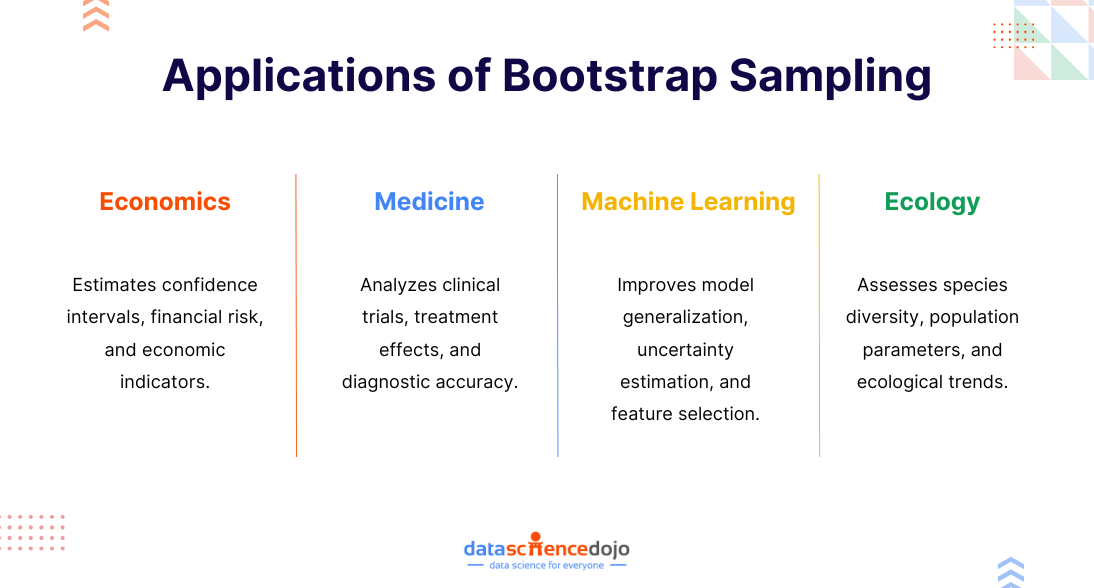
Bootstrap sampling is widely used across various fields, including the following:
Economics
Bootstrap sampling is a versatile tool in economics. It excels in handling non-normal data, commonly found in economic datasets. Key applications include constructing confidence intervals for complex estimators, performing hypothesis tests without parametric assumptions, evaluating model performance, and assessing financial risk.
For instance, economists use bootstrap to estimate income inequality measures, analyze macroeconomic time series, and evaluate the impact of economic policies. The technique is also used to estimate economic indicators, such as inflation rates or GDP growth, where traditional methods might be inadequate.
Bootstrap sampling is applied in medicine to analyze clinical trial data, estimate treatment effects, and assess diagnostic test accuracy. It helps in constructing confidence intervals for treatment effects, evaluating the performance of different diagnostic tests, and identifying potential confounders.
Bootstrap can be used to estimate survival probabilities in survival analysis and to assess the reliability of medical imaging techniques. It is also suitable to assess the reliability of clinical trial results, especially when sample sizes are small or the data is not normally distributed.
In machine learning, bootstrap estimates model uncertainty, improves model generalization, and selects optimal hyperparameters. It aids in tasks like constructing confidence intervals for model predictions, assessing the stability of machine learning models, and performing feature selection.
Bootstrap can create multiple bootstrap samples for training and evaluating different models, helping to identify the best-performing model and prevent overfitting. For instance, it can evaluate the performance of predictive models through techniques like bootstrapped cross-validation.
Ecology
Ecologists utilize bootstrap sampling to estimate population parameters, assess species diversity, and analyze ecological relationships. It helps in constructing confidence intervals for population means, medians, or quantiles, estimating species richness, and evaluating the impact of environmental factors on ecological communities.
Bootstrap is also employed in community ecology to compare species diversity between different habitats or time periods.
Advantages and Disadvantages
Advantages
Disadvantages
Non-parametric Method: No assumptions about the underlying distribution of the data, making it highly versatile for various types of datasets.
Computationally Intensive: Requires many resamples, which can be computationally expensive, especially with large datasets.
Flexibility: Can be used with a wide range of statistics and datasets, including complex measures like regression coefficients and other model parameters.
Not Always Accurate: May not perform well with very small sample sizes or highly skewed data. The quality of the bootstrap estimates depends on the original sample representative of the population.
Simplicity: Conceptually straightforward and easy to implement with modern computational tools, making it accessible even for those with basic statistical knowledge.
Outlier Sensitivity: Bootstrap sampling can be affected by outliers in the original data. Since the method involves sampling with replacement, outliers can appear multiple times in bootstrap samples, potentially biasing the estimated statistics.
To Sum it Up
Bootstrap sampling is a powerful tool for data analysis, offering flexibility and practicality in a wide range of applications. By repeatedly resampling from your dataset and calculating the desired statistic, you can gain insights into the variability and reliability of your estimates, even when traditional methods fall short.
Whether you’re working in economics, medicine, machine learning, or ecology, understanding and utilizing bootstrap sampling can enhance your analytical capabilities and lead to more robust conclusions.
“Statistics is the grammar of science”, Karl Pearson.
A strong grasp of statistical concepts is crucial for anyone working with data. Whether you’re a data scientist, analyst, or researcher, understanding these fundamental principles helps you interpret data accurately, identify patterns, and make informed decisions.
From probability distributions to hypothesis testing, statistical concepts are the foundation of data analysis and machine learning.
In this blog, we’ll break down the most important statistical concepts, explaining them in simple terms with practical examples. By the end, you’ll have a solid foundation to apply statistics confidently in real-world scenarios. Let’s dive in!
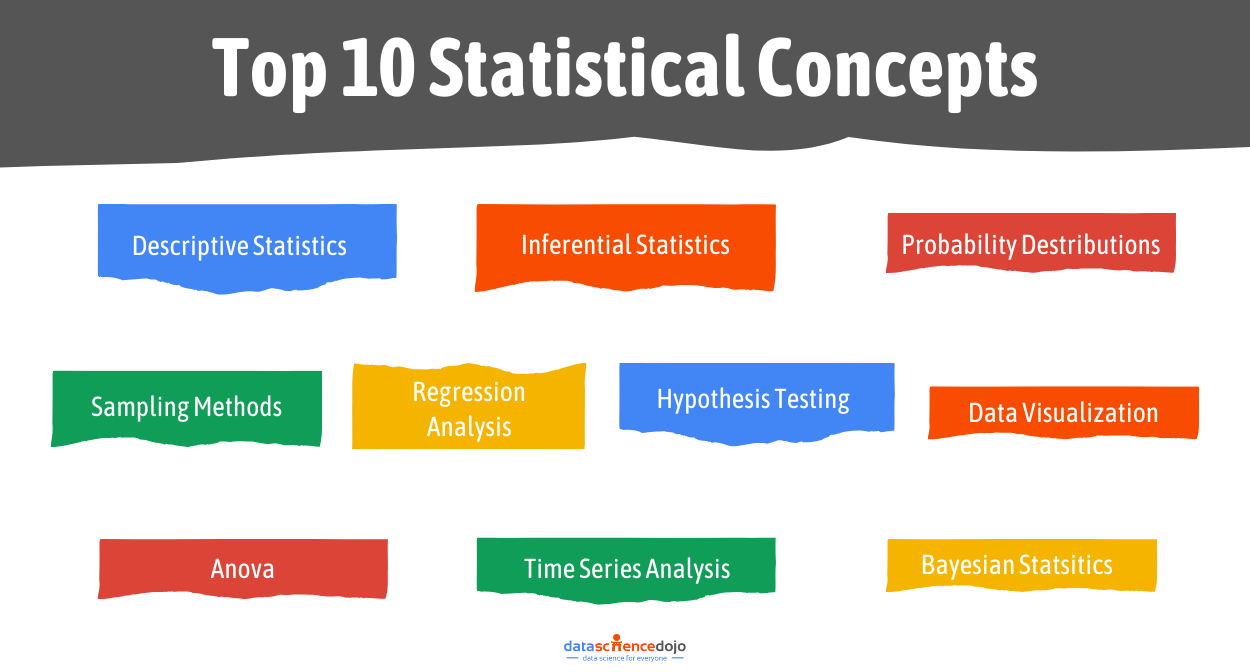
10 Statistical Concepts You Should Know
1. Descriptive Statistics:
Starting with one of the most fundamental and essential statistical concepts, descriptive statistics. Descriptive statistics are the specific methods and measures that describe the data. It’s like the foundation of your building. It is a sturdy groundwork upon which further analysis can be constructed.
Descriptive statistics can be broken down into measures of central tendency and measures of variability.
Measure of Central Tendency:
Central Tendency is defined as “the number used to represent the center or middle of a set of data values”. It is a single value that is typically representative of the whole data. They help us understand where the “average” or “central” point lies amidst a collection of data points.
There are a few techniques to find the central tendency of the data, namely “Mean” (average), “Median” (middle value when data is sorted), and “Mode” (most frequently occurring values).
Measures of variability:
Measures of variability describe the spread, dispersion, and deviation of the data. In essence, they tell us how much each value point deviates from the central tendency. A few measures of variability are “Range”, “Variance”, “Standard Deviation”, and “Quartile Range”.
These provide valuable insights into the degree of variability or uniformity in the data.
2. Inferential Statistics:
Inferential statistics enable us to draw conclusions about the population from a sample of the population. Imagine having to decide whether a medicinal drug is good or bad for the general public. It is practically impossible to test it on every single member of the population.
This is where inferential statistics comes in handy. Inferential statistics employ techniques such as hypothesis testing and regression analysis (also discussed later) to determine the likelihood of observed patterns occurring by chance and to estimate population parameters.
This invaluable tool empowers data scientists and researchers to go beyond descriptive analysis and uncover deeper insights, allowing them to make data-driven decisions and formulate hypotheses about the broader context from which the data was sampled.
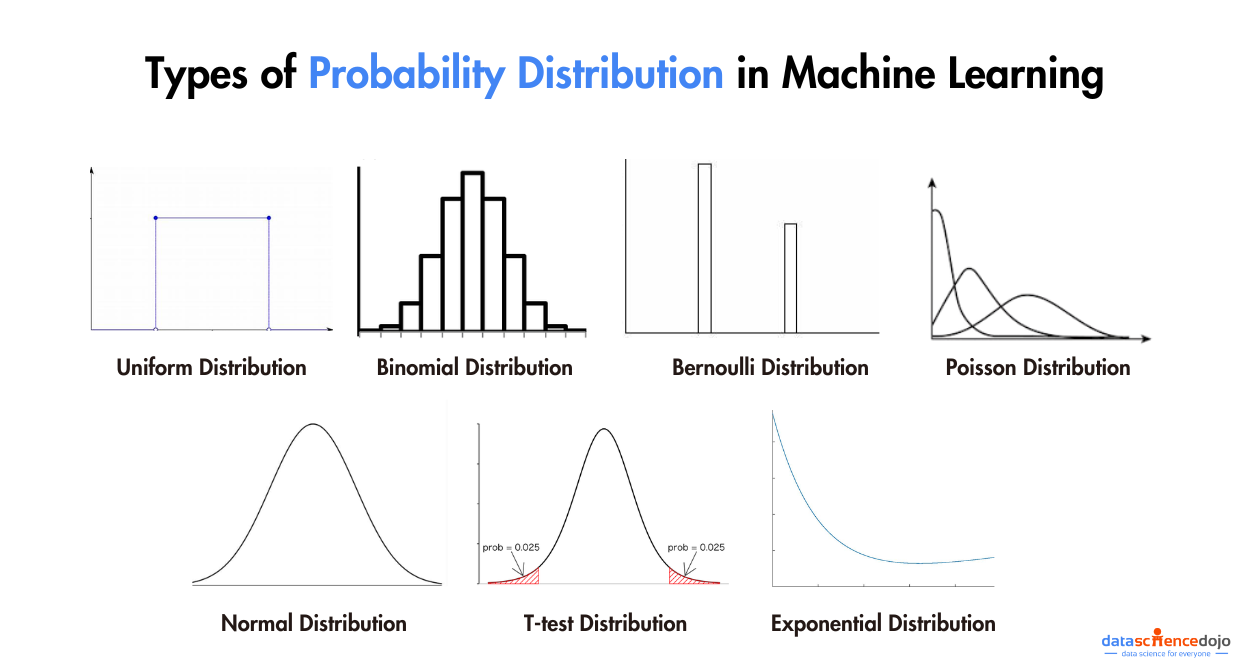
3. Probability Distributions:
Probability distributions serve as foundational concepts in statistics and mathematics, providing a structured framework for characterizing the probabilities of various outcomes in random events. Poisson distributions offer structured representations for understanding how data is distributed across different values or occurrences.
Much like navigational charts guiding explorers through uncharted territory, probability distributions function as reliable guides through the landscape of uncertainty, enabling us to quantitatively assess the likelihood of specific events.
They constitute essential tools for statistical analysis, hypothesis testing, and predictive modeling, furnishing a systematic approach to evaluate, analyze, and make informed decisions in scenarios involving randomness and unpredictability. Comprehension of probability distributions is imperative for effectively modeling and interpreting real-world data and facilitating accurate predictions.
4. Sampling Methods:
We now know inferential statistics help us make conclusions about the population from a sample of the population. How do we ensure that the sample is representative of the population? This is where sampling methods come to aid us.
Sampling methods are a set of methods that help us pick our sample set out of the population. Sampling methods are indispensable in surveys, experiments, and observational studies, ensuring that our conclusions are both efficient and statistically valid.
There are many types of sampling methods. Some of the most common ones are defined below.
Simple Random Sampling: A method where each member of the population has an equal chance of being selected for the sample, typically through random processes.
Stratified Sampling: The population is divided into subgroups (strata), and a random sample is taken from each stratum in proportion to its size.
Systematic Sampling: Selecting every “kth” element from a population list, using a systematic approach to create the sample.
Cluster Sampling: The population is divided into clusters, and a random sample of clusters is selected, with all members in selected clusters included.
Convenience Sampling: Selection of individuals/items based on convenience or availability, often leading to non-representative samples.
Purposive (Judgmental) Sampling: Researchers deliberately select specific individuals/items based on their expertise or judgment, potentially introducing bias.
Quota Sampling: The population is divided into subgroups, and individuals are purposively selected from each subgroup to meet predetermined quotas.
Snowball Sampling: Used in hard-to-reach populations, where participants refer researchers to others, leading to an expanding sample.
5. Regression Analysis:
Regression analysis is a statistical method that helps us quantify the relationship between a dependent variable and one or more independent variables. It’s like drawing a line through data points to understand and predict how changes in one variable relate to changes in another.
Regression models, such as linear regression or logistic regression, are used to uncover patterns and causal relationships in diverse fields like economics, healthcare, and social sciences. This technique empowers researchers to make predictions, analyze cause-and-effect connections, and gain insights into complex phenomena.
Hypothesis testing is a key field of statistical concepts used to assess claims or hypotheses about a population using sample data. It’s like a process of weighing evidence to determine if there’s enough proof to support a hypothesis.
Researchers formulate a null hypothesis and an alternative hypothesis, then use statistical tests to evaluate whether the data supports rejecting the null hypothesis in favor of the alternative.
This method is crucial for making informed decisions, drawing meaningful conclusions, and assessing the significance of observed effects in various fields of research and decision-making.
7. Data visualizations:
Data visualization is the art and science of representing complex data in a visual and comprehensible form. It’s like translating the language of numbers and statistics into a graphical story that anyone can understand at a glance.
Effective data visualization not only makes data more accessible but also allows us to spot trends, patterns, and outliers, making it an essential tool for data analysis and decision-making. Whether through charts, graphs, maps, or interactive dashboards, data visualization empowers us to convey insights, share information, and gain a deeper understanding of complex datasets.
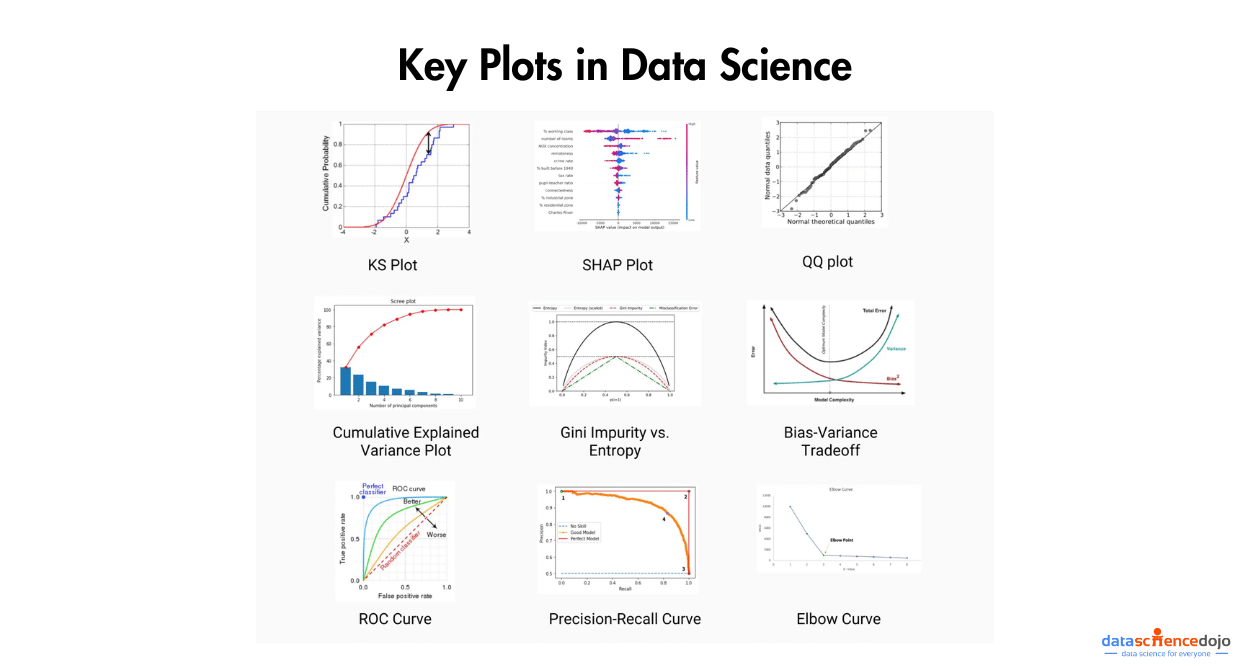
Check out some of the most important plots for Data Science here.
8. ANOVA (Analysis of variance):
Analysis of Variance (ANOVA) is one of the statistical concepts used to compare the means of two or more groups to determine if there are significant differences among them. It’s like the referee in a sports tournament, checking if there’s enough evidence to conclude that the teams’ performances are different.
ANOVA calculates a test statistic and a p-value, which indicates whether the observed differences in means are statistically significant or likely occurred by chance.
This method is widely used in research and experimental studies, allowing researchers to assess the impact of different factors or treatments on a dependent variable and draw meaningful conclusions about group differences. ANOVA is a powerful tool for hypothesis testing and plays a vital role in various fields, from medicine and psychology to economics and engineering.
9. Time Series analysis:
Time series analysis is a specialized field of statistical concepts and data science that focuses on studying data points collected, recorded, or measured over time. It’s like examining the historical trajectory of a variable to understand its patterns and trends.
Time series analysis involves techniques for data visualization, smoothing, forecasting, and modeling to uncover insights and make predictions about future values.
This discipline finds applications in various domains, from finance and economics to climate science and stock market predictions, helping analysts and researchers understand and harness the temporal patterns within their data.
10. Bayesian Statistics:
Bayesian statistics is a branch of statistics that takes a unique approach to probability and inference. Unlike classical statistics, which use fixed parameters, Bayesian statistics treat probability as a measure of uncertainty, updating beliefs based on prior information and new evidence.
It’s like continually refining your knowledge as you gather more data. Bayesian methods are particularly useful when dealing with complex, uncertain, or small-sample data, and they have applications in fields like machine learning, Bayesian networks, and decision analysis.
Conclusion
Statistics is more than just numbers—it serves as the backbone of data science, enabling the extraction of insights, making predictions, and driving informed decisions. From descriptive measures to Bayesian analysis, each one of the statistical concepts plays a vital role in understanding and interpreting data effectively.
Mastering these principles equips data scientists with the tools to navigate uncertainty, validate hypotheses, and communicate findings clearly. As data continues to shape industries and innovations, a strong foundation in statistics remains essential for thriving in the data-driven world.
The world we live in is defined by numbers and equations. From the simplest calculations to the most complex scientific theories, equations are the threads that weave the fabric of our understanding.
In this blog, we will step on a journey through the corridors of mathematical and scientific history, where we encounter the most influential equations that have shaped the course of human knowledge and innovation.
These equations are not mere symbols on a page; they are the keys that unlocked the mysteries of the universe, allowed us to build bridges that span great distances, enabled us to explore the cosmos, and even predicted the behavior of financial markets.
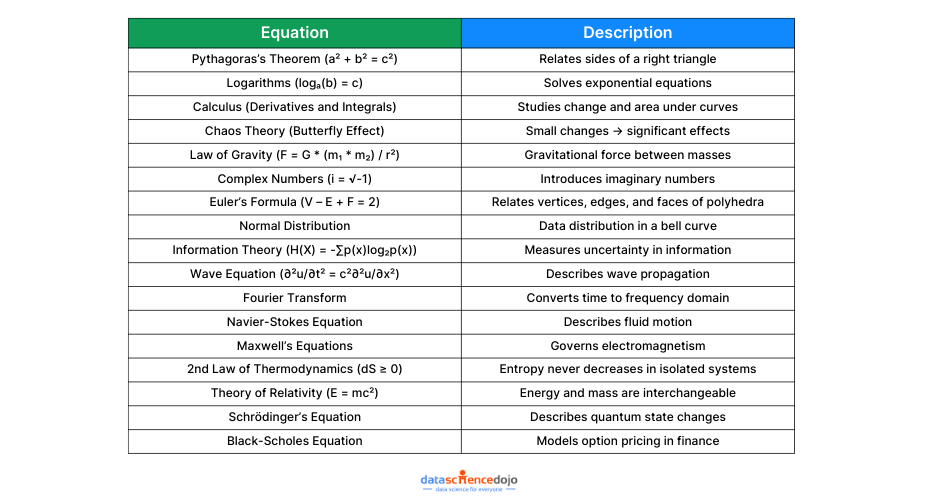
Get into the worlds of geometry, physics, mathematics, and more, to uncover the stories behind these 17 equations. From Pythagoras’s Theorem to the Black-Scholes Equation, each has its own unique tale, its own moment of revelation, and its own profound impact on our lives.
Geometry and Trigonometry:
1. Pythagoras’s Theorem
Formula: a^2 + b^2 = c^2
Pythagoras’s Theorem is a mathematical formula that relates the lengths of the three sides of a right triangle. It states that the square of the hypotenuse (the longest side) is equal to the sum of the squares of the other two sides.
Suppose you have a right triangle with two sides that measure 3 cm and 4 cm. To find the length of the hypotenuse, you would use the Pythagorean Theorem:
a^2 + b^2 = c^2
3^2 + 4^2 = c^2
9 + 16 = c^2
25 = c^2
c = 5
Therefore, the hypotenuse of the triangle is 5 cm.
Pythagoras’s Theorem is used in many different areas of work, including construction, surveying, and engineering. It is also used in everyday life, such as when measuring the distance between two points or calculating the height of a building.
Mathematics:
2. Logarithms
Formula: log(a, b) = c
Logarithms are a mathematical operation that is used to solve exponential equations. They are also used to scale numbers and compress data.
Example: Suppose you want to find the value of x in the following equation:2^x = 1024You can use logarithms to solve this equation by taking the logarithm of both sides:log(2^x, 2) = log(1024, 2)x * log(2, 2) = 10 * log(2, 2)x = 10Therefore, the value of x is 10.Logarithms are used in many different areas of work, including finance, engineering, and science.
They are also used in everyday life, such as when calculating interest rates or converting units.
3. Calculus
Calculus is a branch of mathematics that deals with rates of change. It is used to solve problems in many different areas of work, including physics, engineering, and economics.
One of the most important concepts in calculus is the derivative. The derivative of a function measures the rate of change of the function at a given point.
Another important concept in calculus is the integral. The integral of a function is the sum of the infinitely small areas under the curve of the function.
Example:
Suppose you have a function that represents the distance you have traveled over time. The derivative of this function would represent your speed. The integral of this function would represent your total distance traveled.
Calculus is a powerful tool that can be used to solve many different types of problems. It is used in many different areas of work, including science, engineering, and economics.
4. Chaos Theory
Chaos theory is a branch of mathematics that studies the behavior of dynamic systems. It is used to model many different types of systems, such as the weather, the stock market, and the human heart.
One of the most important concepts in chaos theory is the butterfly effect. The butterfly effect states that small changes in the initial conditions of a system can lead to large changes in the long-term behavior of the system.
Example:
Suppose you have a butterfly flapping its wings in Brazil. This could cause a small change in the atmosphere, which could eventually lead to a hurricane in Florida.
Chaos theory is used in many different areas of physics, engineering, and economics. It is also used in everyday life, such as when predicting the weather and managing financial risks.
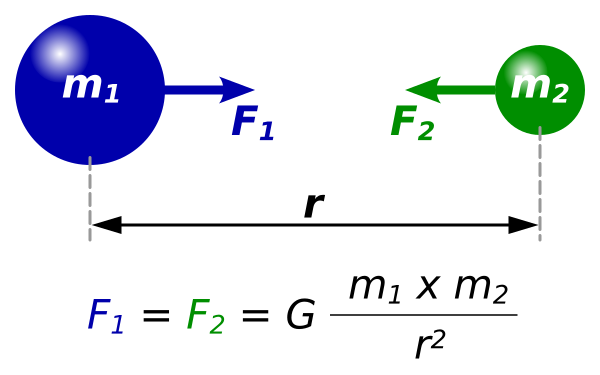
The law of gravity is a physical law that describes the gravitational force between two objects. It states that the force between two objects is proportional to the product of their masses and inversely proportional to the square of the distance between them.
source: simple.wikipedia.org
Example:
Suppose you have two objects, each with a mass of 1 kg. The gravitational force between the two objects would be 6.67 x 10^-11 N.
If you double the distance between the two objects, the gravitational force between them would be halved.
The law of gravity is used in many different areas of work, including astronomy, space exploration, and engineering. It is also used in everyday life, such as when calculating the weight of an object or the trajectory of a projectile.
Complex Numbers
6.The square root of minus one
Formula: i = sqrt(-1)
The square root of minus one is a complex number that is denoted by the letter i. It is defined as the number that, when multiplied by itself, equals -1.
Example:
i * i = -1
The square root of minus one is used in many different areas of mathematics, physics, and engineering. It is also used in everyday life, such as when calculating the voltage and current in an electrical circuit.
Euler’s formula for polyhedra is a mathematical formula that relates the number of vertices, edges, and faces of a polyhedron. It states that the number of vertices minus the number of edges plus the number of faces is always equal to 2.
Example:
Suppose you have a cube. A cube has 8 vertices, 12 edges, and 6 faces. If you plug these values into Euler’s formula, you get:
The normal distribution, also known as the Gaussian distribution, is a probability distribution that is symmetrical and bell-shaped. It is used to model many different natural phenomena, such as human height, IQ scores, and measurement errors.
Example: Suppose you have a class of 30 students, and you want to know the average height of the students. You measure the height of each student and create a histogram of the results. You will likely find that the histogram is bell-shaped, with most of the students clustered around the average height and fewer students at the extremes.
This is because the height of humans is normally distributed. The normal distribution is used in many different areas of work, including statistics, finance, and engineering. It is also used in everyday life, such as when predicting the likelihood of a certain event happening.
9. Information Theory
Formula: H(X) = -∑p(x) log2(p(x))
Information theory is a branch of mathematics that studies the transmission and processing of information. It was developed by Claude Shannon in the mid-20th century.
One of the most important concepts in information theory is entropy. Entropy is a measure of the uncertainty in a message. The higher the entropy of a message, the more uncertain it is.
Example:
Suppose you have a coin. The entropy of the coin is 1 bit, because there are two equally likely outcomes: heads or tails.
If you flip the coin and it lands on heads, the entropy of the coin is 0, because there is only one possible outcome: heads.
Information theory is used in many different areas of communication, computer science, and statistics. It is also used in everyday life, such as when designing data compression algorithms and communication protocols.
The wave equation is a differential equation that describes the propagation of waves. It is used to model many different types of waves, such as sound waves, light waves, and water waves.
Example:
Suppose you throw a rock into a pond. The rock will create a disturbance in the water that will propagate outwards in the form of a wave. The wave equation can be used to model the propagation of this wave.
The wave equation is used in many different areas of physics, engineering, and computer science. It is also used in everyday life, such as when designing sound systems and optical devices.
The Fourier transform is a mathematical operation that transforms a function from the time domain to the frequency domain. It is used to analyze signals and images.
Example:
Suppose you have a sound recording. The Fourier transform of the sound recording can be used to identify the different frequencies that are present in the recording. This information can then be used to compress the recording or to remove noise from the recording.
The Fourier transform is used in many different areas of science and engineering. It is also used in everyday life, such as in digital signal processing and image processing.
The Navier-Stokes equations are a system of differential equations that describe the motion of fluids. They are used to model many different types of fluid flow, such as the flow of air around an airplane wing and the flow of blood through the body.
Example:
Suppose you are designing an airplane wing. You can use the Navier-Stokes equations to simulate the flow of air around the wing and to determine the lift and drag forces that the wing will experience.
The Navier-Stokes equations are used in many different areas of engineering, such as aerospace engineering, mechanical engineering, and civil engineering. They are also used in physics and meteorology.
Maxwell’s equations are a set of four equations that describe the behavior of electric and magnetic fields. They are used to model many different phenomena, such as the propagation of light waves and the operation of electrical devices.
Example:
Suppose you are designing a generator. You can use Maxwell’s equations to simulate the flow of electric and magnetic fields in the generator and to determine the amount of electricity that the generator will produce.
Maxwell’s equations are used in many different areas of physics and engineering. They are also used in everyday life, such as in the design of electrical devices and communication systems.
14. Second Law of Thermodynamics
Formula: dS ≥ 0
The second law of thermodynamics states that the total entropy of an isolated system can never decrease over time. Entropy is a measure of the disorder of a system.
Example:
Suppose you have a cup of hot coffee. The coffee is initially ordered, with the hot molecules at the top of the cup and the cold molecules at the bottom of the cup. Over time, the coffee will cool down and the molecules will become more disordered. This is because the second law of thermodynamics requires the total entropy of the system to increase over time.
The second law of thermodynamics is used in many different areas of physics, engineering, and economics. It is also used in everyday life, such as when designing power plants and refrigerators.
Physics and Cosmology:
15. Relativity
Formula: E = mc^2
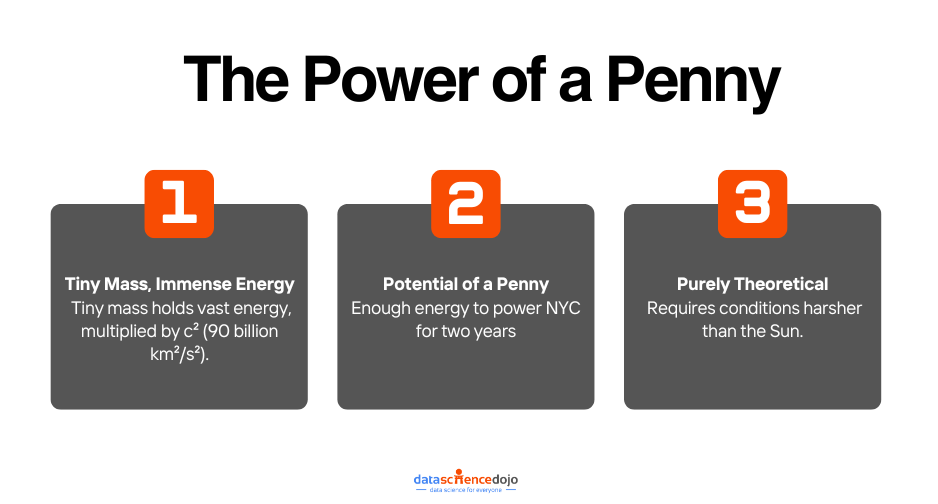
Relativity is a branch of physics that studies the relationship between space and time. It was developed by Albert Einstein in the early 20th century. One of the most famous equations in relativity is E = mc^2, which states that energy and mass are equivalent. This means that energy can be converted into mass and vice versa.
Example: Suppose you have a nuclear reactor. The nuclear reactor converts nuclear energy into mass. This is because the nuclear reactor converts the energy of the nuclear binding force into mass. Relativity is used in many different areas of physics, astronomy, and engineering. It is also used in everyday life, such as in the design of GPS systems and particle accelerators.
16. Schrödinger’s Equation
Formula: iℏ∂ψ/∂t = Hψ
Schrödinger’s equation is a differential equation that describes the behavior of quantum mechanical systems. It is used to model many different types of quantum systems, such as atoms, molecules, and electrons.
Example:
Suppose you have a hydrogen atom. The Schrödinger equation can be used to calculate the energy levels of the hydrogen atom and the probability of finding the electron in a particular region of space.
Schrödinger’s equation is used in many different areas of physics, chemistry, and materials science. It is also used in the development of new technologies, such as quantum computers and quantum lasers.
Finance and Economics:
17. Black-Scholes Equation
Formula: ∂C/∂t + ½σ^2S^2∂^2C/∂S^2 – rC = 0
The Black-Scholes equation is a differential equation that describes the price of a European option. A European option is a financial contract that gives the holder the right, but not the obligation, to buy or sell an asset at a certain price on a certain date.
The Black-Scholes equation is used to price options and to develop hedging strategies. It is one of the most important equations in finance.
Example:
Suppose you are buying a call option on a stock. The Black-Scholes equation can be used to calculate the price of the call option. This information can then be used to decide whether or not to buy the call option and to determine how much to pay for it.
The Black-Scholes equation is used by many different financial institutions, such as investment banks and hedge funds. It is also used by individual investors to make investment decisions.
Share Your Favorite Equation With Us!
Mathematics and science are not just abstract concepts but the very foundations upon which our modern world stands. These 17 equations have not only changed the way we see the world but have also paved the way for countless innovations and advancements.
From the elegance of Euler’s Formula for Polyhedra to the complexity of Maxwell’s Equations, from the order of Normal Distribution to the chaos of Chaos Theory, each equation has left an indelible mark on the human story.
They have transcended their origins and become tools that shape our daily lives, drive technological progress, and illuminate the mysteries of the cosmos.
As we continue to explore, learn, and discover, let us always remember the profound impact of these equations and the brilliant minds behind them. They remind us that the pursuit of knowledge knows no bounds and that the world of equations is a realm of infinite wonder and possibility.
Let us know in the comments in case we missed any!
Are you interested in learning more about the essential skills for data analysts to succeed in today’s data-driven world?
You are in luck if you have a knack for working with numbers and handling datasets. The good news is that you don’t need to be an engineer, scientist, or programmer to acquire the necessary data analysis skills. Whether you’re located anywhere in the world or belong to any profession, you can still develop the expertise needed to be a skilled data analyst.
Who Are Data Analysts?
Data analysts are professionals who use data to identify patterns, trends, and insights that help organizations make informed decisions. They collect, clean, organize, and analyze data to provide valuable insights to business leaders, enabling them to make data-driven decisions.
The profession of data analysis is gaining momentum for several reasons. First, the amount of data available to organizations has grown exponentially in recent years, creating a need for professionals who can make sense of it. Second, advancements in technology, such as big data and machine learning, have made it easier and more efficient to analyze data. Finally, businesses are realizing the importance of making data-driven decisions to remain competitive in today’s market.
As we move further into the age of data-driven decision-making, the role of the data analyst continues to evolve and expand. In future, data analysts will be expected to have a wide range of skills and knowledge to be effective in their roles.
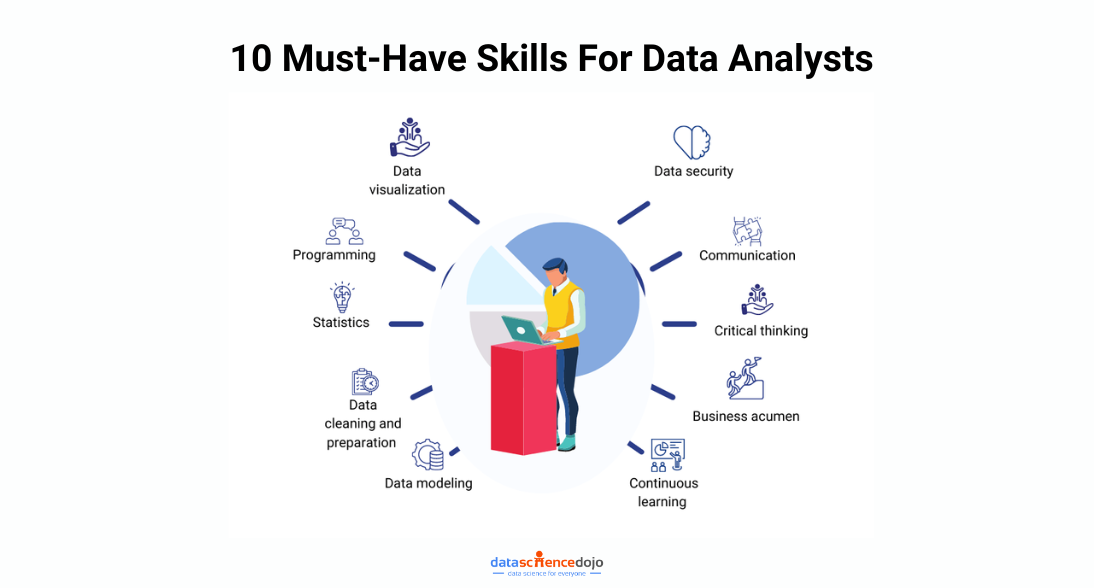
10 Essential Skills for Data Analysts
Here are 10 essential skills for data analysts:
1. Data Visualization:
Topping the list of skills for data analysts data visualization stands first. Data visualization is the process of presenting data in a visual format such as charts, graphs, or maps. Data analysts need to be able to effectively communicate their findings through visual representations of data.
They should be proficient in using tools like Tableau, PowerBI, or Python libraries like Matplotlib and Seaborn to create visually appealing and informative dashboards. Data analysts should also understand design principles such as color theory and visual hierarchy to create effective visualizations. Effective data visualization allows stakeholders to quickly understand complex data and draw actionable insights from it.
2. Programming
Programming is a crucial skill for data analysts. They should be proficient in languages like Python, R or SQL to effectively analyze data and create custom scripts to automate data processing and analysis. Data analysts should be able to manipulate data using programming constructs such as loops, conditional statements, and functions.
They should also be familiar with data structures such as arrays and lists, and be able to use libraries and packages such as NumPy, Pandas, or dplyr to process and manipulate data. In the skills for data analysts list, programming skills are essential since they enable data analysts to create automated workflows that can process large volumes of data quickly and efficiently, freeing up time to focus on higher-value tasks such as data modeling and visualization.
3. Statistics
Possessing the right skills for data analysts is essential for success in this field. A strong foundation in statistics is crucial to applying statistical methods and models to analysis, including concepts like hypothesis testing, regression, and clustering analysis.
In addition, data analysts must have a thorough understanding of probability and statistics to identify patterns in data, eliminate biases and logical errors, and generate accurate results. These abilities are critical to becoming a skilled data analyst and making informed decisions based on data analysis.
4. Data Cleaning and Preparation
Data cleaning and preparation is the process of transforming raw data into a format that is suitable for analysis. This involves identifying and correcting errors, removing duplicates, handling missing values, and restructuring data.
Data analysts should be proficient in using tools like Excel, OpenRefine or Python libraries like Pandas to clean and preprocess data. They should be able to identify patterns and outliers in data and use their knowledge of statistical analysis to handle them appropriately. In addition, they should be able to create automated data-cleaning pipelines to ensure data is clean and consistent for future analysis.
5. Data Modeling
Data modeling is the process of creating a conceptual representation of data and its relationships to support business decisions. This involves creating models that can be used to predict future outcomes based on historical data. Data analysts should have a strong understanding of concepts such as classification, regression, and time-series analysis.
They should be able to choose the appropriate model for a specific problem and evaluate the performance of the model. Data analysts should also have the ability to implement models using tools like Python’s sci-kit-learn library, R’s caret package, or IBM SPSS.
6. Data Security
Data security is the process of protecting data from unauthorized access, use, disclosure, disruption, modification, or destruction. Data analysts should have a strong understanding of data security and privacy to ensure the data they work with is secure and compliant with regulations such as GDPR, CCPA, or HIPAA. They should be able to identify potential security risks and take measures to mitigate them.
This may include using encryption techniques to protect sensitive data, implementing access controls to restrict access to data, and ensuring that data is stored and transmitted securely. Additionally, data analysts should be familiar with legal and ethical issues surrounding data privacy and be able to ensure compliance with relevant laws and regulations.
7. Communication
Data analysts should possess strong communication skills to effectively convey their findings to non-technical stakeholders. It’s not just about analyzing numbers; it’s about translating complex data patterns into meaningful, actionable insights that drive business decisions.
One of the key skills for data analysts is the ability to present data in a clear, concise, and engaging manner, ensuring that decision-makers understand the impact of the findings without needing a technical background.
Additionally, data analysts should be adept at using storytelling techniques, data visualization tools, and business intelligence platforms to make their insights more digestible. Strong communication, combined with domain knowledge, allows analysts to bridge the gap between data and strategy. This is why skills for data analysts should include not only technical expertise but also the ability to simplify intricate data narratives for diverse audiences.
8. Critical Thinking
Critical thinking is one of the most essential skills for data analysts, as it enables them to assess data from multiple angles, identify inconsistencies, and derive meaningful insights.
By combining analytical reasoning with problem-solving abilities, data analysts can make data-driven decisions that impact business strategies. Additionally, honing skills for data analysts, such as statistical analysis and data visualization, allows them to present their findings in a clear and compelling way, ensuring that stakeholders can easily understand and act on the insights provided.
9. Business Acumen
Data analysts should have a strong understanding of the business domain they work in to effectively apply data analysis to real-world business problems and drive data-informed decision-making. Without industry-specific knowledge, even the most advanced analytical techniques may fail to deliver actionable insights.
A key skill for data analysts is the ability to align data findings with business objectives, ensuring that insights are relevant and impactful.
By understanding the nuances of their industry—whether it’s finance, healthcare, marketing, or technology—analysts can identify the most critical metrics, recognize meaningful patterns, and provide recommendations that support strategic goals. Developing domain expertise, alongside technical skills for data analysts, enhances their ability to transform raw data into valuable business intelligence.
10. Continuous Learning
Data analysts should be committed to continuous learning and staying up-to-date with evolving tools, techniques, and technologies. The data landscape is constantly changing, with new software, methodologies, and best practices emerging regularly. To remain competitive, analysts must proactively invest time and effort into expanding their expertise.
One of the essential skills for data analysts is adaptability—being open to learning new programming languages, analytics tools, and machine learning techniques to enhance their capabilities.
Additionally, staying informed about industry trends, attending workshops, and obtaining certifications can help analysts refine their skills for data analysts and stay ahead in the field. A mindset of continuous growth ensures they can provide cutting-edge insights and solutions to business challenges.
Are You Ready To Level Up Your Skillset?
In conclusion, data analysts in coming times will need to have a diverse skill set that includes technical, business, and soft skills. They should be proficient in data visualization, programming, statistics, data modeling, and data cleaning and preparation. In addition, they should have strong communication, critical thinking, and business acumen skills.
Finally, they should be committed to continuous learning and staying up-to-date with new tools and technologies. By developing these skills, data analysts can add value to their organizations and stay competitive in the job market.
Get ahead in data analysis with our summary of the top 7 must-know statistical techniques. Master these tools for better insights and results.
While the field of statistical inference is fascinating, many people have a tough time grasping its subtleties. For example, some may not be aware that there are multiple types of inference and that each is applied in a different situation. Moreover, the applications to which inference can be applied are equally diverse.
For example, when it comes to assessing the credibility of a witness, we need to know how reliable the person is and how likely it is that the person is lying. Similarly, when it comes to making predictions about the future, it is important to factor in not just the accuracy of the forecast but also whether it is credible.
Top statistical techniques – Data Science Dojo
Counterfactual causal inference:
Counterfactual causal inference is a statistical technique that is used to evaluate the causal significance of historical events. Exploring how historical events may have unfolded under small changes in circumstances allows us to assess the importance of factors that may have caused the event. This technique can be used in a wide range of fields such as economics, history, and social sciences. There are multiple ways of doing counterfactual inference, such as Bayesian Structural Modelling.
Overparametrized models and regularization:
Overparametrized models are models that have more parameters than the number of observations. These models are prone to overfitting and are not generalizable to new data. Regularization is a technique that is used to combat overfitting in overparametrized models. Regularization adds a penalty term to the loss function to discourage the model from fitting the noise in the data. Two common types of regularization are L1 and L2 regularization.
Generic computation algorithms:
Generic computation algorithms are a set of algorithms that can be applied to a wide range of problems. These algorithms are often used to solve optimization problems, such as gradient descent and conjugate gradient. They are also used in machine learning, such as support vector machines and k-means clustering.
Robust inference:
Robust inference is a technique that is used to make inferences that are not sensitive to outliers or extreme observations. This technique is often used in cases where the data is contaminated with errors or outliers. There are several robust statistical methods such as the median and the Huber M-estimator.
Bootstrapping and simulation-based inference are techniques that are used to estimate the precision of sample statistics and to evaluate and compare models. Bootstrapping is a resampling technique that is used to estimate the sampling distribution of a statistic by resampling the data with replacement.
Simulation-based inference is a method that is used to estimate the sampling distribution of a statistic by generating many simulated samples from the model.
Multilevel models are a class of models that are used to account for the hierarchical structure of data. These models are often used in fields such as education, sociology, and epidemiology. They are also known as hierarchical linear models, mixed-effects models, or random coefficient models.
Adaptive decision analysis:
Adaptive Decision Analysis is a statistical technique that is used to make decisions under uncertainty. It involves modeling the decision problem, simulating the outcomes of the decision and updating the decision based on the new information. This method is often used in fields such as finance, engineering, and healthcare.
Which statistical techniques are most used by you?
This article discusses most of the statistical methods that are used in quantitative fields. These are often used to infer causal relationships between variables.
The primary goal of any statistical way is to infer causality from observational data. It is usually difficult to achieve this goal for two reasons. First, observational data may be noisy and contaminated by errors. Second, variables are often correlated. To correctly infer causality, it is necessary to model these correlations and to account for any biases and confounding factors.
As statistical techniques are often implemented using specific software packages, the implementations of each method often differ. This article first briefly describes the papers and software packages that are used in the following sections. It then describes the most common statistical techniques and the best practices that are associated with each technique.
In this blog, we will introduce you to the highly rated data science statistics books on Amazon. As you read the blog, you will find 5 books for beginners and 5 books for advanced-level experts. We will discuss what’s covered in each book and how it helps you to scale up your data science career.
Advanced statistics books for data science
1. Naked Statistics: Stripping the Dread from the Data – By Charles Wheelan
The book unfolds the underlying impact of statistics on our everyday life. It walks the readers through the power of data behind the news.
Mr. Wheelan begins the book with the classic Monty Hall problem. It is a famous, seemingly paradoxical problem using Bayes’ theorem in conditional probability. Moving on, the book separates the important ideas from the arcane technical details that can get in the way. The second part of the book interprets the role of descriptive statistics in crafting a meaningful summary of the underlying phenomenon of data.
Wheelan highlights the Gini Index to show how it represents the income distribution of the nation’s residents and is mostly used to measure inequality. The later part of the book clarifies key concepts such as correlation, inference, and regression analysis explaining how data is being manipulated in order to tackle thorny questions.
Wheelan’s concluding chapter is all about the amazing contribution that statistics will continue to make to solving the world’s most pressing problems, rather than a more reflective assessment of its strengths and weaknesses.
2. Bayesian Methods For Hackers – Probabilistic Programming and Bayesian Inference, By Cameron Davidson-Pilon
We mostly learn Bayesian inference through intensely complex mathematical analyses that are also supported by artificial examples. This book comprehends Bayesian inference through probabilistic programming with the powerful PyMC language and the closely related Python tools NumPy, SciPy, and Matplotlib.
Davidson-Pilon focused on improving learners’ understanding of the motivations, applications, and challenges in Bayesian statistics and probabilistic programming. Moreover, this book brings a much-needed introduction to Bayesian methods targeted at practitioners.
Therefore, you can reap the most benefit from this book if you have a prior sound understanding of statistics. Knowing about prior and posterior probabilities will give an added advantage to the reader in building and training the first Bayesian model.
The second part of the book introduces the probabilistic programming library for Python through a series of detailed examples and intuitive explanations, with recent core developments and the popularity of the scientific stack in Python, PyMC is likely to become a core component soon enough.
PyMC does have dependencies to run, namely NumPy and (optionally) SciPy. To not limit the user, the examples in this book will rely only on PyMC, NumPy, SciPy, and Matplotlib. This book is filled with examples, figures, and Python code that make it easy to get started solving actual problems.
3. Practical Statistics for Data Scientists – By Peter Bruce and Andrew Bruce
This book is most beneficial for readers that have some basic understanding of R programming language and statistics.
The authors penned the important concepts to teach practical statistics in data science and covered data structures, datasets, random sampling, regression, descriptive statistics, probability, statistical experiments, and machine learning. The code is available in both Python and R. If an example code is offered with this book, you may use it in your programs and documentation.
The book defines the first step in any data science project that is exploring the data or data exploration. Exploratory data analysis is a comparatively new area of statistics. Classical statistics focused almost exclusively on inference, a sometimes-complex set of procedures for drawing conclusions about large populations based on small samples.
To apply the statistical concepts covered in this book, unstructured raw data must be processed and manipulated into a structured form—as it might emerge from a relational database—or be collected for a study.
4. Advanced Engineering Mathematics by Erwin Kreyszig
Advanced Engineering Mathematics is a textbook for advanced engineering and applied mathematics students. The book deals with the calculus of vectors, tensor and differential equations, partial differential equations, linear elasticity, nonlinear dynamics, chaos theory, and applications in engineering.
Advanced Engineering Mathematics is a textbook that focuses on the practical aspects of mathematics. It is an excellent book for those who are interested in learning about engineering and its role in society.
The book is divided into five sections: Differential Equations, Integral Equations, Differential Mathematics, Calculus, and Probability Theory. It also provides a basic introduction to linear algebra and matrix theory. This book can be used by students who want to study at the graduate level or for those who want to become engineers or scientists.
The text provides a self-contained introduction to advanced mathematical concepts and methods in applied mathematics. It covers topics such as integral calculus, partial differentiation, vector calculus and its applications to physics, Hamiltonian systems and their stability analysis, functional analysis, and classical mechanics and its applications to engineering problems.
The book includes a large number of problems at the end of each chapter that help students develop their understanding of the material covered in the chapter.
5. Computer Age Statistical Inference by Bradley Efron and Trevor Hastie
Computer Age Statistical Inference is a book aimed at data scientists who are looking to learn about the theory behind machine learning and statistical inference. The authors have taken a unique approach in this book, as they have not only introduced many different topics but have also included a few examples of how these ideas can be applied in practice.
The book starts off with an introduction to statistical inference and then progresses through chapters on linear regression models, logistic regression models, statistical model selection, and variable selection. There are several appendices that provide additional information on topics such as confidence intervals and variable importance. This book is great for anyone looking for an introduction to machine learning or statistics.
Computer Age Statistical Inference is a book that introduces students to the field of statistical inference in a modern computational setting. It covers topics such as Bayesian inference and nonparametric methods, which are essential for data science. In particular, this book focuses on Bayesian classification methods and their application to real-world problems.
It discusses how to develop models for continuous and discrete data, how to evaluate model performance, how to choose between parametric and nonparametric methods, how to incorporate prior distributions into your model, and much more.
5 Beginner level statistics books for data science
6. How to Lie with Statistics by Darrell Huff
How to Lie with Statistics is one of the most influential books about statistical inference. It was first published in 1954 and has been translated into many languages. The book describes how to use statistics to make your most important decisions, like whether to buy a house, how much money to give to charity, and what kind of mortgage you should take out.
The book is intended for laymen, as it includes illustrations and some mathematical formulas. It’s full of interesting insights into how people can manipulate data to support their own agendas.
The book is still relevant today because it describes how people use statistics in their daily lives. It gives an understanding of the types of questions that are asked and how they are answered by statistical methods. The book also explains why some results seem more reliable than others.
The first half of the book discusses methods of making statistical claims (including how to make improper ones) and illustrates these using examples from real life. The second half provides a detailed explanation of the mathematics behind probability theory and statistics.
A common criticism of the book is that it focuses too much on what statisticians do rather than why they do it. This is true — but that’s part of its appeal!
7. Head-first Statistics: A Brain-Friendly Guide Book by Dawn Griffiths
If you are looking for a book that will help you understand the basics of statistics, then this is the perfect book for you. In this book, you will learn how to use data and make informed decisions based on your findings. You will also learn how to analyze data and draw conclusions from it.
This book is ideal for those who have already completed a course in statistics or have studied it in college. Griffiths has given an overview of the different types of statistical tests used in everyday life and provides examples of how to use them effectively.
The book starts off with an explanation of statistics, which includes topics such as sampling, probability, population and sample size, normal distribution and variation, confidence intervals, tests of hypotheses and correlation.
After this section, the book goes into more advanced topics such as regression analysis, hypothesis testing etc. There are also some chapters on data mining techniques like clustering and classification etc.
The author has explained each topic in detail for the readers who have little knowledge about statistics so they can follow along easily. The language used throughout this book is very clear and simple which makes it easy to understand even for beginners.
8. Think Stats By Allen B. Downey
Think Stats is a great book for students who want to learn more about statistics. The author, Allen Downey, uses simple examples and diagrams to explain the concepts behind each topic. This book is especially helpful for those who are new to mathematics or statistics because it is written in an easy-to-understand manner that even those with a high school degree can understand.
The book begins with an introduction to basic counting, addition, subtraction, multiplication, and division. It then moves on to finding averages and making predictions about what will happen if one number changes. It also covers topics like randomness, sampling techniques, sampling distributions, and probability theory.
The author uses real-world examples throughout the book so that readers can see how these concepts apply to their own lives. He also includes exercises at the end of each chapter so that readers can practice what they’ve learned before moving on to the next section of the book.
This makes Think Stats an excellent resource for anyone looking for tips on improving their math skills or just wanting to brush up on some statistical basics!
9. An Introduction To Statistical Learning With Applications In R By Gareth James, Daniela Witten, Trevor Hastie, and Robert Tibshirani
Statistical learning with applications in R is a guide to advanced statistical learning. It introduces modern machine learning techniques and their applications, including sequential decision-making, Gaussian mixture models, boosting, and genetic programming.
The book covers methods for supervised and unsupervised learning, as well as neural networks. The book also includes chapters on Bayesian statistics and deep learning.
It begins with a discussion of correlation and regression analysis, followed by Bayesian inference using Markov chain Monte Carlo methods. The authors then discuss regularization techniques for regression models and introduce boosting algorithms.
This section concludes with an overview of neural networks and convolutional neural networks (CNNs). The remainder of the book deals with topics such as kernel methods, support vector machines (SVMs), regression trees (RTs), naive Bayes classifiers, Gaussian processes (GP), gradient ascent methods, and more.
This statistics book is recommended to researchers willing to learn about statistical machine learning but do not have the necessary expertise in mathematics or programming languages
10. Statistics in Plain English By Timothy C. Urdan
Statistics in Plain English is a writing guide for students of statistics. Timothy in his book covered basic concepts with examples and guidance for using statistical techniques in the real world. The book includes a glossary of terms, exercises (with solutions), and web resources.
The book begins by explaining the difference between descriptive statistics and inferential statistics, which are used to draw conclusions about data. It then covers basic vocabulary such as mean, median, mode, standard deviation, and range.In Chapter 2, the author explains how to calculate sample sizes that are large enough to make accurate estimates.
In Chapters 3–5 he gives examples of how to use various kinds of data: census data on population density; survey data on attitudes toward various products; weather reports on temperature fluctuations; and sports scores from games played by teams over time periods ranging from minutes to seasons. He also shows how to use these data to estimate the parameters for models that explain behavior in these situations.
The last 3 chapters define the use of frequency distributions to answer questions about probability distributions such as whether there’s a significant difference between two possible outcomes or whether there’s a trend in a set of numbers over time or space
Which data science statistics books are you planning to get?
Build upon your statistical concepts and successfully step into the world of data science. Analyze your knowledge and choose the most suitable book for your career to enhance your data science skills. If you have any more suggestions for statistics books for data science, please share them with us in the comments below.
A regular expression is a sequence of characters that specifies a search pattern in a text. Learn more about Its common uses in this regex 101 guide.
What is a Regular Expression?
A regular expression, or regex for short, is perhaps the most common thing that every data scientist must deal with multiple times in their career, and the frustration is natural because, at a vast majority of universities, this skill is not taught unless you have taken some hard-core Computer Science theory course.
Even at times, trying to solve a problem using regular expression can cause multiple issues, which is summed beautifully in this meme:
Regular Expressions Meme
Making sense and using them can be quite daunting for beginners, but this RegEx 101 blog has got you covered. Regular expressions, in essence, are used to match strings in the text that we want to find. Consider the following scenario:
You are interested in counting the number of occurrences of Pandas in a journal related to endangered species to see how much focus is on this species. You write an algorithm that calculates the occurrences of the word ‘panda.’
However, as you might have noticed, your algorithm will miss the words ‘Panda’ and ‘Pandas.’ In this case, you might argue that a simple if-else condition will also count these words. But imagine, while converting the journal alphabets of every word is randomly capitalized or converted into a lower-case letter. Now, there are the following possibilities
PaNda
pAnDaS
PaNdA
And may more variations as well. Now you must write a lot of if-else conditions and even must write nested if-else conditions as well. What if I tell you that you can do this in one line of code using regular expressions? First, we need to learn some basics before coming back to solve the problem ourselves.
PRO TIP: Join our data science bootcamp today to enhance your data science knowledge!
Square Brackets ([])
The name might sound scary, but it is nothing but the symbol: []. Some people also refer to square brackets as character class – a regular expression jargon word that means that it will match any character inside the bracket. For instance:
Pattern
Matches
[Pp]enguin
Penguin, penguin
[0123456789]
(This will match any digit)
[0oO]
0, o, O
Disjunction (|)
The pipe symbol means nothing but either ‘A’ or ‘B’, and it is helpful in cases where you want to select multiple strings simultaneously. For instance:
Pattern
Matches
A|B|C
A, B, C
Black|White
Black, White
[Bb]lack|[Ww]hite
Black, black, White, white
Question Mark (?)
The question mark symbol means that the character it comes after is optional. For instance:
Pattern
Matches
Ab?c
Ac, Abc
Colou?r
Color, Colour
Asterisk (*)
The asterisk symbol matches with 0 or more occurrences of the earlier character or group. For instance:
Pattern
Matches
Sh*
(0 or more of earlier character h)
S, Sh, Shh, Shhh.
(banana)*
(0 or more of earlier banana. This will also match with nothing, but most regex engines will ignore it or give you a warning in that case)
banana, bananabanana, bananabananabanana.
Plus (+)
The plus symbol means to match with one or more occurrences of the earlier character or group. For instance:
Pattern
Matches
Sh+
(1 or more of earlier character h)
Sh, Shh, Shhh.
(banana)+
(1 or more of the earlier banana)
banana, bananabanana, bananabananabanana.
Difference between Asterisk (*) and Plus(+)
The difference between the asterisk confuses many people; even the experts sometimes must look at the internet for their differences. However, there is an effortless way to remember the distinction between them.
Imagine you have a number 1, and you multiply it with 0:
1*0 = 0 or more occurrences of earlier character or group.
Now suppose that you have the same number 1, and you add it with 0:1+0 = 1 or more occurrences of an earlier character or group.
It is that simple when you try to understand things intuitively.
Negation (^)
Negation has two everyday use cases:
1. Inside square brackets, it will search for the negation of whatever is inside the brackets. For instance:
Pattern
Matches
[^Aa]
It will match with anything that is not A or a
[^0123456789]
It will match anything that is not a digit
2. It can also be used as an anchor to search for expressions at the start of the line(s) only. For instance:
Pattern
Matches
^Apple
It will match with every Apple that is at the start of any line in the text
^(Apple|Banana)
It will match with every Apple and Banana that is at the start of any line in the text
Dollar ($)
A dollar is used to search for expressions at the end of the line. For instance:
Pattern
Matches
$[0123456789]
It will match with any digit at the end of any line in the text.
$([Pp]anda)
It will match with every Panda and panda at the end of any line in the text.
Conclusion
This article covered some of the very basic types of regular expression by using a story-telling approach. Regular expressions are indeed very hard to understand but if one develops an intuitive understanding then they can be easily learned.