The Monte Carlo method is a technique for solving complex problems using probability and random numbers. Through repeated random sampling, Monte Carlo calculates the probabilities of multiple possible outcomes occurring in an uncertain process.
Whenever you try to solve problems in the future, you make certain assumptions. For example, forecasting problems make certain assumptions like the cost of a particular item, the value of stocks, or electricity units used in the future. Since these problems try to predict an estimate of an unknown value based on historical data, there always exists inherent risk and uncertainty.
The Monte Carlo simulation allows us to see all the possible outcomes of our decisions and assess risk, consequently allowing for better decision-making under uncertainty.
This blog will walk through the famous Monty Hall problem, and how it can be solved using the Monte Carlo method using Python.
Monty Hall problem
In the Monty Hall problem, the TV show host Monty presents three doors to the participant. Behind one of the doors is a valuable prize like a car, while behind the others is a less valuable prize like a goat.
Consider yourself to be one of the participants in the show. You choose one out of the three doors. Before opening your chosen door, Monty opens another door behind which would be one of the goats. Now you are left with two doors, behind one could be the car, and behind the other would be the other goat.
Monty then gives you the option to either switch your answer to the other unopened door or stick to the original one.
Is it in your favor to switch your answer to the other door? Well, probability says it is!
Let’s see how:
Initially, there are three unopen doors in front of you. The probability of the car being behind any of these doors is 1/3.
Let’s say you decide to pick door #1 as the probability is the same (1/3) for each of these doors. In other words, the probability that the car is behind door #1 is 1/3, and the probability that it will be behind either door #2 or door #3 is 2/3.
Monty is aware of the prize behind each door. He chooses to open door #3 and reveal a goat. He then asks you if you would like to either switch to door #2 or stick with door #1.
To solve the problem, let’s switch to Python and apply the Monte Carlo simulation.
Solving with Python
Initialize the 3 prizes
Create python lists to store the probabilities after each game. We will play as many games as iterations input.
Monte Carlo simulation
Before starting the game, we randomize the prizes behind each door. One of the doors will have a car behind it, while the other two will have a goat each. When we play a large number of games, all possible permutations get covered of prize distributions, and door choices get covered.
Below is the code that decides if your choice was correct or not, and if switching would’ve been the correct move.
After playing each game, the winning probabilities are updated and stored in the lists. When all games have been played, we return the final values of each of the lists, i.e., winning by switching your choice and winning by sticking to your choice.
Get results
Enter your desired number of iterations (the higher the number, the more numbers of games will be played to approximate the probabilities). In the final step, plot your results.
After running the simulation 1000 times, the probability that we win by always switching is 67.7%, and the probability that we win by always sticking to our choice is 32.3%. In other words, you will win approximately 2/3 times if you switch your door, and only 1/3 times if you stick to the original door.
Therefore, according to the Monte Carlo simulation, we are confident that it works to our advantage to switch the door in this tricky game.
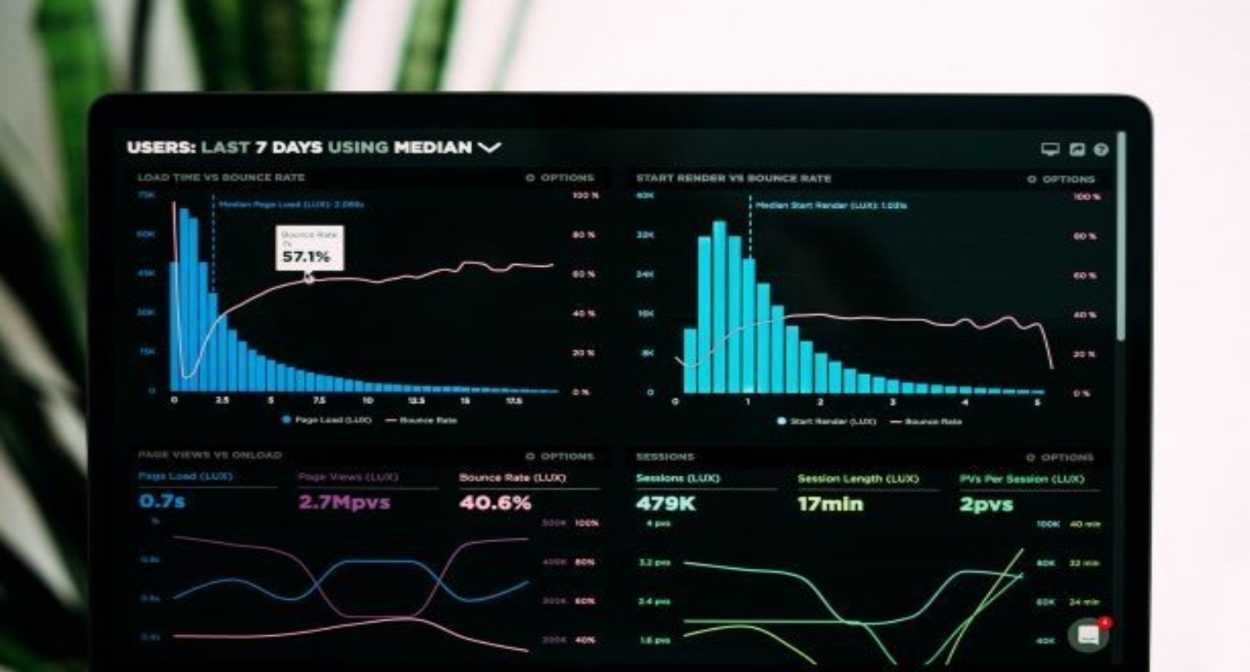
Graphs play a very important role in the data science workflow. Learn how to create dynamic professional-looking plots with Plotly.py.
We use plots to understand the distribution and nature of variables in the data and use visualizations to describe our findings in reports or presentations to both colleagues and clients. The importance of plotting in a data scientist’s work cannot be overstated.
If you have worked on any kind of data analysis problem in Python you will probably have encountered matplotlib, the default (sort of) plotting library. I personally have a love-hate relationship with it — the simplest plots require quite a bit of extra code but the library does offer flexibility once you get used to its quirks. The library is also used by pandas for its built-in plotting feature. So even if you haven’t heard of matplotlib, if you’ve used df.plot(), then you’ve unknowingly used matplotlib.
Plotting with Seaborn
Another popular library is seaborn, which is essentially a high-level wrapper around matplotlib and provides functions for some custom visualizations, these require quite a bit of code to create in the standard matplotlib. Another nice feature seaborn provides is sensible defaults for most options like axis labels, color schemes, and sizes of shapes.
Introducing Plotly
Plotly might sound like the new kid on the block, but in reality, it’s nothing like that. Plotly originally provided functionality in the form of a JavaScript library built on top of D3.js and later branched out into frontends for other languages like R, MATLAB and, of course, Python. plotly.py is the Python interface to the library.
As for usability, in my experience Plotly falls in between matplotlib and seaborn. It provides a lot of the same high-level plots as seaborn but also has extra options right there for you to tweak, such as matplotlib. It also has generally much better defaults than matplotlib.
Plotly’s interactivity
The most fascinating feature of Plotly is the interactivity. Plotly is fundamentally different from both matplotlib and seaborn because plots are rendered as static images by both of them while Plotly uses the full power of JavaScript to provide interactive controls like zooming in and panning out of the visual panel. This functionality can also be extended to create powerful dashboards and responsive visualizations that could convey so much more information than a static picture ever could.
First, let’s see how the three libraries differ in their output and complexity of code. I’ll use common statistical plots as examples.
To have a relatively even playing field, I’ll use the built-in seaborn theme that matplotlib comes with so that we don’t have to deduct points because of the plot’s looks.
fig = go.FigureWidget()

for species, species_df in iris.groupby('species'):
    fig.add_scatter(x=species_df['sepal_length'], y=species_df['sepal_width'],
                    mode='markers', name=species);

fig.layout.hovermode = 'closest'
fig.layout.xaxis.title = 'Sepal Length'
fig.layout.yaxis.title = 'Sepal Width'
fig.layout.title = 'A Wild Scatterplot appears'
fig
Looking at the plots, the matplotlib and seaborn plots are basically identical, the only difference is in the amount of code. The seaborn library has a nice interface to generate a colored scatter plot based on the hue argument, but in matplotlib we are basically creating three scatter plots on the same axis. The different colors are automatically assigned in both (default color cycle but can also be specified for customization). Other relatively minor differences are in the labels and legend, where seaborn creates these automatically. This, in my experience, is less useful than it seems because very rarely do datasets have nicely formatted column names. Usually they contain abbreviations or symbols so you still have to assign ‘proper’ labels.
But we really want to see what Plotly has done, don’t we? This time I’ll start with the code. It’s eerily similar to matplotlib, apart from not sharing the exact syntax of course and the hovermode option. Hovering? Does that mean…? Yes, yes it does. Moving the cursor over a point reveals a tooltip showing the coordinates of the point and the class label. The tooltip can also be customized to show other information about the particular point. To the top right of the panel, there are controls to zoom, select and pan across the plot. The legend is also interactive, it acts sort of like checkboxes. You can click on a class to hide/show all the points of that class.
Since the amount or complexity of code isn’t that drastically different from the other two options and we get all these interactivity options, I’d argue this is basically free benefits.
The bar chart story is similar to the scatter plots. In this case, again, seaborn provides the option within the function call to specify the metric to be shown on the y axis using the x variable as the grouping variable. For the other two, we have to do this ourselves using pandas. Plotly still provides interactivity out of the box.
Now that we’ve seen that Plotly can hold its own against our usual plotting options, let’s see what other benefits it can bring to the table. I will showcase some trace types in Plotly that are useful in a data science workflow, and how interactivity can make them more informative.
Heatmaps are commonly used to plot correlation or confusion matrices. As expected, we can hover over the squares to get more information about the variables. I’ll paint a picture for you. Suppose you have trained a linear regression model to predict something from this dataset. You can then show the appropriate coefficients in the hover tooltips to get a better idea of which correlations in the data the model has captured.
Parallel coordinates plot
fig = go.FigureWidget()

parcords = fig.add_parcoords(dimensions=[{'label':n.title(),
                                          'values':iris[n],
                                          'range':[0,8]} for n in iris.columns[:-2]])

fig.data[0].dimensions[0].constraintrange = [4,8]
parcords.line.color = iris['species_id']
parcords.line.colorscale = make_plotly(cl.scales['3']['qual']['Set2'], repeat=True)

parcords.line.colorbar.title = ''
parcords.line.colorbar.tickvals = np.unique(iris['species_id']).tolist()
parcords.line.colorbar.ticktext = np.unique(iris['species']).tolist()
fig.layout.title = 'A Wild Parallel Coordinates Plot appears'
fig
I suspect some of you might not yet be familiar with this visualization, as I wasn’t a few months ago. This is a parallel coordinates plot of four variables. Each variable is shown on a separate vertical axis. Each line corresponds to a row in the dataset and the color obviously shows which class that row belongs to. A thing that should jump out at you is that the class separation in each variable axis is clearly visible. For instance, the Petal_Length variable can be used to classify all the Setosa flowers very well.
Since the plot is interactive, the axes can be reordered by dragging to explore interconnectedness between the classes and how it affects the class separations. Another interesting interaction is the constrained range widget (the bright pink object on the Sepal_Length axis). It can be dragged up or down to decolor the plot. Imagine having these on all axes and finding a sweet spot where only one class is visible. As a side note, the decolored plot has a transparency effect on the lines so the density of values can be seen.
A version of this type of visualization also exists for categorical variables in Plotly. It is called Parallel Categories.
Choropleth plot
fig = go.FigureWidget()

choro = fig.add_choropleth(locations=gdp['CODE'],
                           z=gdp['GDP (BILLIONS)'],
                           text = gdp['COUNTRY'])

choro.marker.line.width = 0.1
choro.colorbar.tickprefix = '$'
choro.colorbar.title = 'GDP<br>Billions US$'
fig.layout.geo.showframe = False
fig.layout.geo.showcoastlines = False
fig.layout.title = 'A Wild Choropleth appears<br>Source:\
                    <a href="https://www.cia.gov/library/publications/the-world-factbook/fields/2195.html">\
                    CIA World Factbook</a>'
fig
A choropleth is a very commonly used geographical plot. The benefit of the interactivity should be clear in this one. We can only show a single variable using the color but the tooltip can be used for extra information. Zooming in is also very useful in this case, allowing us to look at the smaller countries. The plot title contains HTML which is being rendered properly. This can be used to create fancier labels.
I’m using the scattergl trace type here. This is a version of the scatter plot which uses WebGL in the background so that the interactions don’t get laggy even with larger datasets.
There is quite a bit of over-plotting here even with the aggressive transparency, so let’s zoom into the densest part to take a closer look. Zooming in reveals that the carat variable is quantized and there are clean vertical lines.
Selecting a bunch of points in this scatter plot will change the title of the plot to show the mean price of the selected points. This could prove to be very useful in a plot where there are groups and you want to visually see some statistics of a cluster.
This behavior is easily implemented using callback functions attached to predefined event handlers for each trace.
More interactivity
Let’s do something fancier now.
fig1 = go.FigureWidget()
fig1.add_scattergl(x=exports['beef'], y=exports['total exports'],
                   text=exports['state'],
                   mode='markers');
fig1.layout.hovermode = 'closest'
fig1.layout.xaxis.title = 'Beef Exports in Million US$'
fig1.layout.yaxis.title = 'Total Exports in Million US$'
fig1.layout.title = 'A Wild Scatterplot appears'

fig2 = go.FigureWidget()
fig2.add_choropleth(locations=exports['code'],
                    z=exports['total exports'].astype('float64'),
                    text=exports['state'],
                    locationmode='USA-states')
fig2.data[0].marker.line.width = 0.1
fig2.data[0].marker.line.color = 'white'
fig2.data[0].marker.line.width = 2
fig2.data[0].colorbar.title = 'Exports Millions USD'
fig2.layout.geo.showframe = False
fig2.layout.geo.scope = 'usa'
fig2.layout.geo.showcoastlines = False
fig2.layout.title = 'A Wild Choropleth appears'

def do_selection(trace, points, selector):
    if trace is fig2.data[0]:
        fig1.data[0].selectedpoints = points.point_inds
    else:
        fig2.data[0].selectedpoints = points.point_inds
fig1.data[0].on_selection(do_selection)
fig2.data[0].on_selection(do_selection)

HBox([fig1, fig2])
We have already seen how to make scatter and choropleth plots so let’s put them to use and plot the same data-frame. Then, using the event handlers we also saw before, we can link both plots together and interactively explore which states produce which kinds of goods.
This kind of interactive exploration of different slices of the dataset is far more intuitive and natural than transforming the data in pandas and then plotting it again.
Using the ipywidgets module’s interactive controls different aspects of the plot can be changed to gain a better understanding of the data. Here the bin size of the histogram is being controlled.
The opacity of the markers in this scatter plot is controlled by the slider. These examples only control the visual or layout aspects of the plot. We can also change the actual data which is being shown using dropdowns. I’ll leave you to explore that on your own.
What have we learned about Python plots
Let’s take a step back and sum up what we have learned. We saw that Plotly can reveal more information about our data using interactive controls, which we get for free and with no extra code. We saw a few interesting, slightly more complex visualizations available to us. We then combined the plots with custom widgets to create custom interactive workflows.
All this is just scratching the surface of what Plotly is capable of. There are many more trace types, an animations framework, and integration with Dash to create professional dashboards and probably a few other things that I don’t even know of.
Data Science Dojo has launched Jupyter Hub for Data Visualization using Python offering to the Azure Marketplace with pre-installed data visualization libraries and pre-cloned GitHub repositories of famous books, courses, and workshops which enable the learner to run the example codes provided.
What is data visualization?
It is a technique that is utilized in all areas of science and research. We need a mechanism to visualize the data so we can analyze it because the business sector now collects so much information through data analysis. By providing it with a visual context through maps or graphs, it helps us understand what the information means. As a result, it is simpler to see trends, patterns, and outliers within huge data sets because the data is easier for the human mind to understand and pull insights from the data.
Data visualization using Python
It may assist by conveying data in the most effective manner, regardless of the industry or profession you have chosen. It is one of the crucial processes in the business intelligence process, takes the raw data, models it, and then presents the data so that conclusions may be drawn. Data scientists are developing machine learning algorithms in advanced analytics to better combine crucial data into representations that are simpler to comprehend and interpret.
Given its simplicity and ease of use, Python has grown to be one of the most popular languages in the field of data science over the years. Python has several excellent visualization packages with a wide range of functionality for you whether you want to make interactive or fully customized plots.
PRO TIP: Join our 5-day instructor-led Python for Data Science training to enhance your visualization skills.
Using Python to visualize Data
Challenges for individuals
Individuals who want to visualize their data and want to start visualizing data using some programming language usually lack the resources to gain hands-on experience with it. A beginner in visualization with programming language also faces compatibility issues while installing libraries.
What we provide
Our Offer, Jupyter Hub for Visualization using Python solves all the challenges by providing you with an effortless coding environment in the cloud with pre-installed Data Visualization python libraries which reduces the burden of installation and maintenance of tasks hence solving the compatibility issues for an individual.
Additionally, our offer gives the user access to repositories of well-known books, courses, and workshops on data visualization that include useful notebooks which is a helpful resource for the users to get practical experience with data visualization using Python. The heavy computations required for applications to visualize data are not performed on the user’s local machine. Instead, they are performed in the Azure cloud, which increases responsiveness and processing speed.
Listed below are the pre-installed data visualization using python libraries and the sources of repositories of a book to visualize data, a course, and a workshop provided by this offer:
Python libraries:
NumPy
Matplotlib
Pandas
Seaborn
Plotly
Bokeh
Plotnine
Pygal
Ggplot
Missingno
Leather
Holoviews
Chartify
Cufflinks
Repositories:
GitHub repository of the book Interactive Data Visualization with Python, by author Sharath Chandra Guntuku, AbhaBelorkar, Shubhangi Hora, Anshu Kumar.
GitHub repository of Data Visualization Recipes in Python, by Theodore Petrou.
GitHub repository of Python data visualization workshop, by Stefanie Molin (Author of “Hands-On Data Analysis with Pandas”).
GitHub repository Data Visualization using Matplotlib, by Udacity.
Conclusion:
Because the human brain is not designed to process such a large amount of unstructured, raw data and turn it into something usable and understandable form, we require techniques to visualize data. We need graphs and charts to communicate data findings so that we can identify patterns and trends to gain insight and make better decisions faster. Jupyter Hub for Data Visualization using Python provides an in-browser coding environment with just a single click, hence providing ease of installation. Through our offer, a user can explore various application domains of data visualizations without worrying about the configuration and computations.
At Data Science Dojo, we deliver data science education, consulting, and technical services to increase the power of data. We are therefore adding a free Jupyter Notebook Environment dedicated specifically for Data Visualization using Python. The offering leverages the power of Microsoft Azure services to run effortlessly with outstanding responsiveness. Make your complex data understandable and insightful with us and Install the Jupyter Hub offer now from the Azure Marketplace by Data Science Dojo, your ideal companion in your journey to learn data science!
Use Python and BeautifulSoup to web scrape. Web scraping is a very powerful tool to learn for any data professional. Make the entire internet your database.
Web scraping tutorial using Python and BeautifulSoup
With web scraping, the entire internet becomes your database. In this tutorial, we show you how to parse a web page into a data file (csv) using a Python package called BeautifulSoup.
There are many services out there that augment their business data or even build out their entire business by using web scraping. For example there is a steam sales website that tracks and ranks steam sales, updated hourly. Companies can also scrape product reviews from places like Amazon to stay up-to-date with what customers are saying about their products.
The code
from bs4 import BeautifulSoup as soup  # HTML data structure
from urllib.request import urlopen as uReq  # Web client
#URl to web scrap from.
#in this example we web scrap graphics cards from Newegg.com
page_url = "http://www.newegg.com/Product/ProductList.aspx?Submit=ENE&N=-1&IsNodeId=1&Description=GTX&bop=And&Page=1&PageSize=36&order=BESTMATCH"
#opens the connection and downloads html page from url
uClient = uReq(page_url)
#parses html into a soup data structure to traverse html
#as if it were a json data type.
page_soup = soup(uClient.read(), "html.parser")
uClient.close()
#finds each product from the store page
containers = page_soup.findAll("div", {"class": "item-container"})
#name the output file to write to local disk
out_filename = "graphics_cards.csv"
#header of csv file to be written
headers = "brand,product_name,shippingn"
#opens file, and writes headers
f = open(out_filename, "w")
f.write(headers)
#loops over each product and grabs attributes about
#each product
for container in containers:
# Finds all link tags "a" from within the first div.
make_rating_sp = container.div.select("a")
# Grabs the title from the image title attribute
# Then does proper casing using .title()
brand = make_rating_sp[0].img["title"].title()
# Grabs the text within the second "(a)" tag from within
# the list of queries.
product_name = container.div.select("a")[2].text
# Grabs the product shipping information by searching
# all lists with the class "price-ship".
# Then cleans the text of white space with strip()
# Cleans the strip of "Shipping $" if it exists to just get number
shipping = container.findAll("li", {"class": "price-ship"})[0].text.strip().replace("$", "").replace(" Shipping", "")
# prints the dataset to console
print("brand: " + brand + "n")
print("product_name: " + product_name + "n")
print("shipping: " + shipping + "n")
# writes the dataset to file
f.write(brand + ", " + product_name.replace(",", "|") + ", " + shipping + "n")
f.close()  # Close the file
The video (enjoy!)
For more info, there’s a script that does the same thing in R
Want to learn more data science techniques in Python? Take a look at this introduction to Python for Data Science
Data Science Dojo has launched Jupyter Hub for Machine Learning using Python offering to the Azure Marketplace with pre-installed machine learning libraries and pre-cloned GitHub repositories of famous machine learning books which help the learner to take the first steps into the field of machine learning.
What is machine learning?
Machine learning is a sub-field of Artificial Intelligence. It is an innovative technology that allows machines to learn from historical data and provide the best results to predict outcomes.
Machine learning using Python
Machine learning requires exploratory data analysis, data processing, and the training of data to predict outcomes. Python provides a vast number of libraries and frameworks that let the user collect, analyze and transform data by just using built-in functions provided by the library which makes coding easy and also saves a significant amount of time.
Machine learning using Python
PRO TIP: Join our 5-day instructor-led Python for Data Science training to enhance your machine learning skills.
Challenges for individuals
Individuals who are new to machine learning and want to excel in their path in machine learning usually lack computing as well as learning resources to gain hands-on experience with machine learning. A beginner in machine learning also faces compatibility issues while installing libraries.
What we provide
With just a single click, Jupyter Hub for Machine Learning using Python comes with pre-installed machine learning python libraries, which gives the learner an effortless coding environment in the Azure cloud and reduces the burden of installation. Moreover, this offer provides the learner with repositories of famous books on machine learning which contain chapter-wise notebooks which serve as a learning resource for a user in gaining hands-on experience with machine learning. The heavy computations required for Machine Learning applications are not performed on the user’s local machine. Instead, they are performed in the Azure cloud, which increases responsiveness and processing speed.
Listed below are the pre-installed machine learning python libraries and the sources of repositories of machine learning books provided by this offer:
Python libraries
Pandas
NumPy
scikit-learn
mlpack
matplotlib
SciPy
Theano
Pycaret
Orange3
seaborn
Repositories
Github repository of book ‘Python Machine Learning Book 1st Edition’, by author Sebastian Raschka.
Github repository of book ‘Python Machine Learning Book 2nd Edition’, by author Sebastian Raschka.
Github repository of the book ‘Hands-on Machine Learning with Scikit Learn, Keras, and TensorFlow’, by author Geron-Aurelien.
Jupyter Hub for Machine Learning using Python provides an in-browser coding environment with just a single click, hence providing ease of installation. Through this offer, a user can work on a variety of machine learning applications including stock market trading, email spam and malware filtering, product recommendations, online customer support, medical diagnosis, online fraud detection, and image recognition.
Jupyter Hub for Machine Learning using Python offered by Data Science Dojo is ideal to learn more about machine learning without the need to worry about configurations and computing resources. The heavy resource requirement for processing and training large data for these applications is no longer an issue as data-intensive computations are now performed on Microsoft Azure which increases processing speed.
At Data Science Dojo, we deliver data science education, consulting, and technical services to increase the power of data. We are therefore adding a free Jupyter Notebook Environment dedicated specifically for Machine Learning using Python. The offering leverages the power of Microsoft Azure services to run effortlessly with outstanding responsiveness. Install the Jupyter Hub offer now from the Azure Marketplace by Data Science Dojo, your ideal companion in your journey to learn data science!
Learning data analytics is a challenge for beginners. Take your learning experience of data analytics one step ahead with these twelve data analytics books. Explore a range of topics, from big data to artificial intelligence.
Books on Data Analytics
Data Analytics Books
1. Data Science for Business: What You Need to Know about Data Mining and Data-Analytic Thinking by Foster Provost and Tom Fawcett
This book is written by two globally esteemed data science experts who introduce their readers to the fundamental principles of data scienceand then dig deep into the important role data plays in business-related decision-making. They do a great job of demonstrating different techniques and ideas related to analytical thinking without getting into too many technicalities.
Through this book, you can not only begin to appreciate the importance of communication between business strategists and data scientists but can also discover how to approach business problems analytically to generate value.
2. The Data Science Design Manual (Texts in Computer Science) eBook: S. Skiena, Steven: Books
To survive in a data-driven world, we need to adopt the skills necessary to analyze datasets acquired. Data Science is critical to statistics, data visualization, machine learning, and mathematical modeling, Steven in this book give an overview of data science introduction for beginners in this emerging discipline.
The second part of the book highlights the essential skills, knowledge, and principles required to collect, analyze and interpret data. This book leaves learners spellbound with its step-by-step guidance to develop an inside-out theoretical and practical understanding of data science.
The Data Science Design Manual is a thorough instructor guide for learners eager to kick off their learning journey in Data Science. Lastly, Steven added the application of data science in the world, a wide range of exercises, Kaggle challenges, and most interestingly the examples from a data science show, The Quant Shop to excite the learners.
3. Data Analytics Made Accessible by Anil Maheshwari
Are you a data enthusiast looking to finally dip your toes in the field? Start with Data Analytics Made Accessible by Anil Maheshwari. Get a sense of what data analytics is all about and how significant a role it plays in real-world scenarios with this informative, easy-to-follow read.
In fact, this book is considered such a vital resource that numerous universities across the globe have added it to their required textbooks list for their analytics courses. It sheds light on the relationship between business and data by talking at length about business intelligence, data mining, and data warehousing.
4. Python for Data Analysis by Wes McKinney
Written by the main author of the Pandas library, Python for Data Analysis is a book that spells out the basics of manipulating, processing, cleaning, and crunching data in Python. It is a hands-on book that walks its readers through a broad set of real-world case studies and enables them to solve different types of data analysis problems.
It introduces different data science tools in Python to the readers in order to get them started on loading, cleaning, transforming, merging, and reshaping data. It also walks you through creating informative visualizations using Matplotlib.
5. Big Data: A Revolution That Will Transform How We Live, Work, and Think by Viktor Mayer-Schönberger and Kenneth Cukier
This book is tailor-made for those who want to know the significance of data analytics across different industries. In this work, these two renowned domain experts bring the buzzword ‘big data’ under the limelight and try to dissect how it’s impacting our world and changing our lives, for better or for worse.
It does not delve into the technical aspects of data science algorithms or applications, rather it’s more of a theoretical primer on what big data really is and how it’s becoming central to different walks of life. Apart from encouraging the readers to embrace this ground-breaking technological development, it also reminds them of the potential digital hazards it poses and how we can protect ourselves from them.
6. Business Unintelligence: Insight and Innovation beyond Analytics and Big Data by Barry Devlin
This book is great for someone who is looking to read through the past, present, and future of business intelligence. Highlighting the great successes and overlooked weaknesses of traditional business intelligence processes, Dr. Devlin delves into how analytics and big data have transformed the landscape of modern-day business intelligence.
It identifies the tried-and-tested business intelligence practices and provides insights into how the trinity of information, people, and process conjoin to generate competitive advantage and drive business success in this rapidly advancing world. Furthermore, in this book, Dr. Delvin recommends several new models and frameworks that businesses and companies can employ for an even better tomorrow.
7. Storytelling with Data: A Data Visualization Guide for Business Professionals by Cole Nussbaumer Knaflic
Globally, the culture is visual. Everything we consume from art, and advertisements to TV is visual. Data visualization is the art of narrating stories with a purpose. In this book, Knaflic highlights key points to effectively tell a story backed by data. The book journeys through the importance of situating your data story within a context, guides on the most suitable charts, graphs, and maps to spot trends and outliers, and discusses how to declutter and retain focus on the key points.
This book is a valuable addition for anyone eager to grasp the basic concepts of data communication. Once you finish reading the book, you will gain a general understanding of several graphs that add a spark to the stories you create from data. Knaflic instills in you the knowledge to tell a story with an impact.
Learn about lead generation through data analytics in this blog
8. Developing Analytic Talent: Becoming a Data Scientist by Vincent Granville
Granville leveraged his lifetime’s experience of working with big data, business analytics, and predictive modeling to compose a “handbook” on data science and data scientists. In this book, you will find learnings that are rarely found in traditional statistical, programming, or computer science textbooks as the author writes from experiential knowledge rather than theoretical.
Moreover, this book covers all the most valuable information to help you excel in your career as a data scientist. It talks about how data science came to the fore in recent times and became indispensable for organizations using big data.
The book is divided into three components:
What is data science and how does it relate to other disciplines
Data science technical applications along with tutorials and case studies
Career resources for future and practicing data scientists
This data science book also helps decision-makers to build a better analytics team by informing them about specialized solutions and their uses. Lastly, if you plan to launch a startup around data science, giving this book a reader will give you an edge with some quick ideas based on 20+ industrial experience in Granville.
9. Learning R: A Step-By-Step Function Guide to Data Analysis by Richard Cotton
Non-technical users are scared off by programming languages. This book is an asset for all non-tech learners of the R language. The author compiled a list of tools that make access to statistical models much easier. This book, step-by-step, introduces the reader to R without digging into the details of statistics and data modeling.
The first part of this data science book introduces you to the basics of the R programming language. It discusses data structures, data environment, looping constructs, and packages. If you are already familiar with the basics you can begin with the second part of the book to learn the steps involved in data analysis like loading, cleaning, and transforming data. The second part of the book gives more insight to perform exploratory analysis and modeling.
10. Data Analytics: A Comprehensive Beginner’s Guide to Learn About the Realms of Data Analytics From A-Z by Benjamin Smith
Smith pens down the path to learning data analytics from A to Z in easy-to-understand language. The book offers simplified explanations for challenging topics like sophisticated algorithms, or even the Euclidean Square Estimate. At any point, while reading this book, you will not feel overwhelmed by technical jargon or menacing formulas.
First, quickly after introducing the topic, the author then explains a real-world use case and then brings forth the technical jargon. Smith demonstrates almost every practical topic with the use of Python, to enable learners to recreate the projects by themselves. The handy tips and practical exercises are a bonus.
11. Data Science and Big Data Analytics: Discovering, Analyzing, Visualizing, and Presenting Data by EMC Education Services
With the implementation of Big Data analytics, you explore greater avenues to investigate and generate authentic outcomes to support businesses. It instigates deeper insights that were previously not conveniently doable for everyone. Readers of Data Science and Big Data Analytics perform integration with real-time feeds and queries of structured and unstructured data. As you progress with the chapters in this book, you will open new paths to insight and innovation.
EMC Education Services in this book introduced some of the key techniques and tools suggested by the practitioners for Big Data analytics. Mastering the tools upholds an opportunity of becoming an active contributor to the challenging projects of Big Data analytics. This data science book consists of twelve chapters, crafting a reader’s journey from the Basics of Big Data analytics toward a range of advanced analytical methods, including classification, regression analysis, clustering time series, and text analysis.
All these lessons speak to assist multiple stakeholders which include business and data analysts looking to add Big Data analytics skills to their portfolio; database professionals and managers of business intelligence, analytics, or Big Data groups looking to enrich their analytic skills; and college graduates investigating data science as a career field
12. An Introduction to Statistical Methods and Data Analysis by Lyman Ott
Lyman Ott discussed the powerful techniques used in statistical analysis for both advanced undergraduate and graduate students. This book helps students with solutions to solve problems encountered in research projects. Not only does it greatly benefit students in decision making but it also allows them to become critical readers of statistical analyses. The book gained positive feedback from different levels of learners because it presumes the readers to have little or no mathematical background, thus explaining the complex topics in an easy-to-understand way.
Ott extensively covered the introductory statistics in the starting 11 chapters. The book also targets students who struggle to ace their undergraduate capstone courses. Lastly, it provides research studies and examples that connect the statistical concepts to data analysis problems.
Data Science Dojo has launched Jupyter Hub for Computer Vision using Python offering to the Azure Marketplace with pre-installed libraries and pre-cloned GitHub repositories of famous Computer Vision books and courses which enables the learner to run the example codes provided.
What is computer vision?
It is a field of artificial intelligence that enables machines to derive meaningful information from visual inputs.
Computer vision using Python
In the world of computer vision, Python is a mainstay. Even if you are a beginner or the language application you are reviewing was created by a beginner, it is straightforward to understand code. Because the majority of its code is extremely difficult, developers can devote more time to the areas that need it.
Computer vision using Python
Challenges for individuals
Individuals who want to understand digital images and want to start with it usually lack the resources to gain hands-on experience with Computer Vision. A beginner in Computer Vision also faces compatibility issues while installing libraries along with the following:
Image noise and variability: Images can be noisy or low quality, which can make it difficult for algorithms to accurately interpret them.
Scale and resolution: Objects in an image can be at different scales and resolutions, which can make it difficult for algorithms to recognize them.
Occlusion and clutter: Objects in an image can be occluded or cluttered, which can make it difficult for algorithms to distinguish them.
Illumination and lighting: Changes in lighting conditions can significantly affect the appearance of objects in an image, making it difficult for algorithms to recognize them.
Viewpoint and pose: The orientation of objects in an image can vary, which can make it difficult for algorithms to recognize them.
Occlusion and clutter: Objects in an image can be occluded or cluttered, which can make it difficult for algorithms to distinguish them.
Background distractions: Background distractions can make it difficult for algorithms to focus on the relevant objects in an image.
Real-time performance: Many applications require real-time performance, which can be a challenge for algorithms to achieve.
What we provide
Jupyter Hub for Computer Vision using the language solves all the challenges by providing you an effortless coding environment in the cloud with pre-installed computer vision python libraries which reduces the burden of installation and maintenance of tasks hence solving the compatibility issues for an individual.
Moreover, this offer provides the learner with repositories of famous books and courses on the subject which contain helpful notebooks which serve as a learning resource for a learner in gaining hands-on experience with it.
The heavy computations required for its applications are not performed on the learner’s local machine. Instead, they are performed in the Azure cloud, which increases responsiveness and processing speed.
Listed below are the pre-installed python libraries and the sources of repositories of Computer Vision books provided by this offer:
Python libraries
Numpy
Matplotlib
Pandas
Seaborn
OpenCV
Scikit Image
Simple CV
PyTorch
Torchvision
Pillow
Tesseract
Pytorchcv
Fastai
Keras
TensorFlow
Imutils
Albumentations
Repositories
GitHub repository of book Modern Computer Vision with PyTorch, by author V Kishore Ayyadevara and Yeshwanth Reddy.
GitHub repository of Computer Vision Nanodegree Program, by Udacity.
GitHub repository of book OpenCV 3 Computer Vision with Python Cookbook, by author Aleksandr Rybnikov.
GitHub repository of book Hands-On Computer Vision with TensorFlow 2, by authors Benjamin Planche and Eliot Andres.
Conclusion
Jupyter Hub for Computer Vision using Python provides an in-browser coding environment with just a single click, hence providing ease of installation. Through this offer, a learner can dive into the world of this industry to work with its various applications including automotive safety, self-driving cars, medical imaging, fraud detection, surveillance, intelligent video analytics, image segmentation, and code and character reader (or OCR).
Jupyter Hub for Computer Vision using Python offered by Data Science Dojo is ideal to learn more about the subject without the need to worry about configurations and computing resources. The heavy resource requirement to deal with large Images, and process and analyzes those images with its techniques is no more an issue as data-intensive computations are now performed on Microsoft Azure which increases processing speed.
At Data Science Dojo, we deliver data science education, consulting, and technical services to increase the power of data. We are therefore adding a free Jupyter Notebook Environment dedicated specifically for it using Python. Install the Jupyter Hub offer now from the Azure Marketplace, your ideal companion in your journey to learn data science!
This blog will cover how to build a recommendation system using Python libraries to perform web scrapping and carry out text transformation. It will teach you how to create your own dataset and further build a content-based recommendation system.
Introduction
A simple recommender system flow
The purpose of Data Science (DS) and Artificial Intelligence (AI) is to add value to a business by utilizing data and applying applicable programming skills. In recent years, Netflix, Amazon, Uber Eats, and other companies have made it possible for people to avail certain commodities with only a few clicks while sitting at home. However, in order to provide users with the most authentic experience possible, these platforms have developed recommendation systems that provide users with a variety of options based on their interests and preferences.
In general, recommendation systems are algorithms that curate data and provide consumers with appropriate material. There are three main types of recommendation engines:
Collaborative filtering: Collaborative filtering collects data regarding user behavior, activities, and preferences to predict what a person will like, based on their similarity to other users.
Content-based filtering: This algorithms analyze the possibility of objects being related to each other using statistics, and then offers possible outcomes to the user based on the highest probabilities.
Hybrid of the two. In a hybrid recommendation engine, natural language processing tags can be generated for each product or item (movie, song), and vector equations are used to calculate the similarity of products.
Building a recommendation system using Python
In this blog, we will walk through the process of scraping a web page for data and using it to develop a recommendation system, using built-in python libraries. Scraping the website to extract useful data will be the first component of the blog. Moving on, text transformation will be performed to alter the extracted data and make it appropriate for our recommendation system to use.
Finally, our content-based recommender system will calculate the cosine similarity of each blog with the rest of the blogs and then suggest three comparable blogs for each blog post.
Flow for recommendation system using web scrapping
First step: Web scrapping
The purpose of going through the web scrapping process is to teach how to automate data entry for a recommender system. Knowing how to extract data from the internet will allow you to develop skills to create your own dataset using an entire webpage. Now, let us perform web scraping on the blogs page of online.datasciencedojo.com.
In this blog, we will extract relevant information to make up our dataset. From the first page, we will extract the URL, name, and description of each blog. By extracting the URL, we will have access to redirect our algorithm to each blog page and extract the name and description from the metadata.
The code below uses multiple python libraries and extracts all the URLs from the first page. In this case, it will return ten URLs. For building better concepts regarding web scrapping, I would suggest exploring and playing with these libraries to better understand their functionalities.
Note: The for loop is used to extract URLs from multiple pages.
import requests
import lxml.html
from lxml import objectify
from bs4 import BeautifulSoup
#List for storing urls
urls_final = []
#Extract the metadata of the page
for i in range(1):
url = 'https://online.datasciencedojo.com/blogs/?blogpage='+str(i)
reqs = requests.get(url)
soup = BeautifulSoup(reqs.text, 'lxml')
#Temporary lists for storing temporary data
urls_temp_1 = []
urls_temp_2=[]
temp=[]
#From the metadata, get the relevant information.
for h in soup.find_all('a'):
a = h.get('href')
urls_temp_1.append(a)
for i in urls_temp_1:
if i != None :
if 'blogs' in i:
if 'blogpage' in i:
None
else:
if 'auth' in i:
None
else:
urls_temp_2.append(i)
[temp.append(x) for x in urls_temp_2 if x not in temp]
for i in temp:
if i=='https://online.datasciencedojo.com/blogs/':
None
else:
urls_final.append(i)
print(urls_final)
Output
['https://online.datasciencedojo.com/blogs/regular-expresssion-101/',
'https://online.datasciencedojo.com/blogs/python-libraries-for-data-science/',
'https://online.datasciencedojo.com/blogs/shareable-data-quotes/',
'https://online.datasciencedojo.com/blogs/machine-learning-roadmap/',
'https://online.datasciencedojo.com/blogs/employee-retention-analytics/',
'https://online.datasciencedojo.com/blogs/jupyter-hub-cloud/',
'https://online.datasciencedojo.com/blogs/communication-data-visualization/',
'https://online.datasciencedojo.com/blogs/tracking-metrics-with-prometheus/',
'https://online.datasciencedojo.com/blogs/ai-webmaster-content-creators/',
'https://online.datasciencedojo.com/blogs/grafana-for-azure/']
Once we have the URLs, we move towards processing the metadata of each blog for extracting their name and description.
#Getting the name and description
name=[]
descrip_temp=[]
#Now use each url to get the metadata of each blog post
for j in urls_final:
url = j
response = requests.get(url)
soup = BeautifulSoup(response.text)
#Extract the name and description from each blog
metas = soup.find_all('meta')
name.append([ meta.attrs['content'] for meta in metas if 'property' in meta.attrs and meta.attrs['property'] == 'og:title' ])
descrip_temp.append([ meta.attrs['content'] for meta in metas if 'name' in meta.attrs and meta.attrs['name'] == 'description' ])
print(name[0])
print(descrip_temp[0])
Output:
['RegEx 101 - beginner’s guide to understand regular expressions']
['A regular expression is a sequence of characters that specifies a search pattern in a text. Learn more about Its common uses in this regex 101 guide.']
Second step: Text transformation
Similar to any task involving text, exploratory data analysis (EDA) is a fundamental part of any algorithm. In order to prepare data for our recommender system, data must be cleaned and transformed. For this purpose, we will be using built-in python libraries to remove stop words and transform data.
The code below uses the regex library to perform text transformation by removing punctuations, emojis, and more. Furthermore, we have imported a natural language toolkit (nlkt) to remove stop words.
Note: Stop words are a set of commonly used words in a language. Examples of stop words in English are “a”, “the”, “is”, “are” etc. They are so frequently used in the text that they hold a minimal amount of useful information.
import nltk
from nltk.corpus import stopwords
nltk.download("stopwords")
import re
#Removing stop words and cleaning data
stop_words = set(stopwords.words("english"))
descrip=[]
for i in descrip_temp:
for j in i:
text = re.sub("@\S+", "", j)
text = re.sub(r'[^\w\s]', '', text)
text = re.sub("\$", "", text)
text = re.sub("@\S+", "", text)
text = text.lower()
descrip.append(text)
Following this, we will be creating a bag of words. If you are not familiar with it, a bag of words is a representation of text that describes the occurrence of words within a document. It involves two things: A vocabulary of known words, and a measure of the presence of those words. For our data, it will represent all the keywords words in the dataset and calculate which words are used in each blog and the number of occurrences they have. The code below uses a built-in function to extract keywords.
from keras.preprocessing.text import Tokenizer
#Building BOW
model = Tokenizer()
model.fit_on_texts(descrip)
bow = model.texts_to_matrix(descrip, mode='count')
bow_keys=f'Key : {list(model.word_index.keys())}'
For building better concepts, here are all the extracted keywords.
The code below assigns each keyword an index value and calculates the frequency of each word being used per blog. When building a recommendation system, these keywords and their frequencies for each blog will act as the input. Based on similar keywords, our algorithm will link blog posts together into similar categories. In this case, we will have 10 blogs converted into rows and 139 keywords converted into columns.
import pandas as pd
#Creating df
df_name=pd.DataFrame(name)
df_name.rename(columns = {0:'Blog'}, inplace = True)
df_count=pd.DataFrame(bow)
frames=[df_name,df_count]
result=pd.concat(frames,axis=1)
result=result.set_index('Blog')
result=result.drop([0], axis=1)
for i in range(len(bow)):
result.rename(columns = {i+1:i}, inplace = True)
result
Input for recommendation system
Third step: Cosine similarity
Whenever we are performing some tasks involving natural language processing and want to estimate the similarity between texts, we use some pre-defined metrics that are famous for providing numerical evaluations for this purpose. These metrics include:
Euclidean Distance
Cosine similarity
Jaccard similarity
Pearson similarity
While all four of them can be used to evaluate a similarity index between text documents, we will be using cosine similarity for our task. Cosine similarity, in data analysis, measures the similarity between two vectors of an inner product space. It is often used to measure document similarity in text analysis.It measures the cosine of the angle between two vectors and determines a numerical value indicating the probability of those vectors being in the same direction. The code alongside the heatmap shown below visualizes the cosine similarity index for all the blogs.
from sklearn.metrics.pairwise import cosine_similarity
import seaborn as sns
#Calculating cosine similarity
df_name=df_name.convert_dtypes(str)
temp_df=df_name['Blog']
sim_df = pd.DataFrame(cosine_similarity(result, dense_output=True))
for i in range(len(name)):
sim_df.rename(columns = {i:temp_df[i]},index={i:temp_df[i]}, inplace = True)
ax = sns.heatmap(sim_df)
Recommendation System Heatmap Output
Fourth step: Evaluation
In the code below, our recommender system will extract the three most similar blogs for each blog using Pandas DataFrame.
Note: For each blog, the blog itself is also recommended because it was calculated to be the most similar blog, with the maximum cosine similarity index, 1.
Output for content-based recommendation System Python
Conclusion
This blog post covered a beginner’s method of building a recommendation system using python. While there are other methods to develop recommender systems, the first step is to outline the requirements of the task at hand. To learn more about this, experiment with the code and try to extract data from another web page or enroll in our Python for Data Science course and learn all the required concepts regarding Python fundamentals.
Finding the top Python packages for data science and libraries that aren’t only popular, but get the job done isn’t easy. Here’s a list to help you out.
Out of all the Python scientific libraries and packages available, which ones are not only popular but the most useful in getting the job done?
Python packages for data science and libraries
To help you filter down a list of libraries and packages worth adding to your data science toolbox, we have compiled our top picks for aspiring and practicing data scientists. But you’ll also want to know how to best use these tools for tricky, real-world data problems. So instead of leaving you with yet another top-choice list among a quintillion list, we explain how to make the most of these libraries using real-world examples.
You can learn more about how these packages fit into data science with Data Science Dojo’s introduction to Python course.
Data manipulation
Pandas
There’s a reason why pandas consistently tops published ranks on data science-related libraries in Python. The library can help you with a variety of tasks, but it is particularly useful for data manipulation or data wrangling. It can save you a lot of leg work in not only your typical rudimentary data manipulation tasks but also in handling some pretty tricky problems you might encounter when slicing and filtering.
Multi-indexed data can be one of these tricky tasks. The library pandas takes care of advanced indexing, including multi-indexing, where you might need to work with higher-dimensional data or multiple index levels. For example, the number of user interactions might be indexed by 1) product category, 2) the time of day the user interacted with the product, and 3) the location of the user.
Instead of your typical table of rows and columns to represent the data, you might find it better to organize the number of user interactions into all cases that fall under the x product category, with y time of day, and z location. This way you can easily see user interactions across each condition of product category, time of day, and user location. This saves you from having to apply a filter or group for all combinations of conditions in your traditional row-and-table structure.
Here is one way to multi-index data in pandas. With less than a few lines of code, pandas makes this easy to implement in Python:
import pandas as pd

data_multi_indx = table_data.set_index(['Product', 'Day of Week'])
print(data_multi_indx)
'''
Output:
                      Location  Num User Interactions
Product   Day of Week
Product 1 Morning            A                      3
          Morning            B                     90
          Morning            C                      7
          Afternoon          A                     17
          Afternoon          B                      1
          Afternoon          C                     82
Product 2 Morning            A                     27
          Morning            B                     70
          Morning            C                      3
          Afternoon          A                      1
          Afternoon          B                      1
          Afternoon          C                     98
Product 3 Morning            A                     94
          Morning            B                      5
          Morning            C                      1
          Afternoon          A                      0
          Afternoon          B                      7
          Afternoon          C                     93
'''
For the more rudimentary data manipulation tasks, pandas doesn’t require much effort on your part. You can simply use the functions available for imputing missing values, one-hot encoding, dropping columns and rows, and so on.
Here are a few example classes and functions pandas that make rudimentary data manipulation easy in a few lines of code, at most.
Fill in missing values on a column or the whole data frame with a value such as the mean, median, or mode.
isna(data)/isnull(data)
Check for missing values.
get_dummies(data_frame['Column'])
Apply one-hot encoding on a column.
to_numeric(data_frame['Column'])
Convert a column of values from strings to numeric values.
to_string(data_frame['Column'])
Convert a column of values from numeric values to strings.
to_datetime(data_frame['Column'])
Convert a column of datetimes in string format to standard datetime format.
drop(columns=['Column0','Column1'])
Drop specific columns or useless columns in your data frame.
drop(data.frame.index[[rownum0,rownum1]])
Drop specific rows or useless rows in your data frame.
NumPy
Another library that keeps topping the ranks is numpy. This library can handle many tasks, but it is particularly useful when working with multi-dimensional arrays and performing calculations on these arrays. This can be tricky to do in more conventional ways, where you need to find the index of a value or certain values inside another index, with multiple indices.
This is where numpy shows its strength. Its array() function means standard arrays can be simply added and nicely bundled into a multi-dimensional array. Calculations on these arrays can also be easily implemented using numpy’s vast array (pun intended) of mathematical functions.
Let’s picture an example where numpy’s multi-dimensional arrays are useful. A company tracks or records if a user was/was not shown a mobile product in the morning, afternoon, and night, delivered through a mobile notification. Based on the level of user interaction with the shown product, the company also records a user engagement score.
Data points on each user’s shown product and engagement score are stored inside an array; each array stores these values for each user. The company would like to quickly and simply bundle all user arrays.
In addition to this, using engagement score and purchase history, the company would like to calculate and identify the minimum distance (or difference) across all users’ data points so that users who follow a similar pattern can be categorized and targeted accordingly.
numpy’s array() makes it easy to bundle user arrays into a multi-dimensional array and argmin() and linalg.norm() find the min Euclidean distance between users, as an example of the kinds of calculations that can be done on a multi-dimensional array:
import numpy as np

# Records tracking whether user was/was not shown product during
# morning, afternoon, and night, and user engagement score
user_0 = [0,0,1,0.7]
user_1 = [0,1,0,0.4]
user_2 = [1,0,0,0.0]
user_3 = [0,0,1,0.9]
user_4 = [0,1,0,0.3]
user_5 = [1,0,0,0.0]
# Create a multi-dimensional array to bundle all users
# Can use arrays with mixed data types by specifying
# the object data type in numpy multi-dimensional arrays
users_multi_dim = np.array([user_0,user_1,user_2,user_3,user_4,user_5],dtype=object)
print(users_multi_dim)
'''
Output:
[[0 0 1 0.7]
 [0 1 0 0.4]
 [1 0 0 0.0]
 [0 0 1 0.9]
 [0 1 0 0.3]
 [1 0 0 0.0]]
'''
# To view which user was/was not shown the product
# either morning, afternoon or night, pandas easily
# allows you to index and label the data
row_names = [_ for _ in ['User 0','User 1','User 2','User 3','User 4','User 5']]
col_names = [_ for _ in ['Product Shown Morning','Product Shown Afternoon',
                         'Product Shown Night','User Engagement Score']]
users_df_indexed = pd.DataFrame(users_multi_dim,index=row_names,columns=col_names)
print(users_df_indexed)
'''
Output:
       Product Shown Morning Product Shown Afternoon Product Shown Night User Engagement Score
User 0                     0                       0                   1                   0.7
User 1                     0                       1                   0                   0.4
User 2                     1                       0                   0                     0
User 3                     0                       0                   1                   0.9
User 4                     0                       1                   0                   0.3
User 5                     1                       0                   0                     0
'''
# Find which existing user is closest to the engagement
# and purchase behavior of a new user by calculating the
# min Euclidean distance on a numpy multi-dimensional array
user_0 = [0.7,51.90,2]
user_1 = [0.4,25.95,1]
user_2 = [0.0,0.00,0]
user_3 = [0.9,77.85,3]
user_4 = [0.3,25.95,1]
user_5 = [0.0,0.00,0]
users_multi_dim = np.array([user_0,user_1,user_2,user_3,user_4,user_5])
new_user = np.array([0.8,77.85,3])
closest_to_new = np.argmin(np.linalg.norm(users_multi_dim-new_user,axis=1))
print('User', closest_to_new, 'is closest to the new user')
'''
Output:
User 3 is closest to the new user
'''
Data modeling
Statsmodels
The main strength of statsmodels is its focus on statistics, going beyond the ‘machine learning out-of-the-box’ approach. This makes it a popular choice for data scientists. Conducting statistical tests to find significantly different variables, checking for normality in your data, checking the standard errors, and so on, cannot be underestimated when trying to build the most effective model you can build. Your model is only as good as your inputs, and statsmodels is designed to help you better understand and customize your inputs.
The library also covers an exhaustive list of predictive models to choose from, depending on your predictors and outcome variable(s). It covers your classic Linear Regression models (including ordinary least squares, weighted least squares, recursive least squares, and more), Generalized Linear models, Linear Mixed Effects models, Binomial and Poisson Bayesian models, Logit and Probit models, Time Series models (including autoregressive integrated moving average, dynamic factor, unobserved component, and more), Hidden Markov models, Principal Components and other techniques for Multivariate models, Kernel Density estimators, and lots more.
Here are the classes and functions in statsmodels that cover the main modeling techniques useful for many prediction tasks.
Scikit-learn
Any library that makes machine learning more accessible and easier to implement is bound to make the top choice list among aspiring and practicing data scientists. The Library scikit-learn not only allows models to be easily implemented out-of-the-box but also offers some auto fine-tuning.
Finding the best possible combination of model parameters is a key example of fine-tuning. The library offers a few good ways to search for the optimal set of parameters, given the algorithm and problem to solve. The grid search and random search algorithms in scikit-learn evaluate different combinations of parameters until they find the best combo that results in the best outcome, or a better-performing model.
The grid search goes through every possible combination, whereas the random search randomly samples the parameters over a fixed number of times/iterations. Cross-validating your model on many subsets of data is also easy to implement using scikit-learn. With this kind of automation, the library offers data scientists a massive time saver when building models.
The library also covers all the essential machine learning models from classification (including Support Vector Machine, Random Forest, etc), to regression (including Ridge Regression, Lasso Regression, etc), and clustering (including k-Means, Mean Shift, etc).
Here are the classes and functions in scikit-learn that cover the main modeling techniques useful for many prediction tasks.
Clustering models: k-Means, Affinity Propagation, Mean Shift, Agglomerative Hierarchical Clustering
Data visualization
Plotly
The libraries matplotlib and seaborn will easily take care of your basic static plot functions, which are important for your own internal exploration or understanding of the data. But when presenting visual insights to business folks or users, interactivity is where we are headed these days.
Using JavaScript functionality, plotly renders interactive graphs in the form of zooming in and panning out of the graph panel, hovering over objects for more information, and dragging objects into position to further explore relationships in the data. Graphs can be customized to your heart’s content.
Here are just a few of the many tricks that Plotly offers:
Feature
Description
hovermode, hoverinfo
Controls the mode and text when a user hovers over an object.
on_selection(), on_click()
Allows a user to select or click on an object and have that selected object change color, for example.
update
Modifies a graph’s layout and data such as titles and annotations.
animate
Creates an animated graph.
Bokeh
Much like plotly, bokeh also offers interactive graphs. But one feature that stands out in bokeh is linked interactions. This is useful when keeping separate graphs in unison, where the user interacts with one graph and needs to compare with the other while they are in sync. For example, a user zooms into a graph, effectively changing the range of the graph, and then would like to compare it with the second graph. The second graph would need to automatically update its range so that both graphs can be easily compared like-for-like.
Here are some key tricks that bokeh offers:
Feature
Description
figure()
Creates a new plot and allows linking to the range of another plot.
HoverTool(), hover_glyph
Allows users to hover over an object for more information.
selection_glyph
Selects a particular glyph object for styling.
Slider()
Creates a slider to dynamically update the plot based on the slide range.
There is so much to explore when it comes to spatial visualization using Python’s Folium library.
Spatial visualization
For problems related to crime mapping, housing prices, or travel route optimization, spatial visualization could be the most resourceful tool for getting a glimpse of how the instances are geographically located. This is beneficial as we are getting massive amounts of data from several sources, such as cellphones, smartwatches, trackers, etc. In this case, patterns and correlations, which otherwise might go unrecognized, can be extracted visually.
This blog will attempt to show you the potential of spatial visualization using the Folium library with Python. This tutorial will give you insights into the most important visualization tools that are extremely useful while analyzing spatial data.
Introduction to folium
Folium is an incredible library that allows you to build Leaflet maps. Using latitude and longitude points, Folium can allow you to create a map of any location in the world.Furthermore, Folium creates interactive maps that may allow you to zoom in and out after the map is rendered.
We’ll get some hands-on practice building a few maps using the Seattle Real-time Fire 911 Calls dataset. This dataset provides Seattle Fire Department 911 dispatches, and every instance of this dataset provides information about the address, location, date/time and type of emergency of a particular incident. It’s extensive, and we’ll limit the dataset to a few emergency types for the purpose of explanation.
Let’s begin
Folium can be downloaded using the following commands:.
Using pip:
$ pip install folium
Using conda:
$ conda install -c conda-forge folium
Start by importing the required libraries.
import pandas as pd
import numpy as np
import folium
Let us now create an object named ‘seattle_map’which is defined as a folium.Mapobject. We can add other folium objects on top of the folium.Map to improve the map rendered. The map has been centered to the longitude and latitude points in the location parameters. The zoom parameter sets the magnification level for the map that’s going to be rendered. Moreover, we have also set the tiles parameter to ‘OpenStreetMap’ which is the default tile for this parameter. You can explore more tiles such as StamenTerrain or Mapbox Control in Folium‘s documentation.
Seattle map centered to the longitude and latitude points in the location parameters.
We can observe the map rendered above. Let’s create another map object with a different tile and zoom_level. Through the ‘Stamen Terrain’ tile, we can visualize the terrain data, which can be used for several important applications.
We’ve also inserted a folium. Marker to our ‘seattle_map2’ map object below. The marker can be placed at any location specified in the square brackets. The string mentioned in the popup parameter will be displayed once the marker is clicked, as shown below.
We are interested to use the Seattle 911 calls dataset to visualize the 911 calls in the year 2019 only. We are also limiting the emergency types to 3 specific emergencies that took place during this time.
We will now import our dataset, which is available through this link (in CSV format). The dataset is huge, therefore, we’ll only import the first 10,000 rows using the Pandasread_csv method. We’ll use the head method to display the first 5 rows.
(This process will take some time because the data-set is huge. Alternatively, you can download it to your local machine and then insert the file path below)
Seattle dataset for visualization with longitude and latitude
Using the code below, we’ll convert the datatype of our Datetime variable to Date-time format and extract the year, removing all other instances that occurred before 2019.
We’ll now limit the Emergency type to ‘Aid Response Yellow’, ‘Auto Fire Alarm’ and ‘MVI – Motor Vehicle Incident’. The remaining instances will be removed from the ‘seattle911’ dataframe.
seattle911 = seattle911[seattle911.Type.isin(['Aid Response Yellow',
                                              'Auto Fire Alarm',
                                              'MVI - Motor Vehicle Incident'])]
We’ll remove any instance that has a missing longitude or latitude coordinate. Without these values, the particular instance cannot be visualized and will cause an error while rendering.
Now let’s step towards the most interesting part. We’ll map all the instances onto the map object we created above, ‘seattle_map’. Using the code below, we’ll loop over all our instances up to the length of the dataframe. Following this, we will create a folium.CircleMarker (which is similar to the folium.Marker we added above). We’ll assign the latitude and longitude coordinates to the location parameter for each instance. The radius of the circle has been assigned to 3, whereas the popup will display the address of the particular instance.
As you can notice, the color of the circle depends on the emergency type. We will now render our map.
for i in range(len(seattle911)):

    folium.CircleMarker( location = [seattle911.Latitude.iloc[i], seattle911.Longitude.iloc[i]],
        radius = 3,
        popup = seattle911.Address.iloc[i],
        color = '#3186cc' if seattle911.Type.iloc[i] == 'Aid Response Yellow' else '#6ccc31'
        if seattle911.Type.iloc[i] =='Auto Fire Alarm' else '#ac31cc',).add_to(seattle_map)
seattle_map
The map gives us insights about where the emergency takes place across Seattle during 2019
Voila! The map above gives us insights about where and what emergencies took place across Seattle during 2019. This can be extremely helpful for the local government to more efficiently place its emergency combat resources.
Advanced features provided by folium
Let us now move towards the slightly advanced features provided by Folium. For this, we will use the National Obesity by State dataset which is also hosted on data.gov. There are 2 types of files we’ll be using, a csv file containing the list of all states and the percentage of obesity in each state, and a geojson file (based on JSON) that contains geographical features in form of polygons.
Before using our dataset, we’ll create a new folium.map object with location parameters including coordinates to center the US on the map, whereas, we’ve set the ‘zoom_start’ level to 4 to visualize all the states.
We will use the ‘state_boundaries’ file to visualize the boundaries and areas covered by each state on our folium.Map object. This is an overlay on our original map and similarly, we can visualize multiple layers on the same map. This overlay will assist us in creating our choropleth map that is discussed ahead.
The ‘obesity_data’ dataframe can be viewed below. It contains 5 variables. However, for the purpose of this demonstration, we are only concerned with the ‘NAME’ and ‘Obesity’ attributes.
Now comes the most interesting part! Creating a choropleth map. We’ll bind the ‘obesity_data’ data frame with our ‘state_boundaries’geojson file. We have assigned both the data files to our variables ‘data’and ‘geo_data’respectively. The columns parameter indicates which DataFrame columns to use, whereas, the key_on parameter indicates the layer in the GeoJSON on which to key the data.
We have additionally specified several other parameters that will define the color scheme we’re going to use. Colors are generated from Color Brewer’s sequential palettes.
By default, linear binning is used between the min and the max of the values. Custom binning can be achieved with the bins parameter.
Awesome! We’ve been able to create a choropleth map using a simple set of functions offered by Folium. We can visualize the obesity pattern geographically and uncover patterns not visible before. It also helped us in gaining clarityabout the data, more than just simplifying the data itself.
You might now feel powerful enough after attaining the skill to visualize spatial data effectively. Go ahead and explore Folium‘s documentation to discover the incredible capabilities that this open-source library has to offer.
Thanks for reading! If you want more datasets to play with, check out this blog post. It consists of 30 free datasets with questions for you to solve.
In the second article of this chatbot series, learn how to build a rule-based chatbot and discuss their business applications.
Chatbots have surged in popularity, becoming pivotal in text-based customer interactions, especially in support services. It’s expected that nearly 25% of customer service operations will use them by 2020.
In the first part of A Beginners Guide to Chatbots, we discussed what chatbots were, their rise to popularity, and their use cases in the industry. We also saw how the technology has evolved over the past 50 years.
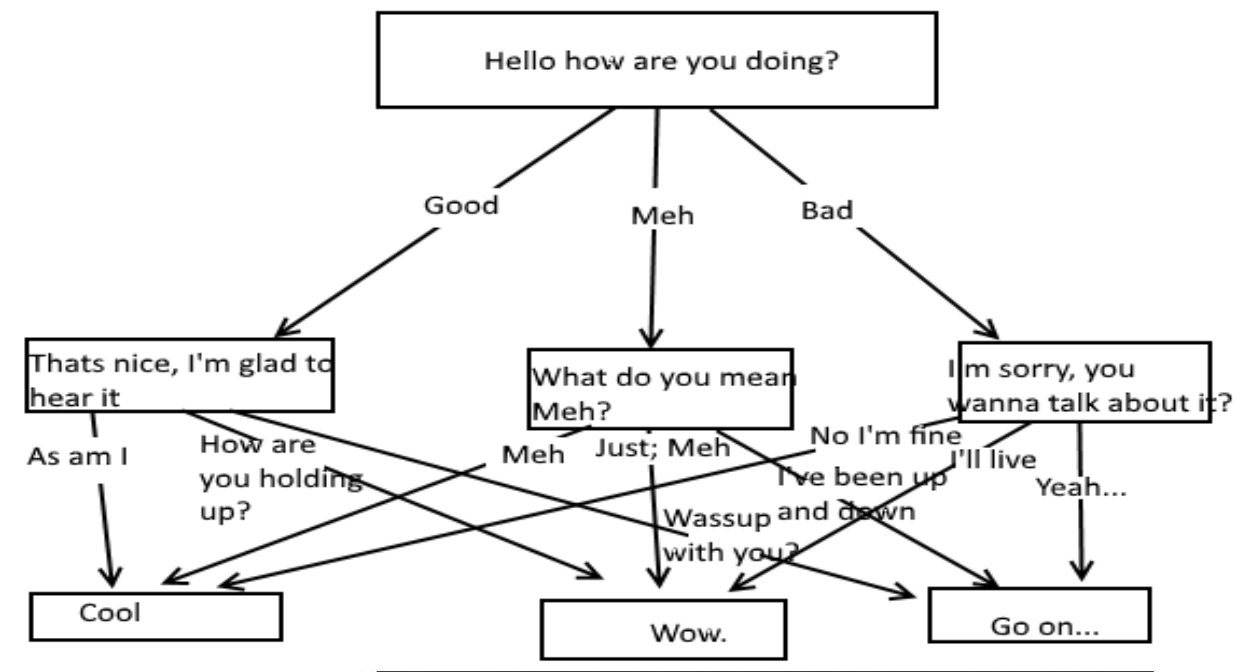
In this second part of the series, we’ll take you through the process of building a simple Rule-based chatbot in Python. Before we start with the tutorial, we need to understand the different types of chatbots and how they work.
Types of chatbots
Chatbots can be classified into two different types based on how they are built:
Rule-based Chatbots
Rule-based chatbots are pretty straightforward. They use a predefined response database and follow set rules to determine appropriate replies. Although they can’t generate answers independently, their effectiveness hinges on the depth of the response database and the efficiency of their rules.
The simplest form of Rule-based Chatbots has one-to-one tables of inputs and their responses. These bots are extremely limited and can only respond to queries if they are an exact match with the inputs defined in their database.
AI-based chatbots
With the rise in the use of machine learning in recent years, a new approach to building chatbots has emerged. With the use of artificial intelligence, creating extremely intuitive and precise chatbots tailored to specific purposes has become possible.
Unlike their rule-based kin, AI-based chatbots are based on complex machine-learning models that enable them to self-learn.
Libraries for building a rule-based chatbot
Now that we’re familiar with how chatbots work, we’ll be looking at the libraries that will be used to build our simple Rule-based Chatbot.
Natural Language Toolkit (NLTK)
Natural Language Toolkit is a Python library that makes it easy to process human language data. It provides easy-to-use interfaces to many language-based resources such as the Open Multilingual Wordnet, and access to a variety of text-processing libraries.
Regular Expression (RegEx) in Python
A regular expression is a special sequence of characters that helps you search for and find patterns of words/sentences/sequences of letters in sets of strings, using a specialized syntax. They are widely used for text searching and matching in UNIX.
Python includes support for regular expression through the re package.
This very simple rule-based chatbot will work by searching for specific keywords in user input. The keywords will help determine the desired action of the user (user’s intent). Once the intent is identified, the bot will pick out an appropriate response.
Role of intent in a rule-based chatbot
The list of keywords and a dictionary of responses will be built up manually based on the specific use case for the chatbot.
We’ll be designing a very simple chatbot for a bank that can respond to greetings (Hi, Hello, etc.) and answer questions about the bank’s hours of operation.
A flow of how the chatbot would process inputs is shown below:
The flow of input requests by a chatbot
We will be following the steps below to build our chatbot
Importing Dependencies
Building the Keyword List
Building a dictionary of Intents
Defining a dictionary of responses
Matching Intents and Generating Responses
Importing dependencies
First, we will import needed the packages/libraries. The re package handles regular expressions in Python. We’ll also use WordNet from NLTK, a lexical database that defines semantic relationships between words, to build a dictionary of synonyms for our keywords. This will expand our list of keywords without manually introducing every possible word a user could use.
# Importing modules
import re
from nltk.corpus import wordnet
Building a list of keywords
Once we have imported our libraries, we’ll need to build up a list of keywords that our chatbot will look for. This list can be as exhaustive as you want. The more keywords you have, the better your chatbot will perform.
As discussed previously, we’ll be using WordNet to build up a dictionary of synonyms to our keywords. For details about how WordNet is structured, visit their website.
Code:
# Building a list of Keywords
list_words=['hello','timings']
list_syn={}
for word in list_words:
    synonyms=[]
    for syn in wordnet.synsets(word):
        for lem in syn.lemmas():
            # Remove any special characters from synonym strings
            lem_name = re.sub('[^a-zA-Z0-9 \n\.]', ' ', lem.name())
            synonyms.append(lem_name)
    list_syn[word]=set(synonyms)
print (list_syn)
Output:
hello
{'hello', 'howdy', 'hi', 'hullo', 'how do you do'}
timings
{'time', 'clock', 'timing'}
Here, we first defined a list of words list_words that we will be using as our keywords. We used WordNet to expand our initial list with synonyms of the keywords. This list of keywords is stored in list_syn.
New keywords can simply be added to list_words. The chatbot will automatically pull their synonyms and add them to the keywords dictionary. You can also edit list_syn directly if you want to add specific words or phrases that you know your users will use.
Building a dictionary of intents
Once our keywords list is complete, we need to build up a dictionary that matches our keywords to intents. We also need to reformat the keywords in a special syntax that makes them visible to Regular Expression’s search function.
Code:
# Building dictionary of Intents & Keywords
keywords={}
keywords_dict={}
# Defining a new key in the keywords dictionary
keywords['greet']=[]
# Populating the values in the keywords dictionary with synonyms of keywords formatted with RegEx metacharacters
for synonym in list(list_syn['hello']):
    keywords['greet'].append('.*\\b'+synonym+'\\b.*')

# Defining a new key in the keywords dictionary
keywords['timings']=[]
# Populating the values in the keywords dictionary with synonyms of keywords formatted with RegEx metacharacters
for synonym in list(list_syn['timings']):
    keywords['timings'].append('.*\\b'+synonym+'\\b.*')
for intent, keys in keywords.items():
    # Joining the values in the keywords dictionary with the OR (|) operator updating them in keywords_dict dictionary
    keywords_dict[intent]=re.compile('|'.join(keys))
print (keywords_dict)
The updated and formatted dictionary is stored in keywords_dict. The intent is the key and the string of keywords is the value of the dictionary.
Let’s look at one key-value pair of the keywords_dict dictionary to understand the syntax of Regular Expression;
{'greet': re.compile('.*\\bhullo\\b.*|.*\\bhow-do-you-do\\b.*|.*\\bhowdy\\b.*|.*\\bhello\\b.*|.*\\bhi\\b.*')
 Regular Expression uses specific patterns of special Meta-Characters to search for strings or sets of strings in an expression.
Since we need our chatbot to search for specific words in larger input strings we use the following sequences of meta-characters:
.*\\bhullo\\b.*
In this specific sequence, the keyword (hullo) is encased between a \b sequence. This tells the RegEx Search function that the search parameter is the keyword (hullo).
The first sequence \bhullo\b is encased between a period star .* sequence. This sequence tells the RegEx Search function to search the entire input string from beginning to end for the search parameter (hullo).
In the dictionary, multiple such sequences are separated by the OR | operator. This operator tells the search function to look for any of the mentioned keywords in the input string.
More details about Regular Expression and its syntax can be found here. You can add as many key-value pairs to the dictionary as you want to increase the functionality of the chatbot.
Defining responses
The next step is defining responses for each intent type. This part is very straightforward. The responses are described in another dictionary with the intent being the key.
We’ve also added a fallback intent and its response. This is a fail-safe response in case the chatbot is unable to extract any relevant keywords from the user input.
Code:
# Building a dictionary of responses
responses={
    'greet':'Hello! How can I help you?',
    'timings':'We are open from 9AM to 5PM, Monday to Friday. We are closed on weekends and public holidays.',
    'fallback':'I dont quite understand. Could you repeat that?',
}
Matching intents and generating responses
Now that we have the back end of the chatbot completed, we’ll move on to taking input from the user and searching the input string for our keywords.
We use the RegEx Search function to search the user input for keywords stored in the value field of the keywords_dict dictionary. If you recall, the values in the keywords_dict dictionary were formatted with special sequences of meta-characters.
RegEx’s search function uses the sequences to compare the character patterns in the keywords with the input string. If a match is found, the current intent is selected and used as a key to the responses dictionary to select the correct response.
Code:
print ("Welcome to MyBank. How may I help you?")
# While loop to run the chatbot indefinetely
while (True):
    # Takes the user input and converts all characters to lowercase
    user_input = input().lower()
    # Defining the Chatbot's exit condition
    if user_input == 'quit':
        print ("Thank you for visiting.")
        break
    matched_intent = None
    for intent,pattern in keywords_dict.items():
        # Using the regular expression search function to look for keywords in user input
        if re.search(pattern, user_input):
            # if a keyword matches, select the corresponding intent from the keywords_dict dictionary
            matched_intent=intent
    # The fallback intent is selected by default
    key='fallback'
    if matched_intent in responses:
        # If a keyword matches, the fallback intent is replaced by the matched intent as the key for the responses dictionary
        key = matched_intent
    # The chatbot prints the response that matches the selected intent
    print (responses[key])
The chatbot picked the greeting from the first user input (‘Hi’) and responded according to the matched intent.
The same happened when it located the word (‘time’) in the second user input.
The third user input (‘How can I open a bank account’) didn’t have any keywords that were present in Bankbot’s database so it went to its fallback intent.
You can add multiple keywords/phrases/sentences and intents to build a robust chatbot for human interaction.
Building chatbot in Python – the next step
This blog was a hands-on introduction to building a basic chatbot in Python. We only worked with 2 intents in this tutorial for simplicity. You can easily expand the functionality of this chatbot by adding more keywords, intents, and responses.
Building a rule-based chatbot is a laborious process, especially in a business environment where it requires increased complexity. It makes rule-based chatbots impractical for enterprises due its limited conversational capabilities. AI-based Chatbots are a more practical solution for real-world scenarios.
In the next blog in the series, we’ll learn how to build a simple AI-based Chatbot in Python.
Do you want to learn more about machine learning and its applications? Check out Data Science Dojo’s online data science certificate program!
Learn how to use Chatterbot, the Python library, to build and train AI-based chatbots.
Chatbots have become extremely popular in recent years and their use in the industry has skyrocketed. The chatbot market is projected to grow from $2.6 billion in 2019 to $9.4 billion by 2024. This doesn’t come as a surprise when you look at the immense benefits chatbots bring to businesses. According to a study by IBM, chatbots can reduce customer services cost by up to 30%.
In the third blog of A Beginners Guide to Chatbots, we’ll be taking you through how to build a simple AI-based chatbot with Chatterbot; a Python library for building chatbots.
Chatterbot is a python-based library that makes it easy to build AI-based chatbots. The library uses machine learning to learn from conversation datasets and generate responses to user inputs. The library allows developers to train their chatbot instances with pre-provided language datasets as well as build their datasets.
Training chatterbot
A newly initialized Chatterbot instance starts with no knowledge of how to communicate. To allow it to properly respond to user inputs, the instance needs to be trained to understand how conversations flow. Since conversational chatbot Python relies on machine learning at its backend, it can very easily be taught conversations by providing it with datasets of conversations.
Chatterbot’s training process works by loading example conversations from provided datasets into its database. The bot uses the information to build a knowledge graph of known input statements and their probable responses. This graph is constantly improved and upgraded as the chatbot is used.
The Chatterbot Corpus is an open-source user-built project that contains conversational datasets on a variety of topics in 22 languages. These datasets are perfect for training a chatbot on the nuances of languages – such as all the different ways a user could greet the bot. This means that developers can jump right to training the chatbot on their customer data without having to spend time teaching common greetings.
Chatterbot has built-in functions to download and use datasets from the Chatterbot Corpus for initial training.
Chatterbot logic adapters
Conversational chatbot Python uses Logic Adapters to determine the logic for how a response to a given input statement is selected.
A typical logic adapter designed to return a response to an input statement will use two main steps to do this. The first step involves searching the database for a known statement that matches or closely matches the input statement. Once a match is selected, the second step involves selecting a known response to the selected match. Frequently, there will be several existing statements that are responses to the known match. In such situations, the Logic Adapter will select a response randomly. If more than one Logic Adapter is used, the response with the highest cumulative confidence score from all Logic Adapters will be selected.
Chatterbot stores its knowledge graph and user conversation data in an SQLite database. Developers can interface with this database using Chatterbot’s Storage Adapters.
Storage Adapters allow developers to change the default database from SQLite to MongoDB or any other database supported by the SQLAlchemy ORM. Developers can also use these Adapters to add, remove, search, and modify user statements and responses in the Knowledge Graph as well as create, modify and query other databases that Chatterbot might use.
Building an AI-based chatbot
In this tutorial, we will be using the Chatterbot Python library to build an AI-based Chatbot.
We will be following the steps below to build our chatbot
Importing Dependencies
Instantiating a ChatBot Instance
Training on Chatbot-Corpus Data
Training on Custom Data
Building a front end
Importing dependencies
The first thing we’ll need to do is import the modules we’ll be using. The ChatBot module contains the fundamental Chatbot class that will be used to instantiate our chatbot object. The ListTrainer module allows us to train our chatbot on a custom list of statements that we will define. The ChatterBotCorpusTrainer module contains code to download and train our chatbot on datasets part of the ChatterBot Corpus Project.
#Importing modules
from chatterbot import ChatBot
from chatterbot.trainers import ListTrainer
from chatterbot.trainers import ChatterBotCorpusTrainer
Instantiating chatbots instance
A chatbot instance can be created by creating a Chatbot object. The Chatbot object needs to have the name of the chatbot and must reference any logic or storage adapters you might want to use.
In the case you don’t want your chatbot to learn from user inputs after it has been trained, you can set the read-only parameter to True.
Training your chatbot agent on data from the Chatterbot-Corpus project is relatively simple. To do that, you need to instantiate a ChatterBotCorpusTrainer object and call the train() method. The ChatterBotCorpusTrainer takes in the name of your ChatBot object as an argument. The train() method takes in the name of the dataset you want to use for training as an argument.
You can also train ChatterBot on custom conversations. This can be done by using the module’s ListTrainer class.
In this case, you will need to pass in a list of statements where the order of each statement is based on its placement in a given conversation. Each statement in the list is a possible response to its predecessor in the list.
The training can be undertaken by instantiating a ListTrainer object and calling the train() method. It is important to note that the train() method must be individually called for each list to be used.
greet_conversation = [
    "Hello",
    "Hi there!",
    "How are you doing?",
    "I'm doing great.",
    "That is good to hear",
    "Thank you.",
    "You're welcome."
]
open_timings_conversation = [
    "What time does the Bank open?",
    "The Bank opens at 9AM",
]
close_timings_conversation = [
    "What time does the Bank close?",
    "The Bank closes at 5PM",
]
#Initializing Trainer Object
trainer = ListTrainer(BankBot)

#Training BankBot
trainer.train(greet_conversation)
trainer.train(open_timings_conversation)
trainer.train(close_timings_conversation)
Building a front end
Once the chatbot has been trained, it can be used by calling Chatterbot’s get response() method. The method takes a user string as an input and returns a response string.
while (True):
    user_input = input()
    if (user_input == 'quit'):
        break
    response = BankBot.get_response(user_input)
    print (response)
Conclusion
This blog was hands-on to building a simple AI-based chatbot in Python. The functionality of this bot can easily be increased by adding more training examples. You could, for example, add more lists of custom responses related to your application.
As we saw, building an AI-based chatbot is easy compared to building and maintaining a Rule-based Chatbot. Despite this ease, chatbots such as this are very prone to mistakes and usually give robotic responses because of a lack of good training data.
A better way of building robust AI-based Chatbots is to use Conversational AI Tools offered by companies like Google and Amazon. These tools are based on complex machine learning models with AI that has been trained on millions of datasets. This makes them extremely intelligent and, in most cases, are almost indistinguishable from human operators.
In the next blog to learn data science, we’ll be looking at how to create a Dialog Flow Chatbot using Google’s Conversational AI Platform.
Want to upgrade your Python abilities? Check out Data Science Dojo’s Introduction to Python for Data Science.
High dimensional data is a necessary skill for every data scientist to have. Break the curse of dimensionality with Python.
What’s common in most of us is that we are used to seeing and interpreting things in two or three dimensions to the extent that the thought of thinking visually about the higher dimensions seems intimidating. However, you can get a grasp of the core intuition and ideas behind the enormous world of dimensions.
Let’s focus on the essence of dimensionality reduction. Many data science tasks often demand that we work with higher dimensions in the data. In terms of machine learning models, we often tend to add several features to catch salient features even though they won’t provide us with any significant amount of new information. Using these redundant features, the performance of the model will deteriorate after a while. This phenomenon is often referred to as “the curse of dimensionality”.
The curse of high dimensionality
When we keep adding features without increasing the data used to train the model, the dimensions of the feature space become sparse since the average distance between the points increases in high dimensional space. Due to this sparsity, it becomes much easier to find a convenient and perfect, but not so optimum, solution for the machine learning model. Consequently, the model doesn’t generalize well, making the predictions unreliable. You may also know it as “overfitting”. It is necessary to reduce the number of features considerably to boost the model’s performance and to arrive at an optimal solution for the model.
What if I tell you that fortunately for us, in most real-life problems, it is often possible to reduce the dimensions in our data, without losing too much of the information the data is trying to communicate? Sounds perfect, right?
Now let’s suppose that we want to get an idea about how some high-dimensional data is arranged. The question is, would there be a way to know the underlying structure of the data? A simple approach would be to find a transformation. This means each of the high-dimensional objects is going to be represented by a point on a plot or space, where similar objects are going to be represented by nearby points and dissimilar objects are going to be represented by distant points.
Figure 1: Transformation from High Dimensional Space to Low Dimensional Space
Figure 2: Transformation from High Dimensional Space to Low Dimensional Space
Figure 1 illustrates a bunch of high-dimensional data points we are trying to embed in a two-dimensional space. The goal is to find a transformation such that the distances in the low dimensional map reflect the similarities (or dissimilarities) in the original high dimensional data. Can this be done? Let’s find out.
As we can see from Figure 2, after a transformation is applied, this criterion isn’t fulfilled because the distances between the points in the low dimensional map are non-identical to the points in the high dimensional map. The goal is to ensure that these distances are preserved. Keep this idea in mind since we are going to come back on this later!
Now we will break down the broad idea of dimensionality reduction into two branches – Matrix Factorizationand Neighbor Graphs. Both cover a broad range of techniques. Let’s look at the core of Matrix Factorization.
Figure 3: Matrix Factorization
Matrix factorization
The goal of matrix factorization is to express a matrix as approximately a product of two smaller matrices. Matrix A represents the data where each row is a sample and each column, a feature. We want to factor this into a low dimensional interpretation UU, multiplied by some exemplars VV, which are used to reconstruct the original data. A single sample of your data can be represented as one row of your interpretation UiUi, which acts upon the entire matrix of the exemplars VV. Therefore, each individual row of matrix A can be represented as a linear combination of these exemplars and the coefficients of that linear combination are your low dimensional representation. This is matrix factorization in a nutshell.
You might have noticed the approximation sign in Figure 3 and while reading the above explanation you might have wondered why are we using the approximation sign here? If a bigger matrix can be broken down into two smaller matrices, then shouldn’t they both be equal? Let’s figure that out!
In reality, we cannot decompose matrix AA such that it’s exactly equal to U⋅VU⋅V. But what we would like to do is to break down a matrix such that U⋅VU⋅V is as close as possible to AA when reconstructed using the representation UU and exemplars VV. When we talk about approximation, we are trying to introduce the notion of optimization. This means that we’re going to try and minimize some form of error, which is between our original data AA and the reconstructed data A′A′ subject to some constraints. Variations of these losses and constraints give us different matrix factorization techniques. One such variation brings us to the idea of Principle Component Analysis.
Neighbor graphs:The theme revolves around building a graph using the data and embedding that graph in a low-dimensional space. There are two queries to be answered at this point. How do we build a graph and then how do we embed that graph? Assume there is some data that has some non-linear low dimensional structure to it. A linear approach like PCA will not be able to find it. However, if we somehow draw a graph of the data where each point close to or a k-nearest neighbor of that point is linked with an edge, then there is a fair chance that the graph might be able to uncover the structure that we wanted to find. This technique introduces us to the idea of t-distributed stochastic neighbor embedding.
Now let’s begin the journey to find how these transformations work using the algorithms introduced.
Principal components analysis
Figure 4: Scatter Plot
Let’s follow the logic behind PCA. Figure 4 shows a scatter plot of points in 2D. You can clearly see two different colors. Let’s think about the distribution of the red points. These points must have some mean value ¯xx¯ and a set of characteristic vectors V1V1 and V2V2. What if I tell you that the red points can be represented using only their V1V1 coordinates plus the mean. Basically, we can think of these red points on a line and all you will be given is their position on the line. This is essentially giving out the coordinates for the xx axis while ignoring the yy coordinates since we don’t care by what amount are the points off the line. So we have just reduced the dimensions from 2 to 1.
Going by this example, it doesn’t look like a big deal. But in higher dimensions, this could be a great achievement. Imagine you’ve got something in 20,000-dimensional space. If somehow you are able to find a representation of approximately around 200 dimensions, then that would be a huge reduction.
Now let me explain PCA from a different perspective. Suppose, you wish to differentiate between different food items based on their ingredients. According to you, which variable will be a good choice to differentiate food items? If you choose an ingredient that varies a lot from one food item to another and is not common among different foods, then you will be able to draw a difference quite easily. The task will be much more complex if the chosen variable is consistent across all the food items. Coming back to reality, we don’t usually find such variables which segregate the data perfectly into various classes. Instead, we have the ability to create an entirely new variable through a linear combination of original variables such that the following equation holds:
Y=2×1−3×2+5x3Y=2×1−3×2+5×3
Recall the concept behind linear combination from matrix factorization. This is what PCA essentially does. It finds the best linear combinations of the original variables so that the variance or spread along the new variable is maximum. This new variable YY is known as the principle component. PCA1PCA1 captures the maximum amount of variance within our data, and PCA2PCA2 accounts for the largest remaining variance in our data, and so on. We talked about minimizing the reconstruction error in matrix factorization. Classical PCA employs mean squared error as a loss between the original and reconstructed data.
Figure 5: MNIST Visualization using PCA
Let’s generate a three-dimensional plot for PCA/reduced data using the MNIST-dataset with the help of Hypertools. This is a Python toolbox for gaining geometric insights into high-dimensional data. The dataset consists of 70,000 digits consisting of 10 classes in total. The scatter plot in Figure 5 shows a different color for each digit class. From the plot, we can see that the low dimensional space holds some significant information since a bunch of clusters are visible. One thing to note here is that the colors are assigned to the digits based on the input labels which were provided with the data.
But what if this information wasn’t available? What if we convert the plot into a grayscale image? You’d not be able to make much out of it, right? Maybe on the bottom right, you would see a little bit of high-density structure. But it would basically just be one blob of data. So, the question is can we do better? Is PCA minimizing the right objective function/loss? And if you think about PCA, then basically what it’s doing, it’s mainly concerned with preserving large pairwise distances in the map. It’s trying to maximize variance which is sort of the same as trying to minimize a squared error between distances in the original data and distances on the map. When you are looking at the squared error, you’re mainly concerned with preserving distances that are very large.
Is this what an informative visualization of the low-dimensional space should look like? Definitely not. If you think about the data in terms of a nonlinear manifold (Figure 6), then you would see that in this case, the Euclidean distance between two points on this manifold would not reflect their true similarity quite accurately. The distance between these two points suggests that these two are similar, whereas if you consider the entire structure of the data manifold, then they are very far apart. The key idea is that the PCA doesn’t work so well for visualization because it preserves large pairwise distances which are not reliable. This brings us to our next key concept.
Figure 6: Non-Linear Manifold
t-stochastic Neighboring Embedding (t-SNE)
In a high-dimensional space, the intent is to measure only the local similarities between points, which basically means measuring similarities between the nearby points.
Figure 7: Map from High to Low Dimensional Space
Looking at Figure 7, let’s focus on the yellow data point in the high dimensional space. We are going to center a Gaussian over this point xijxij to measure the density of all the other points under this Gaussian. This gives us a set of probabilities pijpij, which basically measures the similarity between pairs of points ij. This probability distribution describes a pair of points, where the probability of picking any given pair of points is proportional to the similarity. If two points are close together in the original high dimensional, the value for pijpij is going to be large. If two points are dissimilar in space then pijpij is basically going to be infinitesimal.
Let’s now devise a way to use these local similarities to achieve our initial goal of reducing dimensions. We will look at the two/three-dimensional space. This will be our final map after transformation. The yellow point can be represented using yiyi. The same approach will be implemented here as well. We are going to center another kernel over this point yiyi to measure the density of all the other points under this distribution. This gives us a probability qijqij, which measures the similarity of two points in the low dimensional space. The goal is that these probabilities qijqij should reflect the similarities pijpij as effectively as possible. To retain and uncover the underlying structure in the data, all of qijqij should be identical to all of pijpij so that the structure of the transformed data is quite similar to the structure of the data in the original high dimensional space.
To check the similarity between these distributions we use a different measure known as KL divergence.This ensures that if two points are close in the original space, then the algorithm will ensure to place them in the vicinity in the low dimensional space. Conversely, if the two points are far apart in the original space, the algorithm is relatively free to place these points around. We want to lay out these points in the low dimensional space to minimize the distance between these two probability distributions to ensure that the transformed space is a model of the original space. Again, a mathematical algorithm known as gradient descent is applied to KL divergence, which is just moving the points around in space iteratively to find the optimum setting in the low dimensional space so that this KL divergence becomes as small as possible.
The key takeaway here is that the high dimensional space distance is based on a Gaussian distribution, however, we are using a Student-t distribution in the embedded space. This is also known as heavy-tailed Student-t distribution. This is where the t in t-SNE comes from.
This whole explanation boils down to one question: Why this distribution? So let’s suppose we want to project the data down to two dimensions from a 10-dimensional hyper-cube. If we think realistically then we can never preserve all the pairwise distances accurately. We need to compromise and find a middle ground somewhere. t-SNE tried to map similar points close to each other and dissimilar ones far apart.
Figure 8 illustrates this concept, where we have three points in the two-dimensional space. The yellow lines are the small distances that represent the local structure. The distance between the corner of the triangle is a global structure so it is denoted as a large pairwise distance. We want to transform this data into one-dimensional while preserving local structure. Once the transformation is done, you can see that the distance between the two points that are far apart has grown. Using the heavy tail distribution, we are allowing this phenomenon to happen. If we have two points that have a pairwise distance of let’s say 20, and using a Gaussian gives a density of 2, then to get the same density under the student t-distribution, because of the heavy tails, these points have to be 30 or 40 apart. So for dissimilar points, the heavy-tailed qijqij basically allows dissimilar points to be modeled far apart in the map than they were in the original space.
Figure 8: Three points in two-dimensional space
Let’s try to run the algorithm using the same dataset. I have used Dash to build a t-SNE visualization. Dash is a productive Python framework for building data visualization apps. This can be rendered in the web browser. A great thing is that you can hover over a data point to check from which class it belongs to. Isn’t that amazing? All you need to do is to input your data in CSV format and it does the magic for you.
So, what you see here is t-SNE running gradient descent, doing the learning while calculating KL divergence. There is much more structure than there is in the PCA plot. You can see that the 10 different digits are well separated in the low-dimensional map. You can vary the parameters and monitor how the learning varies. You may want to read this great article distilling how to interpret the results of t-SNE. Remember, the labels of the digits were not used to generate this embedding. The labels are only used for the purpose of coloring the plot. t-SNE is a completely unsupervised algorithm. This is a huge improvement over PCA because if we didn’t even have the labels and colors then we would still be able to separate out the clusters.
Figure 9: MNIST visualization using t-SNE
Autoencoders
Figure 10: Architecture of an auto-encoder
The word ‘auto-encoder‘ has been floating around for a while now. Auto-encoder may sound like a cryptic name at first but it’s not. It is basically a computational model whose aim is to learn a representation or encoding for some sort of data. Fortunately for us, this encoding can be used for the task of dimensionality reduction.
To explain the working of auto-encoders in the simplest terms, let’s look back at what PCA was trying to do. All PCA does is that it finds a new coordinate system for your data such that it aligns with the orientation of maximum variability in the data. This is a linear transformation since we are simply rotating the axis to end up in a new coordinate system. One variant of an auto-encoder can be used to generalize this linear dimension reduction.
How does it do that?
As you can see in Figure 10, there are a bunch of hidden units where the input data is passing. The input and output units of an auto-encoder are identical since the idea is to learn an un-supervised compression of our data using the input. The latent space contains a compressed representation of the image, which is the only information the decoder is allowed to use to try to reconstruct the input. If these units and the output layers are linear then the auto-encoder will learn a linear function of the data and try to minimize the squared reconstruction error.
That’s what PCA was doing, right? In terms of principle components, the first N hidden units will represent the same space as the first N components found by PCA, which accounts for the maximum variance. In terms of learning, auto-encoders go beyond this. They can be used to learn complex non-linear manifolds, as well as uncover the underlying structure of data.
In the PCA projection (Figure 11), you can see that’s how the clusters are merged for the digits 5, 3, and 8 and that’s sole because they are all made up of similar pixels. This visualization is as a result of capturing a 19.8% variance in the original data set only.
Coming towards t-SNE, now we can hope that it will give us a much more fascinating projection of the latent space. The projection shows denser clusters. This shows that in the latent space, the same digits are close to one another. We can see that the digits 5, 3, and 8 are now much easier to separate and appear in small clusters as the axis rotates.
These embeddings on the raw mnist input images have enabled us to visualize what the encoder has managed to encode in its compressed layer representation. Brilliant!
Figure 11: PCA visualization of the Latent Space
Figure 12: t-SNE visualization of the Latent Space
Explore
Phew, so many techniques! Well, there are a bunch of other techniques that we have not discussed here. It will be very difficult to identify an algorithm that always works better than all the rest. The superiority of one algorithm over another depends on the context and the problem we are trying to solve. What is common in all these algorithms is that the algorithms try to preserve some properties and sacrifice some other, in order to achieve some specific goal. You should dive deep and explore these algorithms for yourself! There is always a possibility that you can discover a new perspective that works well for you.
In the famous words of Mick Jagger, “You can’t always get what you want, but if you try sometimes, you just might find you get what you need.”
Data Science is a hot topic in the job market these days. What are some of the best places for Data Scientists and Engineers to work in?
To be honest, there has never been a better time than today to learn data science. The job landscape is quite promising, opportunities span multiple industries, and the nature of the job often allows for remote work flexibility and even self-employment. The following post emphasizes the top cities across the globe with the highest pay packages for data scientists.
Industries across the globe keep diversifying on a constant basis. With technology reaching new heights and a majority of the population having unlimited access to an internet connection, there is no denying the fact that big data and data analytics have started gaining momentum over the years.
Demand for data analytics professionals currently outweighs supply, meaning that companies are willing to pay a premium to fill their open job positions. Further below, I would like to mention certain skills required for a job in data analytics.
Python
Being one of the most used programming languages, Python has a solid understanding of how it can be used for data analytics. Even if it’s not a required skill, knowledge and understanding of Python will give you an upper hand when showing future employers the value that you can bring to their companies. Just make sure you learn how to manipulate and analyze data, understand the concept of web scraping and data collection, and start building web applications.
SQL (Structured Query Language)
Like Python, SQL is a relatively easy language to start learning. Even if you are just getting started, a little SQL experience goes a long way. This will give you the confidence to navigate large databases, and obtain and work with the data you need for your projects. You can always seek out opportunities to continue learning once you get your first job.
Data visualization
Regardless of the career path, you are looking into, it is crucial to visualize and communicate insights related to your company’s services, and is a valuable skill set that will capture the attention of employers. Data scientists are a bit like data translators for other people who exactly know what conclusions to draw from their datasets.
Best opportunities for a data scientist
Have a look at cities across the globe that offer the best opportunities for the position of a data scientist. The order of the cities does not represent any type of rank.
Average Salary of a Data Scientist in US Dollars
San Jose, California – Have you ever dreamed about working in Silicon Valley? Who hasn’t? It’s the dream destination of any tech enthusiast and an emerging hot spot for data scientists all across the globe. Being an international headquarters and main offices of the majority of American tech corporations, it offers a plethora of job opportunities and high pay. It may interest you to know that the average salary of a chief data scientist is estimated to be $132,355 per year.
Bengaluru, India – Second city on the list is Bengaluru, India. The analytics market is touted to be the best in the country, with the state government, analytics startups, and tech giants contributing substantially to the overall development of the sector. The average salary is estimated to be ₹ 12 lakh per annum ($17,240.40).
Berlin, Germany – If we look at other European countries, Germany is home to some of the finest automakers and manufacturers. Although, the country isn’t much explored for newer and better opportunities in the field of data science, it seems to be expanding its portfolio day in and day out. If you are a data scientist, you may earn around €11,000, but if you are a chief data scientist, you will not be earning less than €114,155.
Geneva, Switzerland – If you are seeking one of the highest paying cities in this beautiful paradise; it is Geneva. Call yourself fortunate, if you happen to land a position as a data scientist. The mean salary of a researcher starts at 180,000 Swiss Fr, and a chief data scientist can earn as much as 200,000 Swiss Fr with an average bonus ranging between 9,650-18,000 Swiss Fr.
London, United Kingdom – One of the top destinations in Europe that offers high-paying and reputable jobs in London. UK government seems to rely on technologies day in and day out, due to which the number of opportunities in the field has gone up substantially, with the average salary of a Data Scientist being £61,543.
I also included the average data scientist salaries from the 20 largest cities around the world in 2019:
Both Java and Python have their pros and cons when it comes to Android app development. Find out which one is the best for you.
Few things can be so divisive among developers as their choice of programming languages. Developers will promote one over the other, often touting their chosen language’s purity, speed, elegance, efficiency, power, portability, compatibility, or any number of other features.
Android app developers are no exception, with many developers divided between using Java or Python to develop their applications. Let’s look at these two languages and see which is best for Android app developers.
Java
Java Programming
Originally released in 1995, Java is one of the cornerstone languages of modern programming and continues to be one of the most popular programming languages in the world. Java was designed on the “write once, run anywhere” principle, as compiled Java apps are designed to run on a Java virtual machine (JVM). Any computer, device, or platform with a JVM installed should be able to run a Java app without it being altered or recompiled. In addition, Java is a true object-oriented programming language, with many modern features.
Because of these features, Google used Java as the core basis of Android when it began development. As a result, to this day, Java remains the primary way to create true “native” Android apps. Apps written in Java tend to have the fastest performance, tightest integration, and easier access to underlying features and APIs.
Despite these advantages, Java is not an easy language for many developers to pick up, especially those coming from a career in web development.
Python
Python Programming
First released in 1991, Python predates Java by a few years, yet continues to be a force to be reckoned with in the development world. Unlike Java—or other languages such as C, Objective-C, or Swift—Python is an interpreted language, rather than a compiled one. In other words, rather than compiling the completed code into machine-language instructions, Python code is executed by a Python interpreter on the fly.
Python has long had a reputation for being a simple, elegant language. Whereas other languages emphasize many ways to accomplish a goal, Python’s philosophy is that there should be a single, superior way to do it. This, in turn, gives Python a much easier learning curve for new developers.
Because of its interpreted nature, Android does not natively support Python apps. However, there are several frameworks available that allow Python apps to be interpreted and run on Android, even giving them a native look and feel. Despite this, because it is not the native development environment, Python apps do not always have the same level of system access as their Java counterparts. In addition, as a general rule, Python apps tend to have slower performance, although this is increasingly mitigated by faster hardware.
Despite these disadvantages, Python appeals to many developers who are already proficient with it or are coming from a web development background. Because Python is an interpreted language, this gives Python apps an even greater degree of portability than Java, especially since some platforms—such as macOS—no longer install a JVM by default.
Java or Python – which language to choose?
The fact of the matter is, that both Java and Python have pros and cons. Java is the native language of Android and enjoys the associated benefits. Python is an easier language to learn and work with, and is more portable, but gives up some performance compared to Java.
At the end of the day, each tool has its place depending on what you are trying to accomplish and what your background is as an Android app developer. If you’re not sure about how to create an Android app that will meet your expectations, you may need to seek out expert advice from people who’ve worked on similar projects before.
Want to learn more about Python? Take a look at these Python tutorials.
GitHub repositories are great for finding new solutions and keeping up with open source projects. Take a look at some of the most popular repositories.
If you didn’t watch the video because you’re in a public setting and don’t have headphones, the video essentially says GitHub is an open source software development community for teams of and individual developers to work on projects. GitHub gives you a platform to copy projects, track changes, and so much more.
What brings me to share the trending GitHub repositories for this month, and the months to come, are the ideas a community of people has. Like the introduction video says, an idea/implementation for one product can bring up new solutions for another. We should always be aware of products and solutions in the community because they might help us in the future.
This project allows you to watch IPTV (Internal Protocol Television) channels from around the world. There are currently a collection of 8,000+ channels available to the public.
2) bloc97/ Anime4K
Anime4K is used as a “real-time upscaling for anime video”. It’s completely open-sourced, and far from perfect. Currently, it claims to be the “fastest at achieving reasonable quality” for your anime 4K upscaling. The project is looking at taking a hybrid approach with machine learning to improve results.
3) axi0mX/ ipwndfu
IPWNDFU is a jail-breaking tool for many iOS devices. “Jail-breaking” is the term used when someone wants to free their device (typically mobile) of restrictions given by the operator or manufacturer. It allows the user to download software previously unauthorized. This project is BETA software so you will need to be careful if you use it.
4) vlang/ v
Version 1.0 of the V Programming Language hasn’t been released yet, but I imagine it will be a popular repository to follow for the next few months. Expected in December 2019, V is a simple language for developing maintainable software. The language can reportedly compile itself in less than 1 second with zero dependencies.
5) geek computer/ Python
The Python project is a list of Python examples created by the project managers to share their experience with the programming language. If you want to advance your skills with Python, take a look at this repository.
6) TheAlgorithms/ Java
TheAlgorithms makes open source resources for learning data structures and algorithms with their implementation in any programming language. Java is their project for implementing all algorithms in Java.
“Home Assistant is a home automation platform running on Python 3. It can track and control all devices at home and offer a platform for automating control.”
8) robbyrussell/ oh-my-zsh
Zsh is a powerful scripting tool to help make you feel like a 10x developer. In this community of 1300+ contributors, you can have a framework for managing your zsh configuration.
9) mitesh77/ Best-Flutter-UI-Templates
Flutter Dart is an open-source software used to develop applications. In this instance, it’s being used to make available templates to build your app.
10) gatsbyjs/ gatsby
Like Flutter, Gatsby is used to helping developers “build blazing fast websites and apps”. Gatsby allows you to create dynamic pages, pull data from just about any data source, and automates many activities such as lazy-loading, image optimization, and inlining critical styles.
Given the impact of ML models on society and the economy, ML professionals need to understand their social responsibility to communicate insights about covid-19.
COVID-19-related data sources are fairly easy to find. Libraries in R and Python make it super easy to come up with pretty visualizations, models, forecasts, insights, and recommendations. I have seen recommendations in areas like economics, public policy, and healthcare policy from individuals who apparently have no background in any of these fields. All of us have seen these ‘data-driven’ insights.
Some close friends have asked if I have been analyzing the COVID-19 datasets.
Yes, I have been looking at these datasets. However, my analysis has been just out of curiosity and not with the intent of publishing my forecast or recommendations. I am not planning to make any of my analyses on the COVID-19 dataset public because I sincerely believe that I am not qualified to do so.
Allow me to digress a bit. I promise that I will come back and connect the dots.
Pittsburgh, 1995: Two men rob a bank in broad daylight without wearing a mask or disguise of any sort – even smiling at surveillance cameras on their way out. Later that night, police arrests one of the robbers. The man and his accomplice believed that rubbing lemon juice on their skin would render them invisible to surveillance cameras, as long as they do not go close to a heat source. One might think that it was mental health or high on drugs case. It was, however, not the case. It was a case of inflated self-assessment of competence.
Motivated by the Pittsburgh robbery, Kruger and Dunning at Cornell University decided to conduct a study of how people mistakenly hold favorable views of their abilities and skills. The study was eventually published in 1999 as ‘Unskilled and Unaware of It: How Difficulties in Recognizing One’s Own Incompetence Lead to Inflated Self-Assessments’.
Dunning-Kruger effect is a cognitive bias that leads to inflated self-assessments. People who are less experienced (less skilled, less competent, or less self-aware) not only make mistakes but also fail to realize their mistakes. On the other hand, experts(people with more knowledge and experience) tend to be more self-critical and aware of their shortcomings.
Data Science Dojo Dunning Kruger Effect
The power of modern machine learning libraries is amazing. Within a few lines of code, one can get amazing visualizations or models without having to worry about the complexities of implementation. I call these libraries a blessing and a curse at the same time. A blessing to those who are either knowledgeable or ‘know what they don’t know and a curse to those who ‘don’t know that they don’t know. During our Data Science and Data Engineering Bootcamp – about halfway into the Bootcamp, our trainees reach the peak of their confidence. Why shouldn’t they? With all the powerful R and Python libraries and toy data sets anyone would think that way. Most of them are amazed at how easy data science, AI and machine learning is.
About two-thirds into the Bootcamp, when asked to improve the models by using more feature engineering and parameter tuning, the recently acquired confidence starts tapering off. One of the frustrated attendees once exclaimed, and I quote here:
‘How is this machine learning? Why do I have to do all the feature engineering, data cleaning, and parameter tuning myself? Why can’t we automate this?’
It is time to discuss the Dunning-Kruger effect in class. (This has always been taken in good humor, except when one attendee actually got offended by the ‘peak of mount stupid’ (I have not stopped giving this example). I tell them that data science and machine learning are much more than just libraries, techniques, and tools. Domain knowledge and context of the problem are critical. Garbage in, garbage out. Let me end the digression now.
With the COVID-19 outbreak, a lot of people have started sharing their work on available data sources. I love the creativity and effort put into the work. I have seen cool visualizations in every possible tool available. I have seen models, including forecasts on how many cases will emerge in a country the next day/week/month. In most cases, I find these insights and conclusions, not just disturbing, but also downright irresponsible.
Domain knowledge and context of the problem is a necessary conditions for solving difficult modeling problems. If you are not familiar with at least the basic principles of epidemiology, economics, public policy, and healthcare policy, please stop drawing conclusions that mislead and scare – or for that matter give a false sense of comfort to people.
Next time you decide to share any insights and make recommendations on economic, public, or healthcare policy in response to the COVID-19 outbreak, ask yourself these questions:
Do you understand that machine learning is about correlations (inference) whereas policy recommendations are about causal inference?
Do you think that publicly available data sources even contain any signal for what you are trying to predict?
Are you familiar with the ideas of bias and variance? I mean practically, not just mathematically.
Are you aware of something called a ‘confounding variable’?
Does population density impact the spread of the virus?
Have you considered the GDP, HDI, and other economic indicators in your model?
Do social norms influence the spread of disease? For instance, all cultures greet in their own unique way. Bowing, kissing one’s cheek, hugging, shaking hands, or just nodding are some of the ways people from different cultures greet each other.
China and Singapore did an amazing job at containing COVID-19 by locking down. Can a western democracy impose a lockdown similar to China and Singapore?
Singapore recently introduced fines for one’s inability to maintain social distance. How many other countries would this work in?
If you lived from paycheck to paycheck or possibly work on daily wages, would your conclusions be the same? Do you think that a government has to worry about its citizens who have months worth of savings in their bank accounts and those who live paycheck to paycheck? What would you do if you were the policy maker?
Put a small business owner and an expert in infectious diseases in the same room. Will they agree on what is the right course of action? Lockdown or not?
If we put a few experts in epidemiology, economics, healthcare policy, public policy, and psychology in the same room, will they agree on what measures should be taken?
Exploratory analysis and cool visualizations are great. I have actually enjoyed some analyses (shared as reports and not as forecasts) that caught my attention. However, when it comes to COVID-19 predictions, forecasts and conclusions, please understand that our models impact lives, society, and the economy. Know your social responsibility when you convincingly tell others that the number of infections in certain countries will double (triple or quadruple) tomorrow.
If you are that good, more power to you. I, for one, will not share any forecasts or public policy recommendations on the COVID-19 outbreak. I accept that there are certain things I do not completely understand and it is completely fine with me.
Over the years, the popularity of different programming languages has been increasing. This blog lists down some of the top & most useful programming languages for you to learn.
The use of programming languages remains a popular way of earning money and the main tool for creating modern technologies. Even if you start studying some of these programming languages right now, you can be sure of high wages and rapid career growth.
The more programming languages you know and use, the higher your status will be. For the development of one application/technology, several of them can be used at once. Since the inception of the first computers, more than 8,000 programming languages have been invented. There are basic ones that are used everywhere. It is impossible to single out the best one, each has advantages and disadvantages.
Below is the list to get you acquainted with the best programming languages and find out which one to start with:
Python
Python is a simple programming language that is suitable for beginners and will be a relatively easy way to get into a new profession. A clear code, a large library of tools, and a minimum of tricks allow you to quickly get the hang of it, making the language the most popular in education and also helping you to learn data science. Although learning Python for Data Science is not an easy task, there is a lot of training out there that can help one get started. It is not for nothing called “language with batteries included”, it itself provides methods for solving basic problems. It is easy to integrate with C and C ++ languages.
Python’s performance is inferior to other languages, but because of this, it does not lose its relevance. Scientists all over the world use it for machine learning. Plus, it’s ideal for web services; backend, and sysadmin.
C & C++
The C language appeared in 1975, and its more multifaceted extension C ++, in 1985. They are the progenitors of most programming languages. Every 3 years the C ++ language is updated, and today there is already the 20th ISO standard. Initially, the C language was developed for less powerful computers, was economical, and more tied to the hardware. This binding remains today, which allows you to “squeeze” the maximum out of productivity. Now the language is used both for game development and for machines with a low-power processor.
These complex languages are not the most fun places to learn programming. When studying, you can quickly burn out and say goodbye to the profession. However, it is C ++ that will help to fully probe the “brain” of the computer, which is extremely important for the programmer. This hard start is suitable for those who want to understand the basics. C ++ does not support validation at the time of writing the code, which also complicates the development work.
That is why these specialists are in great demand.
.NET
.NET is a framework from Microsoft that allows you to use the same namespaces, libraries, and APIs for different languages. .NET supports several languages: along with C#, it also includes VB.NET, C ++, F #, as well as various dialects of other languages tied to .NET.
.NET is fairly widespread in the development of in-house software products, but it is still relatively rare in web development, like other software products from Microsoft. Therefore, finding .NET developers for a web project can be quite difficult. The use of .NET usually “pulls” the purchase of other software from Microsoft. However, if you are looking for a promising direction, this is a great option.
JavaScript
Created in 1995, JavaScript is the dominant frontend language around the world. Its relevance is not lost even for a minute, it can be used to create interactive websites. It is also easy to learn, but today it is not enough for development, and the number and quality of frameworks can become difficult. That is why you should not start with it, because constant retraining for the changing frontend, by virtue of already active programmers.
Thanks to a large number of add-ons, the functionality of JavaScript is limitless. The main disadvantage is that due to the fact that the language is used to encode pop-ups, we often have to deal with malicious content.
Java
Java was also introduced in 1995 but has nothing to do with JavaScript. It is in demand in the backend and occupies a good position in it. Death is predicted for the language every year, but it seems that this will not happen soon. Behind the “boring and verbose” structure, many find the perfect solution to many problems. For example, it is used by banking structures to write mobile applications for large companies.
The main advantage is that the developed application will run on any platform that supports Java due to the weak link system. That is, after the initial creation, there is no need to modify the application specifically for each server.
The disadvantages of the language include additional payment for the licensed version of the Java Development Kit, and it is not suitable for applications in the cloud.
Learning Java first is not worth it, it is the perfect complement to other more fundamental languages.
Swift
Created by Apple in 2014, Swift has grown exponentially in popularity. The creators positioned it as a replacement for Objective-C and the beginning of a “new era” of programming. But so far it is in demand for only iOS applications.
The language is perfectly adapted for both custom and server-side development. The syntax is easy to read and the code runs quickly.
It’s only worth learning if you’re going to develop apps for Apple products.
But even for iOS, it does not always work. Since the language is new, it is used to write applications for at least the seventh generation of iOS. In addition, Swift still has many shortcomings, it is unstable and has a small number of third-party resources to work with.
Conclusion
A number of programmers build their careers with professional knowledge in only one programming language, but they are more proficient in several of them at once, which significantly increases their chances of succeeding in their careers. It is difficult to say which of them should be studied. For example, if you want to work in a large company, it is better to learn C and Java, Python and JavaScript are suitable for participation in web startups, and for iOS mobile applications, it is enough to have knowledge of Swift.
This blog covers the 6 famous Python libraries for data science that are easy to use, have extensive documentation, and can perform computations faster.
Top 6 Python Libraries for Data Science
Data scientist is the sexiest job of the 21st century, but what is a data scientist without data? Harvard Business Review labels data as the new oil. There is a massive dearth of people qualified for data-related jobs. As a beginner, you can be tempted to wet your feet in the ever-evolving field of data science.
However, Python is a programming language that can be easily learned. Sometimes, your pseudocode can directly be converted into Python code.
Python is increasingly used in data science-related tasks and is becoming the de-facto standard because it is easy to learn, easy to debug, has a rich userbase, is object-oriented, and is easy to interpret. However, you can get lost in the intricacies and subtleties of the many available specialized packages.
Fret not, because we have you covered!
You might be tempted to learn about many of these libraries, but there are some libraries that are frequently used in the domain of data science given their versatility and ease of use.
PRO TIP: Join our Python for data science course today to enhance your data science skillset!
In this blog, we will be going over the 6 most commonly used python libraries for data science:
NumPy
Python for Data Science Cheat Sheet
Be it the creation of vectors and arrays, performing some matrix multiplication, or performing singular value decomposition, NumPy is a linear algebra-based library that provides a vast repertoire of mathematical routines at your disposal. NumPy is a library that deals with vectors, and matrices and offers fast operations. It provides various functions such as array indexing and broadcasting, consumes less memory, and is convenient.
Behind the hood, it uses multiple optimization algorithms to accelerate typically slow operations such as matrix multiplication. The automatic broadcasting takes care of different array sizes and makes life very convenient ultimately making it one of the most famous Python libraries for data science.
Pandas
Pandas for Data Science
Handling complex data, indexing into the data, cleaning and handling null values, merging and joining datasets, Pandas is a python library that is both easy and intuitive. Since it is built on top of NumPy, it can perform tasks that would otherwise take a lot of time. Usually, by using native Python functionality, it becomes tough to iterate over thousands of tuples to perform some pre-processing, but by using Pandas’ wrappers, these tasks can be done in significantly less time.
Moreover, Pandas is widely used for data analysis and looking into the summary statistics, and inferring some patterns from data, which can help answer or validate our assumptions and hypothesis.
SciKit-Learn
SciKit Learning Cheat Sheet
If you want to train complex machine learning models or have an ensemble of different machine learning models with an intuitive and easy-to-use interface, Scikit-learn is your friend. The beauty of Scikit-learn is that it provides a similar interface for every machine learning algorithm, which makes the library very intuitive to use and can easily extend the current learning algorithms by using custom cost functions and optimization algorithms.
The library also offers various optimization algorithms to tune the model’s hyperparameters. Therefore, Scikit-learn stays one of the most popular machine learning libraries for Python.
Keras
Keras – Python for Data Science
Machine learning and deep learning have become immensely popular in recent days due to ever-increasing computing power and that is why you see complicated models being developed, and Keras is a Python library for data science to do that. Keras is a static graph-based machine learning library. One of the distinguishing features is that the computational graph of a network, once formed, will be fixed, and will not be changed on the run-time, which means that the variables will be locked at the run time, making the models very efficient.
Moreover, the Keras application programming interface is highly abstracted, which makes Keras very easy to use once you have a good grasp of Python. It is used to build custom machine learning models and is widely used in the machine learning community for research and deployment purposes.
SciPy
SciPy – Python Cheat Sheet
Testing whether your assumption is valid or not to make a fundamental decision about a product’s life cycle is an important task. As SciPy is written in various low-level languages such as C, C++, and Fortran, the speed gains are tremendous compared to a library written in a high-level language. Moreover, Scipy extends the functionality of NumPy by providing access to structures that can be used to store sparse data in a highly optimized fashion and perform computations on it.
The open-source nature of Scipy allows anyone to look at the source code, find bugs or optimize the numerical algorithms further. Hence, SciPy remains one of the most popular libraries for statistical tasks.
PyTorch
PyTorch – Python Cheat Sheet
PyTorch is a dynamic graph-based machine learning library developed by Facebook to aid in their model development and deployment purposes. The variables, including layers, can be changed during the iterations, making the neural networks easier to debug and providing more flexibility. Moreover, for people having access to GPUs, this library offers a remarkably simple flag to switch between GPU and CPU, which makes the life of programmers extremely easy by making the code portable.