Python is a programming language that has become the backbone of modern AI and machine learning. It provides the perfect mix of simplicity and power, making it the go-to choice for AI research, deep learning, and Generative AI.
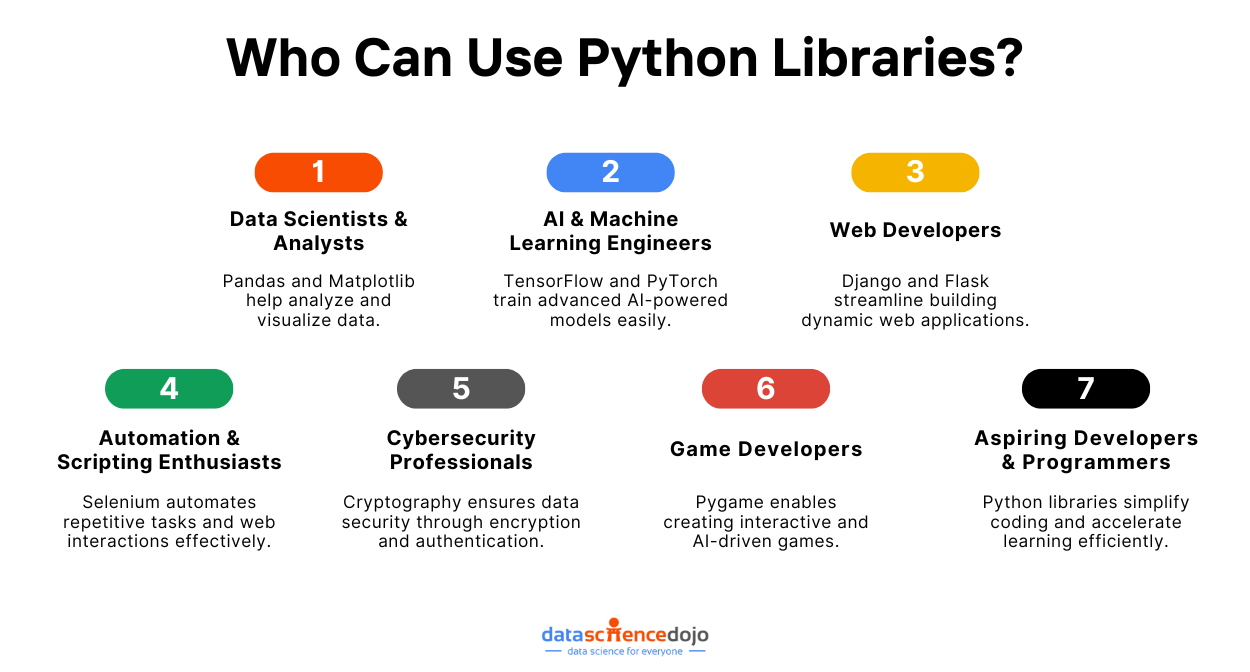
Python plays a crucial role in enabling machines to generate human-like text, create realistic images, compose music, and even design code. From academic researchers and data scientists to creative professionals, anyone looking to harness AI’s potential uses Python to boost their skills and build real-world applications.
But what makes Python so effective for Generative AI?
The answer lies in Python libraries which are specialized toolkits that handle complex AI processes like deep learning, natural language processing, and image generation. Understanding these libraries is key to unlocking the full potential of AI-driven creativity.
In this blog, we’ll explore the top Python libraries for Generative AI, breaking down their features, use cases, and how they can help you build the next big AI-powered creation. Let’s begin with understanding what Python libraries are and why they matter.

What are Python Libraries?
When writing code for a project, it is a great help if you do not have to write every single line of code from scratch. This is made possible by the use of Python libraries.
A Python library is a collection of pre-written code modules that provide specific functionalities, making it easier for developers to implement various features without writing the code all over again. These libraries bundle useful functions, classes, and pre-built algorithms to simplify complex programming tasks.
Whether you are working on machine learning, web development, or automation, Python libraries help you speed up development, reduce errors, and improve efficiency. These libraries are one of the most versatile and widely used programming tools.
Here’s a list of useful Python packages that you must know about
Here’s why they are indispensable for developers:
Code Reusability – Instead of writing repetitive code, you can leverage pre-built functions, saving time and effort.
Simplifies Development – Libraries abstract away low-level operations, so you can focus on higher-level logic rather than reinventing solutions.
Community-Driven & Open-Source – Most Python libraries are backed by large developer communities, ensuring regular updates, bug fixes, and extensive documentation.
Optimized for Performance – Libraries like NumPy and TensorFlow are built with optimized algorithms to handle complex computations efficiently.
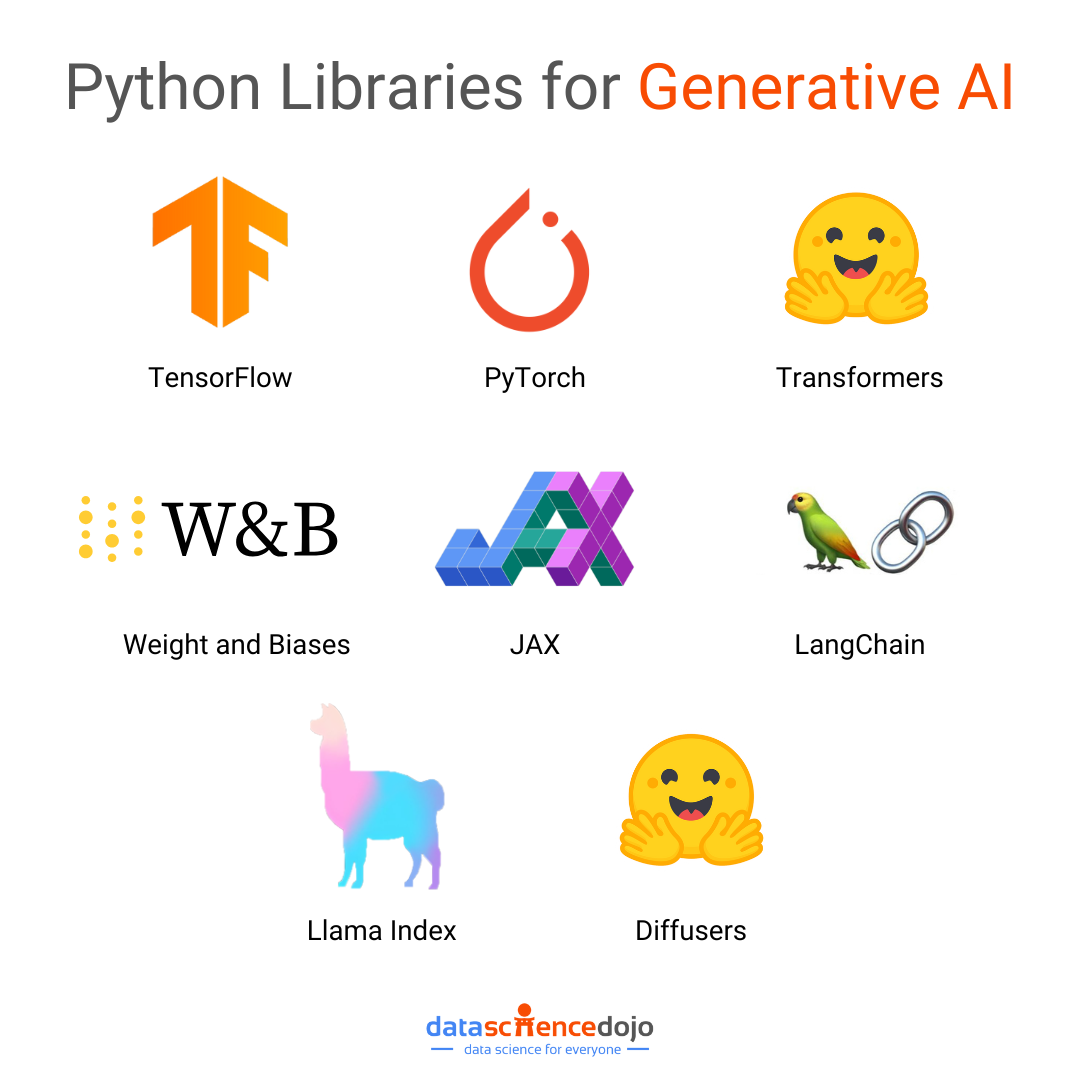
Popular Python Libraries for Generative AI
Python is a popular programming language for generative AI, as it has a wide range of libraries and frameworks available. Here are 10 of the top Python libraries for generative AI:
1. TensorFlow
Developed by Google Brain, TensorFlow is an open-source machine learning (ML) library that makes it easy to build, train, and deploy deep learning models at scale. It simplifies the entire ML pipeline, from data preprocessing to model optimization.
TensorFlow provides robust tools and frameworks for building and training generative models, such as convolutional neural networks (CNNs) and recurrent neural networks (RNNs). It can be used to train and deploy a variety of generative models, such as GANs, autoencoders, diffusion models, and more.
Here’s a list of the types of neural networks
The TensorFlow library provides:
- TensorFlow Hub – A collection of ready-to-use models for quick experimentation.
- Colab Notebooks – A beginner-friendly way to run TensorFlow code in the cloud without installations.
- TensorFlow.js – Bring AI into web applications with JavaScript support.
- TensorFlow Lite – Deploy AI models on mobile devices and edge computing for real-world applications.
- TensorFlow Extended (TFX) – A complete suite for building production-grade AI models, ensuring seamless deployment.
- Keras Integration – Offers an intuitive API that simplifies complex AI model building, making it accessible to beginners and pros alike.
This makes TensorFlow a good choice for generative AI because it is flexible and powerful with a large community of users and contributors. Thus, it remains at the forefront, enabling developers, artists, and innovators to push the boundaries of what AI can create. If you are looking to build the next AI-powered masterpiece, TensorFlow is your ultimate tool.

2. PyTorch
PyTorch is another popular open-source machine learning library that is well-suited for generative AI. It has been developed by Meta AI (Facebook AI Research), becoming a popular tool among researchers, developers, and AI enthusiasts.
What makes PyTorch special?
It combines flexibility, ease of use, and unmatched performance, making it the go-to library for Generative AI applications. Whether you’re training neural networks to create images, synthesize voices, or generate human-like text, PyTorch gives you the tools to innovate without limits.
It is a good choice for beginners and experienced users alike, enabling all to train and deploy a variety of generative models, like conditional GANs, autoregressive models, and diffusion models. Below is a list of features PyTorch offers to make it easier to deploy AI models:
- TorchVision & TorchAudio – Ready-to-use datasets and tools for AI-powered image and audio processing.
- TorchScript for Production – Convert research-grade AI models into optimized versions for real-world deployment.
- Hugging Face Integration – Access pre-trained transformer models for NLP and AI creativity.
- Lightning Fast Prototyping – Rapidly build and test AI models with PyTorch Lightning.
- CUDA Acceleration – Seamless GPU support ensures fast and efficient model training.
- Cloud & Mobile Deployment – Deploy your AI models on cloud platforms, mobile devices, or edge computing systems.
PyTorch is a good choice for generative AI because it is easy to use and has a large community of users and contributors. It empowers developers, artists, and innovators to create futuristic AI applications that redefine creativity and automation.
3. Transformers
Transformers is a Python library by Hugging Face that provides a unified API for training and deploying transformer models. Transformers are a type of neural network architecture that is particularly well-suited for natural language processing tasks, such as text generation and translation.
If you’ve heard of GPT, BERT, T5, or Stable Diffusion, you’ve already encountered the power of transformers. They can be used to train and deploy a variety of generative models, including transformer-based text generation models like GPT-3 and LaMDA.
Instead of training models from scratch (which can take weeks), Transformers lets you use and fine-tune powerful models in minutes. Its key features include:
- Pre-Trained Models – Access 1000+ AI models trained on massive datasets.
- Multi-Modal Capabilities – Works with text, images, audio, and even code generation.
- Easy API Integration – Get AI-powered results with just a few lines of Python.
- Works Across Frameworks – Supports TensorFlow, PyTorch, and JAX.
- Community-Driven Innovation – A thriving community continuously improving the library.
Transformers is a good choice for generative AI because it is easy to use and provides a unified API for training and deploying transformer models. It has democratized Generative AI, making it accessible to anyone with a vision to create.
4. Diffusers
Diffusers is a Python library for diffusion models, which are a type of generative model that can be used to generate images, audio, and other types of data. Developed by Hugging Face, this library provides a seamless way to create stunning visuals using generative AI.
Diffusers provides a variety of pre-trained diffusion models and tools for training and fine-tuning your own models. Such models will excel at generating realistic, high-resolution images, videos, and even music from noise.
Explore the RAG vs Fine-tuning debate
Its key features can be listed as follows:
- Pre-Trained Diffusion Models – Includes Stable Diffusion, Imagen, and DALL·E-style models.
- Text-to-Image Capabilities – Convert simple text prompts into stunning AI-generated visuals.
- Fine-Tuning & Custom Models – Train or adapt models to fit your unique creative vision.
- Supports Image & Video Generation – Expand beyond static images to AI-powered video synthesis.
- Easy API & Cross-Framework Support – Works with PyTorch, TensorFlow, and JAX.
Diffusers is a good choice for generative AI because it is easy to use and provides a variety of pre-trained diffusion models. It is at the core of some of the most exciting AI-powered creative applications today because Diffusers gives you the power to turn ideas into visual masterpieces.
5. Jax
Jax is a high-performance numerical computation library for Python with a focus on machine learning and deep learning research. It is developed by Google AI and has been used to achieve state-of-the-art results in a variety of machine learning tasks, including generative AI.
It is an alternative to NumPy with automatic differentiation, GPU/TPU acceleration, and parallel computing capabilities. Jax brings the power of automatic differentiation and just-in-time (JIT) compilation to Python.
It’s designed to accelerate machine learning, AI research, and scientific computing by leveraging modern hardware like GPUs and TPUs seamlessly. Some key uses of Jax for generative AI include training GANs, diffusion models, and more.
At its core, JAX provides:
- NumPy-like API – A familiar interface for Python developers.
- Automatic Differentiation (Autograd) – Enables gradient-based optimization for deep learning.
- JIT Compilation (via XLA) – Speeds up computations by compiling code to run efficiently on GPUs/TPUs.
- Vectorization (via vmap) – Allows batch processing for large-scale AI training.
- Parallel Execution (via pmap) – Distributes computations across multiple GPUs effortlessly.
In simple terms, JAX makes your AI models faster, more scalable, and highly efficient, unlocking performance levels beyond traditional deep learning frameworks.
Get started with Python, check out our instructor-led Python for Data Science training.
6. LangChain
LangChain is a Python library for chaining multiple generative models together. This can be useful for creating more complex and sophisticated generative applications, such as text-to-image generation or image-to-text generation. It helps developers chain together multiple components—like memory, APIs, and databases—to create more dynamic and interactive AI applications.
This library is a tool for developing applications powered by large language models (LLMs). It acts as a bridge, connecting LLMs like OpenAI’s GPT, Meta’s LLaMA, or Anthropic’s Claude with external data sources, APIs, and complex workflows.
If you’re building chatbots, AI-powered search engines, document processing systems, or any kind of generative AI application, LangChain is your go-to toolkit. Key features of LangChain include:
- Seamless Integration with LLMs – Works with OpenAI, Hugging Face, Cohere, Anthropic, and more.
- Memory for Context Retention – Enables chatbots to remember past conversations.
- Retrieval-Augmented Generation (RAG) – Enhances AI responses by fetching real-time external data.
- Multi-Agent Collaboration – Enables multiple AI agents to work together on tasks.
- Extensive API & Database Support – Connects with Google Search, SQL, NoSQL, vector databases, and more.
- Workflow Orchestration – Helps chain AI-driven processes together for complex automation.
Hence, LangChain supercharges LLMs, making them more context-aware, dynamic, and useful in real-world applications.
Learn all you need to know about what is LangChain
7. LlamaIndex
In the world of Generative AI, one of the biggest challenges is connecting AI models with real-world data sources. LlamaIndex is the bridge that makes this connection seamless, empowering AI to retrieve, process, and generate responses from structured and unstructured data efficiently.
LlamaIndex is a Python library for ingesting and managing private data for machine learning models. It can be used to store and manage your training datasets and trained models in a secure and efficient way. Its key features are:
- Data Indexing & Retrieval – Organizes unstructured data and enables quick, efficient searches.
- Seamless LLM Integration – Works with GPT-4, LLaMA, Claude, and other LLMs.
- Query Engine – Converts user questions into structured queries for accurate results.
- Advanced Embeddings & Vector Search – Uses vector databases to improve search results.
- Multi-Source Data Support – Index data from PDFs, SQL databases, APIs, Notion, Google Drive, and more.
- Hybrid Search & RAG (Retrieval-Augmented Generation) – Enhances AI-generated responses with real-time, contextual data retrieval.
This makes LlamaIndex a game-changer for AI-driven search, retrieval, and automation. If you want to build smarter, context-aware AI applications that truly understand and leverage data, it is your go-to solution.
Read in detail about the LangChain vs LlamaIndex debate
8. Weight and Biases
Weights & Biases is an industry-leading tool for experiment tracking, hyperparameter optimization, model visualization, and collaboration. It integrates seamlessly with popular AI frameworks, making it a must-have for AI researchers, ML engineers, and data scientists.
Think of W&B as the control center for your AI projects, helping you track every experiment, compare results, and refine models efficiently. Below are some key features of W&B:
- Experiment Tracking – Log model parameters, metrics, and outputs automatically.
- Real-Time Visualizations – Monitor losses, accuracy, gradients, and more with interactive dashboards.
- Hyperparameter Tuning – Automate optimization with Sweeps, finding the best configurations effortlessly.
- Dataset Versioning – Keep track of dataset changes for reproducible AI workflows.
- Model Checkpointing & Versioning – Save and compare different versions of your model easily.
- Collaborative AI Development – Share experiment results with your team via cloud-based dashboards.
Hence, if you want to scale your AI projects efficiently, Weights & Biases is a must-have tool. It eliminates the hassle of manual logging, visualization, and experiment tracking, so you can focus on building groundbreaking AI-powered creations.

The Future of Generative AI with Python
Generative AI is more than just a buzzword. It is transforming the way we create, innovate, and solve problems. Whether it is AI-generated art, music composition, or advanced chatbots, Python and its powerful libraries make it all possible.
What’s exciting is that this field is evolving faster than ever. New tools, models, and breakthroughs are constantly pushing the limits of what AI can do.

And the best part?
Most of these advancements are open-source, meaning anyone can experiment, build, and contribute. So, if you’ve ever wanted to dive into AI and create something groundbreaking, now is the perfect time. With Python by your side, the possibilities are endless. The only question is: what will you build next?