Data normalization—sounds technical, right? But at its core, it simply means making data “normal” or well-structured. Now, that might sound a bit vague, so let’s clear things up. But before diving into the details, let’s take a quick step back and understand why normalization even became a thing in the first place.
Think about it—data is everywhere. It powers business decisions, drives AI models, and keeps databases running efficiently. But here’s the problem: raw data is often messy. Duplicates, inconsistencies, and inefficiencies can creep in, making storage and retrieval a nightmare. Without proper organization, databases become bloated, slow, and unreliable.
That’s where data normalization comes in. It’s a structured process that organizes data to reduce redundancy and improve efficiency. Whether you’re working with relational databases, data warehouses, or machine learning pipelines, normalization helps maintain clean, accurate, and optimized datasets.
If you’re still unsure about data normalization, don’t worry—we’ve got you! Just keep reading. In this guide, we’ll break down what data normalization is, why it matters, and how to apply it effectively. By the end, you’ll have a solid grasp of how it enhances data integrity, scalability, and overall performance.

Defining Data Normalization
So, by now, you have a surface-level understanding of data normalization, but it goes beyond just a best practice—it’s the foundation of any data-driven project.
Essentially, data normalization is a database design technique that structures data efficiently. It decomposes relations into well-organized tables while preserving integrity and minimizing redundancy. By maintaining logical connections, data normalization reduces anomalies and optimizes storage for seamless data retrieval.
To put it simply, imagine you’re managing a company’s customer database. Without normalization, you might have repeated customer details across multiple records, leading to inconsistencies when updates are made. Normalization fixes this by breaking the data into related tables, ensuring each piece of information is stored only once and referenced when needed.
From a technical standpoint, normalization follows a set of rules known as normal forms (1NF, 2NF, 3NF, BCNF, etc.). Each form progressively removes redundancies and dependencies, ensuring a structured and optimized database. This is particularly important for relational databases, where data is stored in tables with defined relationships.
Another interesting read: Master EDA
Importance of Data Normalization
So, we defined data normalization, and hopefully, you’ve got the idea. But wait a minute—we said it’s the foundation of any data-driven project. Why is that? Let’s take a closer look.
- Eliminates redundancy: By storing data in a structured format, normalization removes duplicate entries, reducing storage requirements.
- Improves data integrity: Since each data point is stored only once, there’s less risk of inconsistencies or conflicting information.
- Enhances query performance: Well-structured databases make it easier and faster to retrieve information, improving system efficiency.
- Prevents anomalies: Without normalization, inserting, updating, or deleting data can cause errors. Normalization helps avoid these issues.
- Supports scalability: A well-normalized database is easier to expand and maintain as data grows.
So, you see, data normalization is doing a lot of heavy lifting. Without it, even a dataset as wide as an elephant would be useless!
Fundamental Concepts of Data Normalization
We’ve mentioned redundancy and anomalies quite a bit, right? But what do they actually mean? Let’s clear that up.
Data redundancy occurs when the same information is stored in multiple places. This not only wastes storage but also creates inconsistencies. Imagine updating a customer’s phone number in one record but forgetting to update it elsewhere—that’s redundancy in action.
Data anomalies are inconsistencies that arise due to redundancy. There are three main types:
- Insertion anomalies – Occur when adding new data requires unnecessary, duplicate information.
- Update anomalies – Happen when updating a record in one place but leaving outdated data elsewhere.
- Deletion anomalies – When removing a piece of data unintentionally deletes other critical information.
By structuring data correctly, data normalization eliminates these risks, making databases more accurate, efficient, and scalable.

Key Objectives of Data Normalization
Data normalization isn’t just about cleaning up data—it’s about designing a database that works smarter, not harder. Here’s what it aims to achieve:
- Maintain Logical Data Grouping: Instead of dumping all information into a single table, normalization categorizes data into meaningful groups, making it easier to manage and analyze.
- Enable Seamless Data Modifications: A well-normalized structure allows for effortless data updates without affecting unrelated records or requiring mass changes.
- Ensure Compatibility Across Systems: Normalized databases follow standardized structures, making them easier to integrate with different applications and platforms.
- Enhance Decision-Making Processes: With accurate and well-organized data, businesses can generate more reliable reports and insights.
- Reduce Data Duplication Overhead: Lower redundancy means databases require less storage space, improving cost efficiency for large-scale systems.
By following these principles, normalization transforms raw, cluttered data into a streamlined system that is accurate, adaptable, and easy to maintain.
If all the theory feels overwhelming, don’t worry—the fun part is here! Let’s dive into a step-by-step basic tutorial on data normalization.
How to Normalize Data?
As promised, here’s a break from the theory! Now, let’s see data normalization in action.
Whether you’re working with a spreadsheet or a database, the process remains the same. Follow this step-by-step guide to normalize data like a pro.
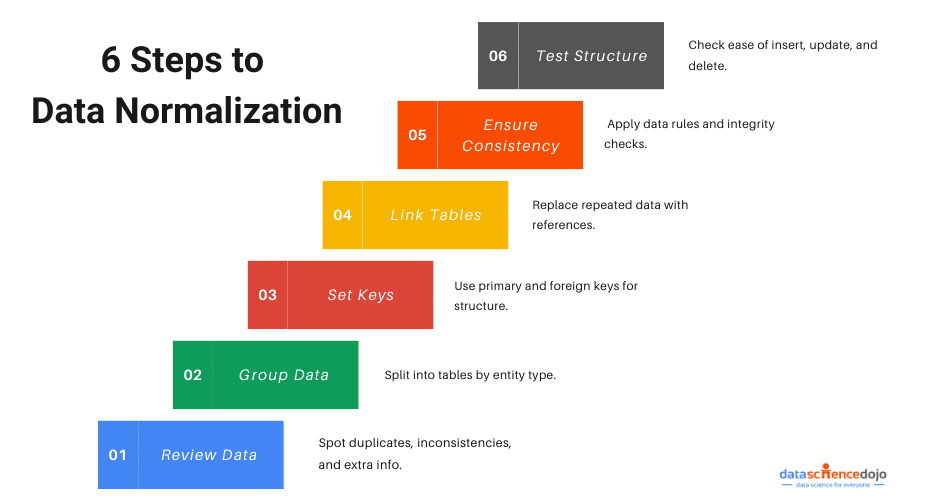
Step 1: Examine Your Raw Data
First, take a look at your dataset. Identify duplicate entries, inconsistencies, and unnecessary information that could lead to confusion.
Example:
Imagine a customer order list where names, emails, and purchased products are stored in one table. Some customers have multiple purchases, so their names appear multiple times, leading to redundancy.
| Customer Name | Product Purchased | Price | Order Date | |
| John Doe | [email protected] | Laptop | $800 | 01-03-2024 |
| John Doe | [email protected] | Mouse | $20 | 01-03-2024 |
This setup wastes space and makes updates harder (if John changes his email, you’ll need to update multiple records).
Step 2: Break Data into Logical Groups
The next step is organizing your data into separate tables based on different entities.
Example Fix:
Instead of storing everything in one table, split it into:
1️. Customers Table → Stores customer details (Customer_ID, Name, Email)
2️. Orders Table → Stores purchases (Order_ID, Customer_ID, Product, Price, Order Date)
Now, John’s details are stored only once in the Customers Table, and his orders are linked using a Customer_ID.
Step 3: Assign a Unique Identifier (Primary Key)
Every table should have a primary key—a unique value that identifies each row. This ensures that every record is distinct and helps prevent duplicate entries.
Example:
- Customers Table → Primary Key: Customer_ID
- Orders Table → Primary Key: Order_ID, Foreign Key: Customer_ID
Step 4: Remove Redundancy by Linking Tables
Now that tables are separated, they need to be linked through relationships. A foreign key in one table references the primary key in another, ensuring data consistency.
Example:
In the Orders Table, instead of repeating the customer’s name and email, just store the Customer_ID as a reference.
| Order_ID | Customer_ID | Product | Price | Order Date |
| 101 | 1 | Laptop | $800 | 01-03-2024 |
| 102 | 1 | Mouse | $20 | 01-03-2024 |
Now, if John updates his email, it only needs to be changed once in the Customers Table.
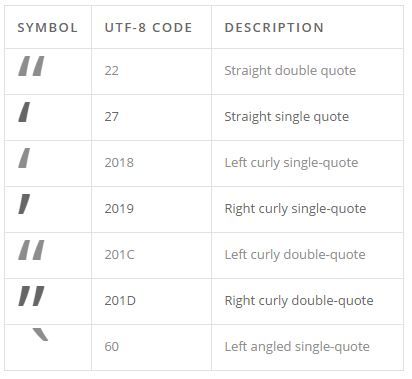
Step 5: Ensure Data Consistency
Once the structure is in place, make sure your data follows the right rules:
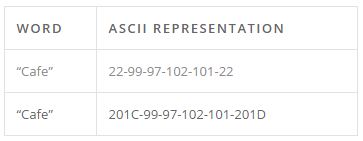
- Each column should contain only one type of data (e.g., no storing both phone numbers and emails in one field).
- Entries should be unique and meaningful (no duplicate rows).
- Relationships should be well-defined (foreign keys must match existing primary keys).
Step 6: Test Your Data Structure
Finally, test your normalized dataset by inserting, updating, and deleting records. Make sure:
- New data can be added easily.
- Updates only require changes in one place.
- Deleting data doesn’t remove unintended information.
And that’s it! By following these steps, you can transform a messy dataset into a well-structured, efficient database.
But keep in mind, this is just the core process of data normalization. In real-world scenarios, there are more steps involved. One of them is applying normal forms to further refine the structure. But don’t worry, we’ll cover that too!
The Normal Forms: Step-by-Step Breakdown
Alright, let’s talk about one of the key parts of data normalization—normal forms. Yes, the same ones we just mentioned!
But don’t worry, they’re just simple rules to structure data properly. They help remove redundancy, prevent errors, and keep data accurate. Each normal form fixes a specific issue, making the database better step by step.
Let’s break them down in a way that makes sense!
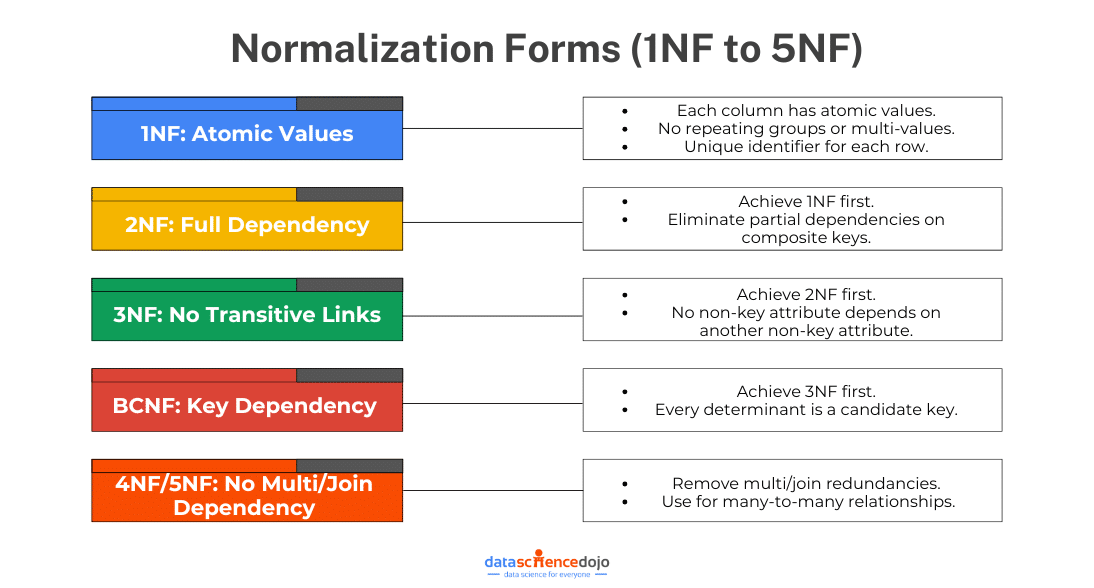
First Normal Form (1NF):
The First Normal Form (1NF) ensures that all columns in a table contain atomic (indivisible) values and that each row is unique.
Rules of 1NF:
- No repeating groups or multiple values in a single column.
- Each column should store only one type of data.
- Every row should have a unique identifier (primary key).
Practical Examples of 1NF
❌ Before 1NF (Bad Structure)
| OrderID | Customer Name | Items Ordered |
| 101 | John Doe | Laptop, Mouse |
| 102 | Jane Smith | Keyboard |
Here, the “Items Ordered” column contains multiple values.
✅ After 1NF (Correct Structure)
| OrderID | Customer Name | Item Ordered |
| 101 | John Doe | Laptop |
| 101 | John Doe | Mouse |
| 102 | Jane Smith | Keyboard |
Now, each column holds atomic values, following 1NF.
Second Normal Form (2NF):
The Second Normal Form (2NF) ensures that all non-key attributes are fully dependent on the entire primary key.
Rules of 2NF:
- The table must be in 1NF.
- No partial dependencies (where a column depends only on part of a composite primary key).
Practical Examples of 2NF
❌ Before 2NF (Bad Structure)
| OrderID | ProductID | Product Name | Customer Name |
| 101 | P001 | Laptop | John Doe |
| 102 | P002 | Keyboard | Jane Smith |
Here, Product Name depends only on ProductID, not on the whole composite key (OrderID, ProductID).
✅ After 2NF (Correct Structure)
Splitting the data into two tables:
Orders Table:
| OrderID | Customer Name |
| 101 | John Doe |
| 102 | Jane Smith |
Products Table:
| ProductID | Product Name |
| P001 | Laptop |
| P002 | Keyboard |
Now, each attribute fully depends on its respective primary key.
Third Normal Form (3NF):
The Third Normal Form (3NF) removes transitive dependencies, meaning non-key attributes should not depend on other non-key attributes.
Rules of 3NF:
- The table must be in 2NF.
- No transitive dependencies (where one column depends on another non-key column).
Practical Examples of 3NF
❌ Before 3NF (Bad Structure)
| EmployeeID | Employee Name | Department | Department Location |
| 201 | Alice Brown | HR | New York |
| 202 | Bob Green | IT | San Francisco |
Here, Department Location depends on Department, not directly on EmployeeID.
✅ After 3NF (Correct Structure)
Employees Table:
| EmployeeID | Employee Name | Department |
| 201 | Alice Brown | HR |
| 202 | Bob Green | IT |
Departments Table:
| Department | Department Location |
| HR | New York |
| IT | San Francisco |
Now, each column depends only on its primary key.
Boyce-Codd Normal Form (BCNF):
BCNF is a stricter version of 3NF. It ensures every determinant (a column that another column depends on) is a candidate key.
Rules of BCNF:
- The table must be in 3NF.
- Every determinant must be a candidate key.
Practical Examples of BCNF
❌ Before BCNF (Bad Structure)
| StudentID | Course | Instructor |
| 301 | Math | Mr. Smith |
| 302 | Science | Dr. Brown |
Here, the Instructor depends on the Course, not the student ID.
✅ After BCNF (Correct Structure)
Splitting into two tables:
Student_Course Table:
| StudentID | Course |
| 301 | Math |
| 302 | Science |
Course_Instructor Table:
| Course | Instructor |
| Math | Mr. Smith |
| Science | Dr. Brown |
Now, all dependencies are on candidate keys.
Higher Normal Forms (4NF and 5NF):
Beyond BCNF, we have Fourth Normal Form (4NF) and Fifth Normal Form (5NF) for even more complex cases.
- 4NF: Removes multi-valued dependencies (where one key relates to multiple independent values).
- 5NF: Decomposes tables to eliminate redundancy in multi-join conditions.
When to Apply Higher Normal Forms
- 4NF is used when a table has independent multi-valued facts that should be split.
- 5NF is applied in highly complex databases with many-to-many relationships.
That’s all about normal forms! See? Nothing scary at all. In fact, the entire process of data normalization is quite simple—you just need to pay a little attention.
Data Normalization in Different Contexts
If you didn’t know, here’s a fun fact—normalization isn’t just for databases! It also plays a key role in data warehousing, analytics, and machine learning.
However, many assume it’s only for databases because it looks different in different contexts, even though the core concept remains the same.
Let’s take a closer look at how it contributes to each of these processes.
Data Normalization in Relational Databases
When working with relational databases, normalization keeps things organized, efficient, and error-free. It follows normal forms (like the ones we just covered!) to split large, messy tables into smaller, linked ones. This makes it easier to update, search, and manage data.
Why it matters:
- No duplicate data—saves space and prevents confusion.
- Easy updates—change one record instead of hunting for all copies.
- Better data integrity—fewer chances of errors sneaking in.
Example:
Say you’re tracking employees and storing department names in every record. If “Marketing” gets renamed, you’d have to update dozens of records! But if departments are in a separate table, you only change it once. Simple, right?
You can also learn about vector databases
Data Normalization in Data Warehousing
Data warehouses store huge amounts of historical data for reporting and analytics. Unlike relational databases, they focus more on speed and efficiency rather than strict normalization.
Why it matters:
- Cleans and standardizes incoming data before storing it.
- Keeps reports accurate by ensuring consistency.
- Saves storage space by removing unnecessary duplicates.
Example:
Imagine a company pulling sales data from different systems, each using slightly different customer names or IDs. Without normalization, reports could show duplicate or mismatched data. By cleaning and structuring the data first, reports stay accurate.
Quick note: Unlike databases, data warehouses sometimes denormalize data (combine tables) to speed up complex queries. It’s all about balance!
Data Normalization in Machine Learning and Data Preprocessing
In machine learning (ML), data normalization doesn’t mean organizing tables—it means scaling data so that models can process it properly. If some numbers are way bigger than others, they can skew the results.
Why it matters:
- Prevents large numbers from overpowering smaller ones.
- Helps models learn faster by keeping all values in the same range.
- Improves accuracy by balancing feature importance.
Read in detail about data preprocessing
Example:
Imagine training a model to predict house prices. The dataset has square footage (in hundreds) and price (in thousands). Since price has bigger numbers, the model might focus too much on it. By applying Min-Max Scaling or Z-score Normalization, all values get adjusted to a similar scale, making predictions fairer.
So, what did we learn? Data normalization isn’t a one-size-fits-all approach—it adapts based on its use. Whether it’s keeping databases clean, ensuring accurate reports, or fine-tuning ML models, a well-structured dataset is the key to everything.
And that’s why data normalization matters everywhere!
Benefits and Challenges of Data Normalization
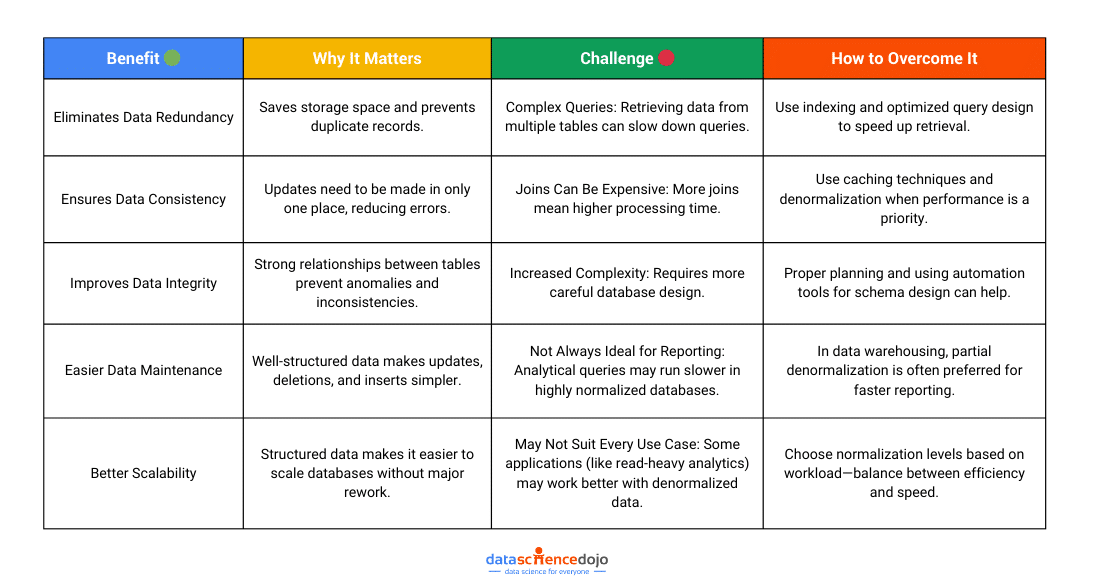
Let’s be real, data normalization sounds like the perfect solution to messy, inefficient databases. And in many ways, it is! It cuts out redundancy, keeps data accurate, and makes scaling easier.
But (and there’s always a but), it’s not without its challenges. Data normalization can sometimes slow things down, complicate queries, and make reporting trickier. The good news? Most of these challenges have workarounds.
So, let’s break it all down—the benefits, the roadblocks, and how to tackle them like a pro.
Denormalization: When and Why to Use It
Somewhere in this blog, we mentioned the word denormalization—and no, that wasn’t a typo! It’s a real thing, and an important one at that. After spending all this time talking about normalization, it might sound strange that we’re now discussing undoing some of it. But don’t worry, there’s a good reason for that.
Normalization is great for keeping data structured and reducing redundancy, but sometimes, strict normalization can slow things down, especially when running complex queries on large datasets. That’s where denormalization comes in, striking a balance between structure and performance. Let’s break it down.
Understanding Denormalization
Denormalization is the process of combining tables and introducing redundancy to speed up data retrieval. Instead of optimizing for minimal data duplication (like normalization does), it focuses on performance and efficiency, particularly in read-heavy applications.
- Why would we ever want redundancy?
- Faster Queries – Reducing joins speeds up retrieval times.
- Simplified Queries – Fewer joins make queries easier to write and manage.
- Optimized for Reads – Best for scenarios where reading data is more frequent than updating it.
Of course, it comes with trade-offs. More redundancy means increased storage usage and potential data inconsistencies if updates aren’t managed properly. So, it’s all about knowing when to use it and when to avoid it.
Scenarios Where Denormalization is Beneficial
Denormalization isn’t a one-size-fits-all approach. It’s useful in certain situations where performance matters more than strict data integrity. Here’s where it makes the most sense:
| Scenario | Why Denormalization Helps |
| Reporting & Analytics | Complex reports often require multiple joins. Denormalization speeds up query execution by reducing them. |
| Read-Heavy Applications | When a system performs frequent reads but fewer updates, storing pre-joined data improves performance. |
| Real-Time Dashboards | Dashboards need fast data retrieval, and denormalization reduces the time spent fetching data from multiple tables. |
| Distributed Databases | In NoSQL and distributed systems, denormalization helps avoid excessive network calls by keeping relevant data together. |
| Caching & Performance Optimization | Some applications cache frequently accessed data in a denormalized format to reduce database load. |
Denormalization isn’t about undoing all the hard work of normalization—it’s about adapting to real-world performance needs. Knowing when to normalize for structure and when to denormalize for speed is what makes a database truly efficient.
With that, we’re almost at the end of our journey! But before we wrap up, let’s take a step back and summarize everything we’ve learned.
You can also explore the SQL vs NoSQL debate
Conclusion: Striking the Right Balance
And there you have it—data normalization and denormalization demystified!
We started with the basics, broke down normal forms step by step, explored how data normalization works in different contexts, and even tackled its challenges. Then, just when we thought structured data was the ultimate goal, denormalization showed us that sometimes, breaking a few rules can be beneficial too.
So, what’s the key takeaway? Balance.
🔹 Normalize when you need consistency, accuracy, and efficient data management.
🔹 Denormalize when speed, performance, and real-time access matter more.
At the end of the day, there’s no one-size-fits-all approach—it all depends on your specific use case. Whether you’re designing a relational database, optimizing a data warehouse, or prepping data for machine learning, knowing when to normalize and when to denormalize is what separates a good data architect from a great one.
Now, armed with this knowledge, you’re ready to structure data like a pro!