

Feature Engineering is a process of using domain knowledge to extract and transform features from raw data. These features can be used to improve the performance of Machine Learning Algorithms.
Feature Engineering encompasses a diverse array of techniques, including Feature Transformation, Feature Construction, Feature Selection, Feature Scaling, and Feature Extraction, each playing a crucial role in refining and optimizing the representation of data for machine learning tasks.
In this blog, we will discuss one of the feature transformation techniques called feature scaling with examples and see how it will be the game changer for our machine learning model accuracy.

In the world of data science and machine learning, feature transformation plays a crucial role in achieving accurate and reliable results. By manipulating the input features of a dataset, we can enhance their quality, extract meaningful information, and improve the performance of predictive models. Python, with its extensive libraries and tools, offers a streamlined and efficient process for simplifying feature scaling.
What is Feature Scaling?
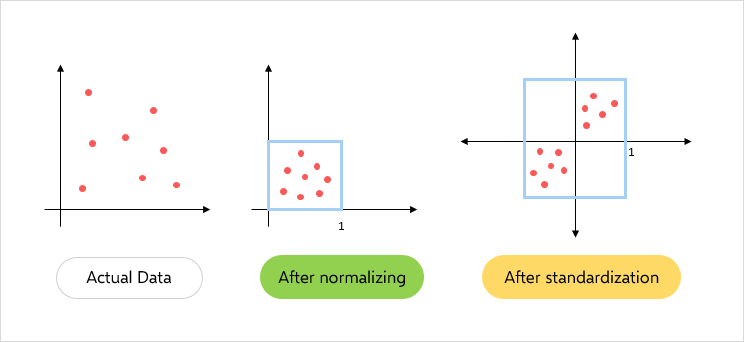
Feature scaling is a crucial step in the feature transformation process that ensures all features are on a similar scale. It is the process that normalizes the range of input columns and makes it useful for further visualization and machine learning model training. The figure below shows a quick representation of feature scaling techniques that we will discuss in this blog.
Why Feature Scaling is Important?
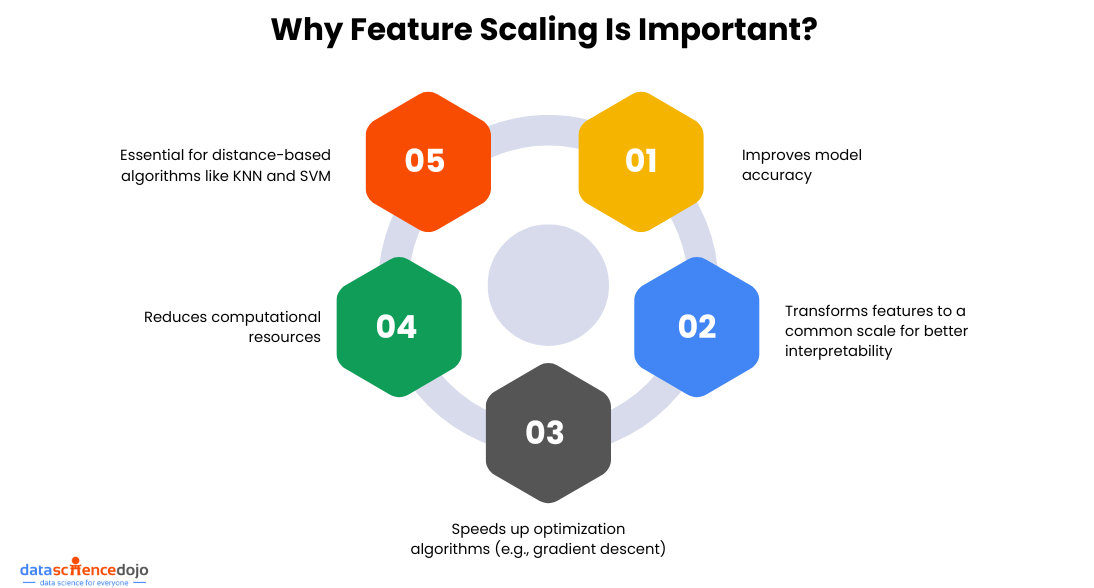
Feature scaling is important because of several factors:
- It improves the machine learning model’s accuracy
- It enhances the interpretability of data by transforming features on a common scale, without scaling, it is difficult to make comparisons of two features because of scale difference
- It speeds up the convergence in optimization algorithms like gradient descent algorithms
- It reduces the computational resources required for training the model
- For better accuracy, it is essential for the algorithms that rely on distance measures, such as K-nearest neighbors (KNN) and Support Vector Machines (SVM), to be sensitive to feature scales
Now let’s dive into some important methods of feature scaling and see how they impact data understanding and machine learning model performance.
Also learn about Machine Learning algorithms
Normalization
A feature scaling technique is often applied as part of data preparation for machine learning. The goal of normalization is to change the value of numeric columns in the dataset to use a common scale, without distorting differences in the range of values or losing any information.
Min-Max Scaler
The most commonly used normalization technique is min-max scaling, which transforms the features to a specific range, typically between 0 and 1. Scikit-learn has a built-in class available named MinMaxScaler that we can use directly for normalization. It involves subtracting the minimum value and dividing by the range of the feature using this formula.
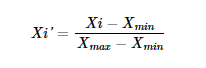
Where,
Xi is the value we want to normalize.
Xmax is the maximum value of the feature.
Xmin is the minimum value of the feature.
In this transformation, the mean and standard deviation of the feature may behave differently. Our main focus in this normalization is on the minimum and maximum values. Outliers may disrupt our data pattern, so taking care of them is necessary.
Another interesting read: Building Predictive Models with Azure ML
Let’s take an example of a wine dataset that contains various ingredients of wine as features. We take two input features: the quantity of alcohol and malic acid and create a scatter plot as shown below.
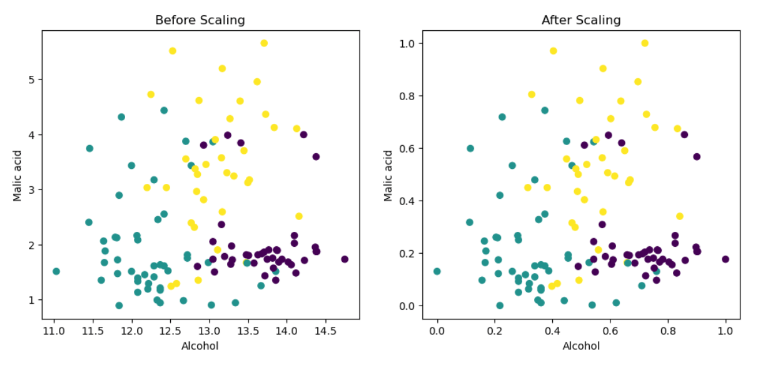
When we create a scatter plot between alcohol and malic acid quantities, we can see that min-max scaling simply compresses our dataset into the range of zero to one, while keeping the distribution unchanged.

Standardization
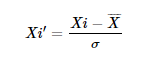
Standardization is a feature scaling technique in which values of features are centered around the mean with unit variance. It is also called Z-Score Normalization. It subtracts the mean value of the feature and divides by the standard deviation (σ) of the feature using the formula:
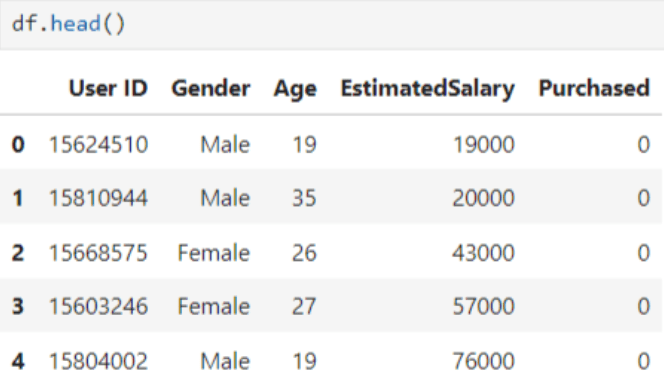
Here we leverage a dataset on social network ads to gain a practical understanding of the concept. This dataset includes four input features: User ID, Gender, Age, and Salary. Based on this information, it determines whether the user made a purchase or not (where zero indicates not purchased, and one indicates purchased).
The first five rows of the dataset appear as follows:
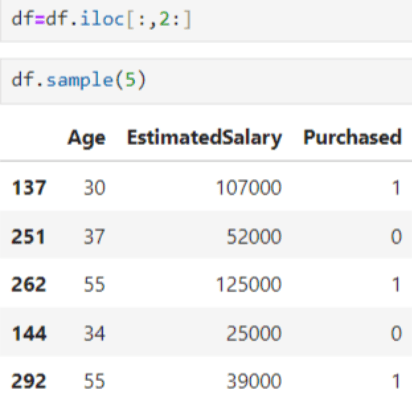
In this example, we extract only two input features (Age and Salary) and use them to determine whether the output indicates a purchase or not as shown below.
Standard Scaler
We use Standard-Scaler from the Scikit-learn preprocessing module to standardize the input features for this feature scaling technique. The following code demonstrates this as shown.
We can see how our features look before and after standardization below.
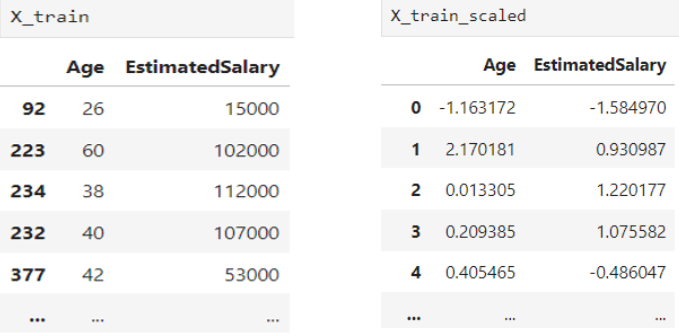
Although it appears that the distribution changes after scaling, let’s visualize both distributions through a scatter plot.
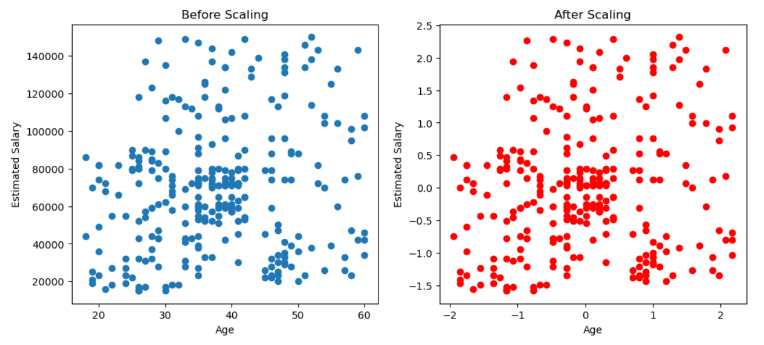
So, when we visualize these distributions through plots, we observe that they remain the same as before. This indicates that scaling doesn’t alter the distribution; it simply centers it around the origin.
Now let’s see what happens when we create a density plot between Age and Estimated Salary with and without scaled features as shown below.
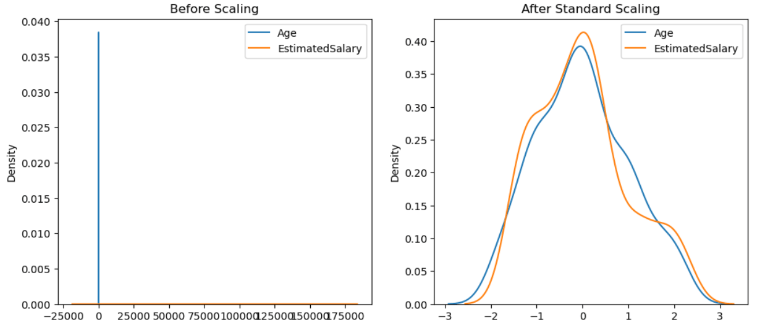
In the first plot, we can observe that we are unable to visualize the plot effectively and are not able to draw any conclusions or insights between age and estimated salary due to scale differences. However, in the second plot, we can visualize it and discern how age and estimated salary relate to each other.
You might also find this useful: Top Node.js Libraries for Machine Learning
This illustrates how scaling assists us by placing the features on similar scales. Note that this technique does not have any impact on outliers. So, if an outlier is present in the dataset, it remains as it is even after standardization. Therefore, we need to address outliers separately.
Model’s Performance Comparison
Now we use the logistic regression technique to predict whether a person will make a purchase after seeing an advertisement and observe how the model behaves with scaled features compared to without scaled features.
Here, we can observe a drastic improvement in our model accuracy when we apply the same algorithm to standardized features. Initially, our model accuracy is around 65.8%, and after standardization, it improves to 86.7%
When Does It Matter?
Note that standardization does not always improve your model accuracy; its effectiveness depends on your dataset and the algorithms you are using. However, it can be very effective when you are working with multivariate analysis and similar methods, such as Principal Component Analysis (PCA), Support Vector Machine (SVM), K-means, Gradient Descent, Artificial Neural Networks (ANN), and K-nearest neighbors (KNN).
However, when you are working with algorithms like decision trees, random forest, Gradient Boosting (G-Boost), and (X-Boost), standardization may not have any impact on improving your model accuracy as these algorithms work on different principles and are not affected by differences in feature scales
To Sum It Up
We have covered standardization and normalization as two methods of feature scaling, including important techniques like Standard Scaler and Min-Max Scaler. These methods play a crucial role in preparing data for machine learning models, ensuring features are on a consistent scale. By standardizing or normalizing data, we enhance model performance and interpretability, paving the way for more accurate predictions and insights.