fbpx

Marketing

Data-driven marketing for better ROI    
Muhammad Bilal Awan
| October 13, 2022

You may have heard the buzzword data-driven marketing. In this blog we will discuss what is required to really be data-driven in marketing initiatives that help us achieve a better return on marketing investment?  

We will talk about:

  • What data-driven marketing is
  • How to create and implement marketing strategies based on data
  • The challenges marketers face in a data-driven environment, and
  • Tools to help deliver a higher return on investment (ROI). 

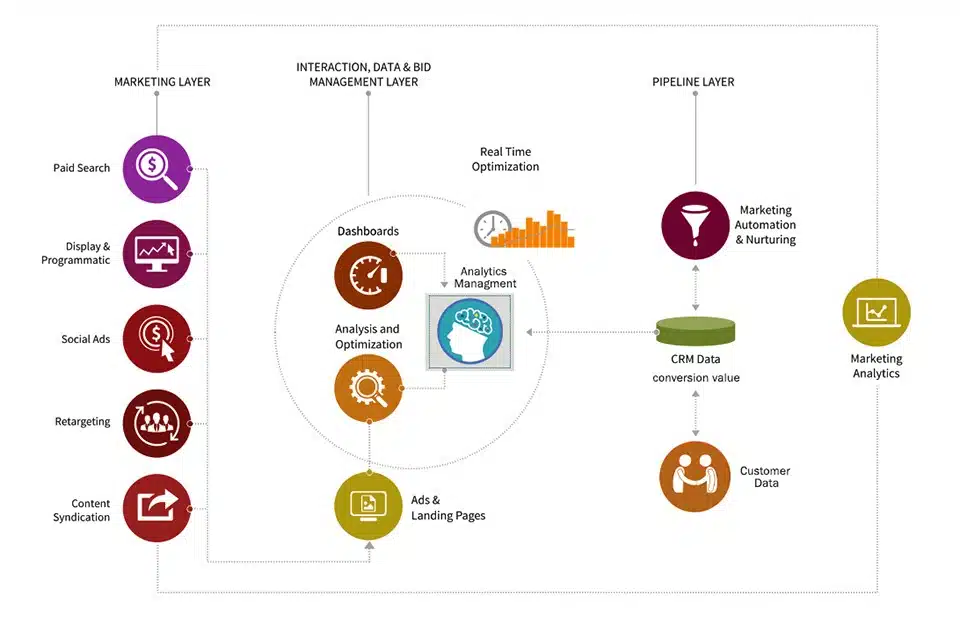
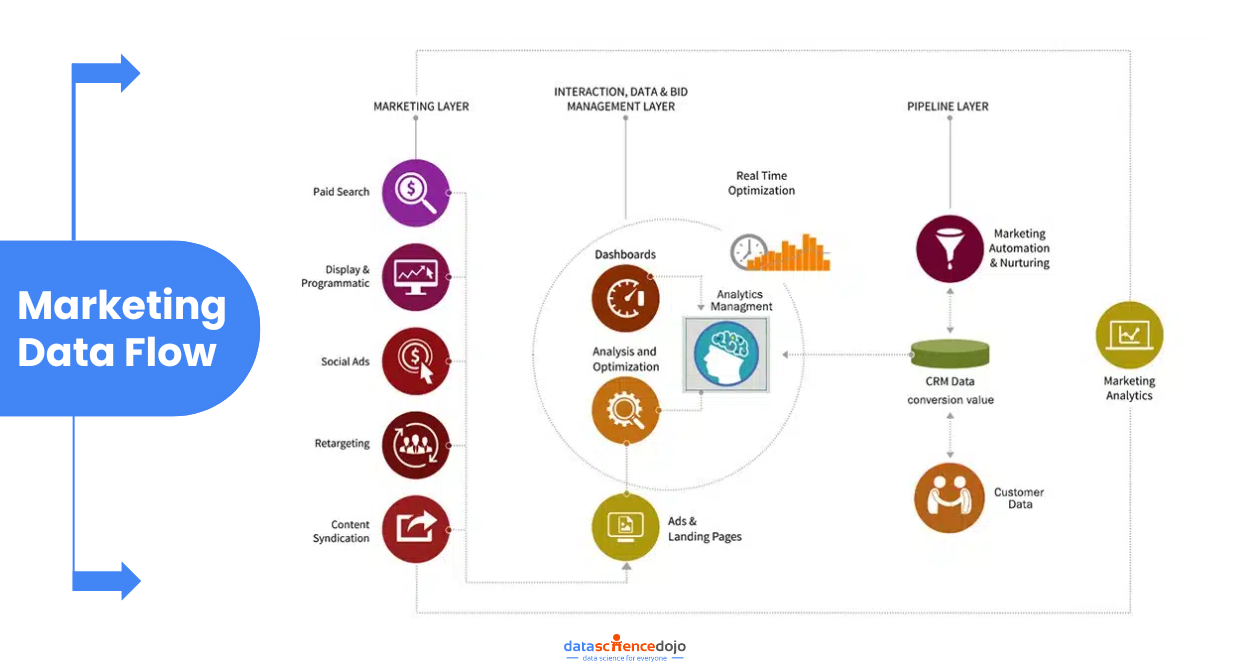
Today’s marketing is a lot different from decades-old gut-driven marketing. Now we have the most reliable sources of information available in real-time. With tools like HubSpot, Salesforce, Zoho, and many others you can track every interaction of your lead from the initial stages of the buyer’s journey to post-purchase.  

This helps devise long-term strategies that are based on actual data rather than gut feelings. With the information available you can optimize current campaigns to achieve the best ROI. 

However, to achieve the desired results you need to first understand what’s important in terms of your customer interaction and what metrics matter the most, so you don’t get lost in an enormous amount of data. 

Become skilled in data-driven marketing with Data Science Dojo’s certificate programs. 

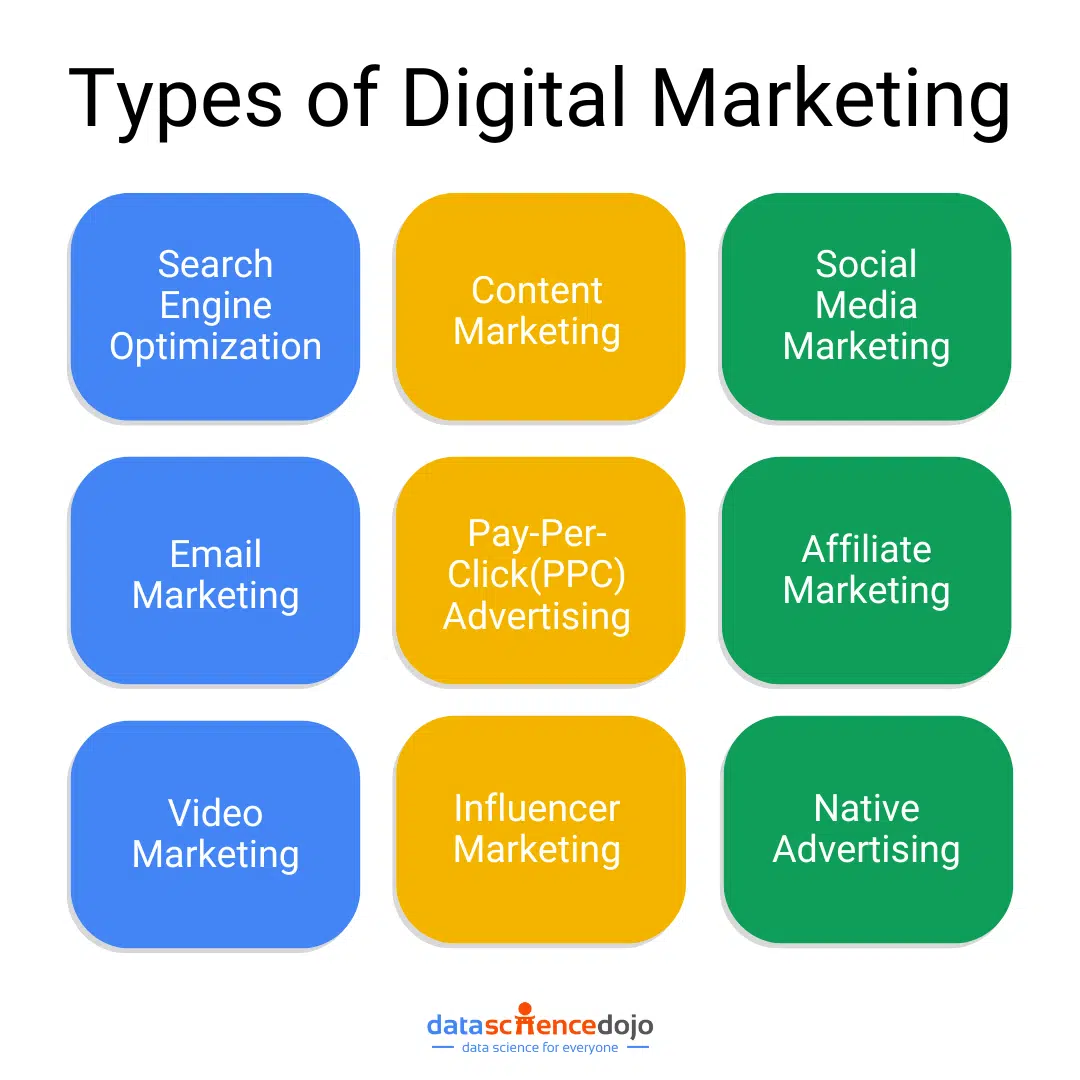
data driven marketing
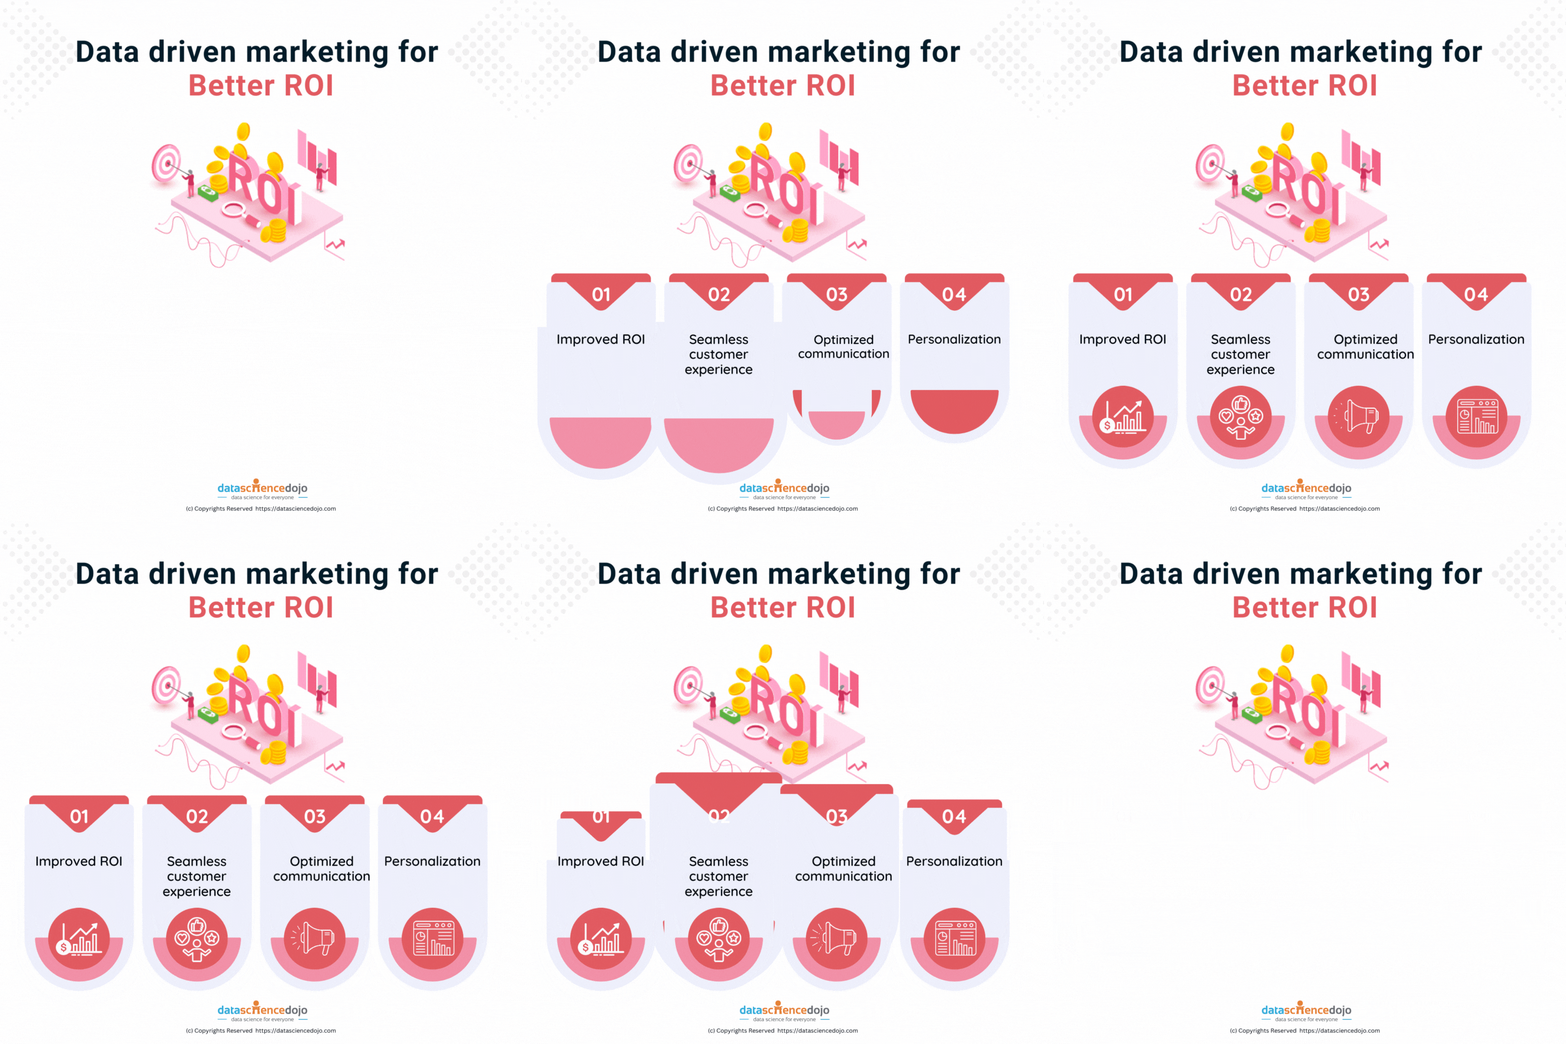
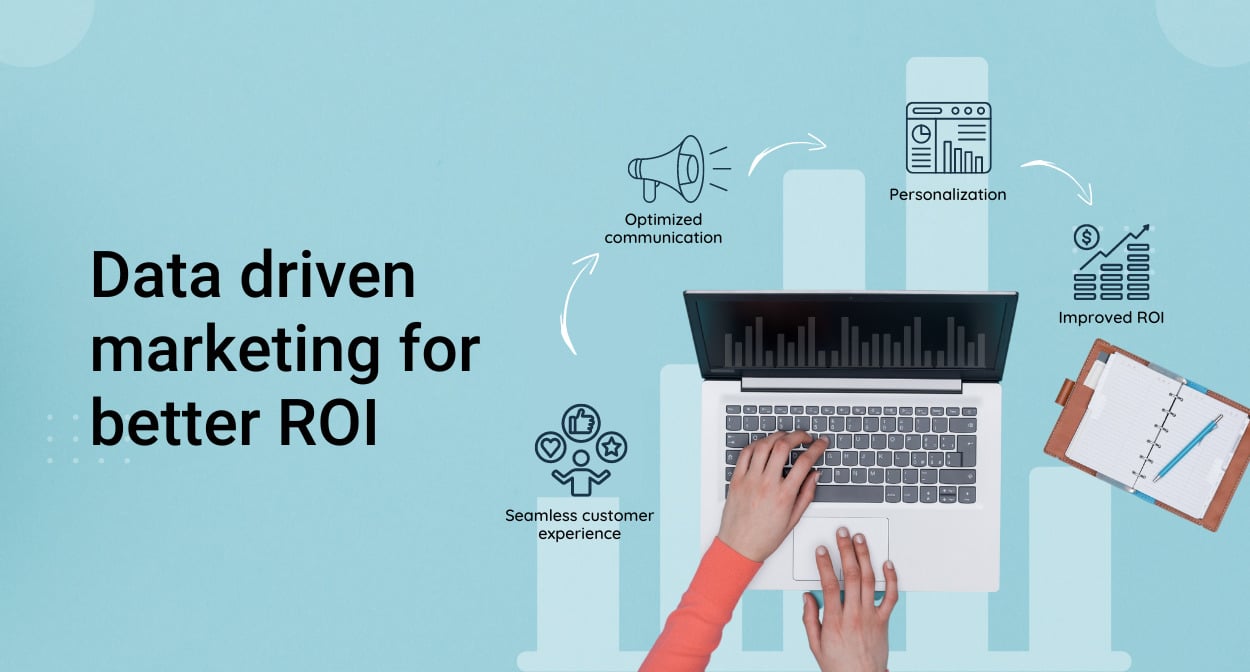
Four key benefits of data-driven marketing

What is data-driven marketing and why is it important? 

Data-driven marketing is an approach where marketers build strategies based on the analysis of big data. This includes using tools to drive insights from raw data to turn it into actionable insights based on customer interaction. Marketers identify trends and base their long-term strategy on insights driven by data analysis. 

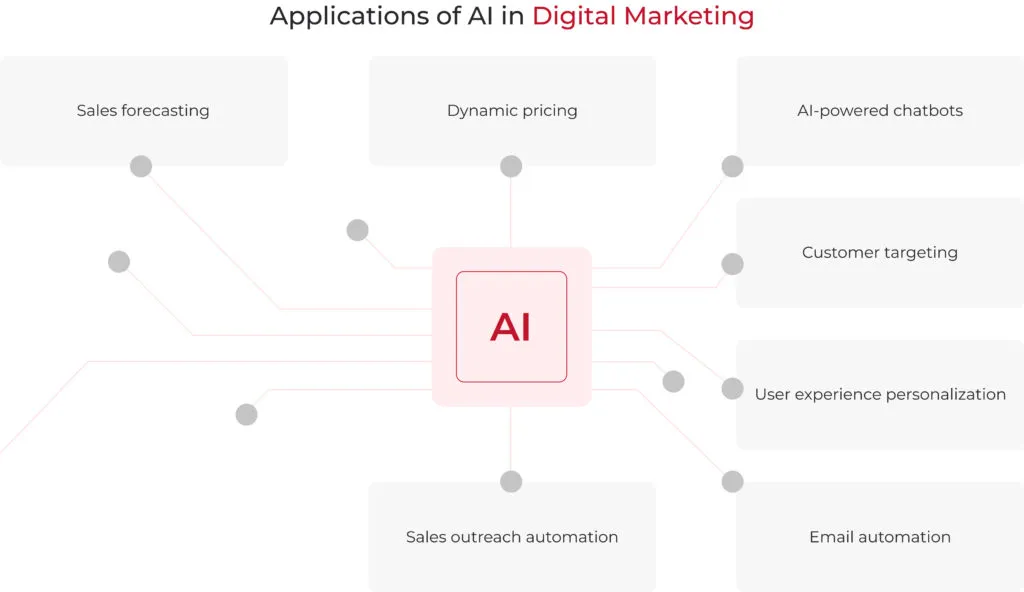
So, why should we invest in a data-driven marketing approach? Besides the obvious answer of clarity and efficiency of marketing processes, a data-driven approach helps identify a target audience, creates a seamless experience for customers, helps choose the best communication channels, and creates personalization. 

  • Help define the target audience 

One of the most important aspects of any marketing campaign is to have a laser-sharp definition of the target audience. With the help of insights from different marketing touchpoints collected and analyzed, we can define the target group for our products/services who are most likely to benefit. 

Once we have a clear definition of the target audience and created personas everything else falls in place to create a synergized marketing campaign to reach the right audience at the right time with the right communication. 


  • Create a seamless customer experience 

Successful marketing is not only about lavish advertising campaigns and promotion but to create and delivering superior value to customers. This in turn helps build the brand, create an army of loyalists, and drive positive word of mouth. 

Data-driven marketing helps analyze trends in the market and understand user interaction with marketing touchpoints to create workflows and processes. This helps improve service delivery and exceed customer expectations. Data-driven organizations are able to deliver a smooth experience over the customer lifecycle minimizing hurdles and delivering great value. 

For example, at Data Science Dojo, customer success is the most important driver of overall organizational health. We have created automated processes that are personalized to each individual customer and lead. This helps the marketing team nurture potential leads into high-value customers and delivers a seamless experience to help build a community of brand advocates. So far, we have trained more than 10,000+ professionals from around the globe and built a community of data enthusiasts. 


  • Optimizing communication channels 

With the help of data coming in from different marketing touchpoints, marketers can identify the best possible communication channel for each product category, target audience, and customer segment.  

Marketers no longer need to rely on one size fits all solutions but instead create personalized communication based on user behavior, demographics, psychographics, and other factors being captured through CRM and ERP systems.  

For example, Starbucks, one of the leading coffee brands in the world used a data-driven approach to create an end-to-end marketing experience for their customers by using a mobile application as their primary communication channel. Marketing identified an opportunity to grow the customer base by offering a loyalty reward program based on user interaction with the brand touchpoints. According to Risenews case study today Starbucks is running the most successful loyalty program with over 24 million active users.  


  • Creating personalization 

Customers are skeptical about generic marketing messaging that pushes them to buy. A recent study by Marketo shows that consumers are fed up with repeated generic messages being blasted at them. 63% of the respondents said they are highly annoyed while 78% said they will only engage with the brand offers if it relates to their previous interaction. 

Personalization is not just an add-on to good messaging, but it has become a necessity to survive in a cluttered communication environment where users are receiving thousands of brand messages from multiple platforms.  
With data analysis of user queries, interaction, and common questions, and defining the entire sales process marketers can create personalized communication based on user segment and need.  

The sales team plays a vital role in delivering personalized messaging but with a data-driven approach, we can minimize redundant tasks and focus on delivering personalized messaging based on user interaction. 


How a data-driven approach helps improve ROI 

Now that we have a clear understanding of how significant data is to any marketing effort, we can talk about its impact on overall business goals and specific measurable marketing objectives. 

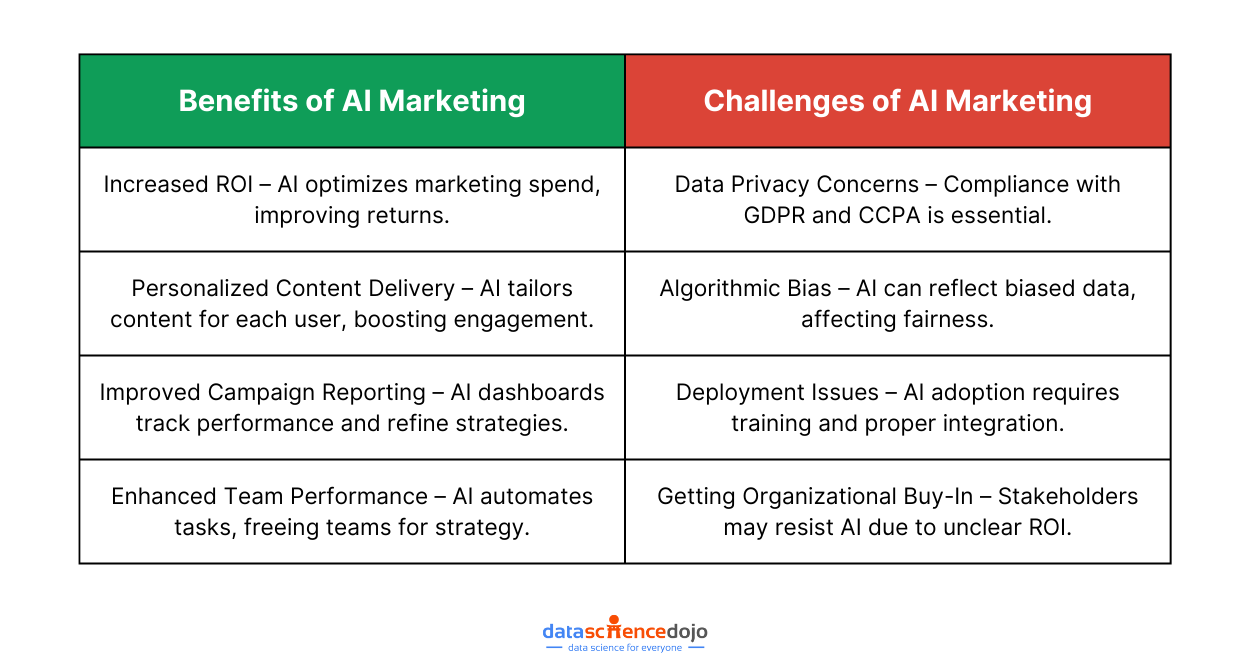
Research suggests benefits of a data-driven marketing approach are huge. We get greater customer loyalty, improved lead generation, and increased satisfaction. 

According to ZoomInfo about 78% of organizations that follow data-driven approach verifies increase in lead conversion and customer acquisition. 

Another study by Forbes reveals that 66% of marketing leaders believe that data lead to increased customer acquisition. 

To improve your return on marketing investment it is important to give the right attribution to each marketing activity. This helps us identify the best drivers of growth and invest more time and money in that particular marketing activity or channel. 

Learn more about marketing attribution in this short tutorial 


Challenges to a data-driven approach 

According to Campaign Monitor, 81% of marketing professionals consider the implementation of data-driven strategies extremely complicated. 

So, what are some of the challenges to achieving a data-driven marketing overhaul? 


1. Gathering data: many data-driven marketers are overwhelmed by the idea of collecting data without any automation. In most cases, the abundance of data makes it difficult to narrow it down to the most useful data for analysis.  

Solution: There are multiple CRM and ERP systems available at very competitive costs that deliver precise information on your customer that can be used to create a better user experience. 


2. Pulling data: Manually pulling and updating data regularly is a laborious task  

Solution: Creating a marketing dashboard that helps keep track of real-time data. Less time should be spent collecting data and more time analyzing and making decisions. There are multiple tools available to connect and visualize your data. Platforms like Hotjar, Adverity, and Improvado help collect, organize, and seamlessly visualize data so you as a marketer can focus on planning and making data-driven decisions. 


 3. Data silos: Challenge of data silos created at each departmental, functional, or team level which is not accessible to the entire team makes the marketing job difficult. A recent survey shows only 8% of the companies have a centralized data repository.  

Solution: To overcome the challenge of data silos there needs to be an organization-wide effort to modernize and embrace change. This is going to include setting up common standards, changing culture, and embracing new marketing analytics platforms. 


A marketing strategy based on data 

Building a data-driven strategy or just strategy itself is a vast topic with much research being conducted on the best way to do so. The only thing you need to keep in mind is your current business environment, this includes internal, external, and current organizational requirements.  

Here is a quick walkthrough of steps involved in a data-driven strategy 

Step 1: Strategy 

The first step is to identify long-term strategy, this means figuring out your long-term goals, specific and measurable objectives, and detailing down to tactics.  

Once you have a clear understanding of your overall business strategy as well as a marketing strategy you can focus on data that is relevant to your goals. 

Step 2: Identify key areas 

Data is scattered across organizations coming from all directions and multiple customer touchpoints. It is important to identify key areas of interest that align with your overall business strategy and objectives. Once we have key focus areas, we can continue investing more in building capabilities in that area. 

Step 3: Data targeting  

After identifying focus areas, it is time to target datasets that will answer all the burning questions related to your business and marketing objectives.  

This means identifying already available information and channels and figuring out the most valuable information. At this point of your data-driven strategy, the goal is to streamline data collection and presentation methods so that marketing can only focus on key areas of business value and not waste time on non-essential data reports.  

Step 4: Collecting and analyzing data 

In this step, you need to identify key stakeholders in data collection and analysis. There may be teams or individuals at each data collection and distribution point based on the size of the organization. The idea is to keep the process of collection and dissemination of data seamless, integrated, and in real-time.  

This may require an organization to implement integrated ERP systems or CRM systems to connect data coming in from various sources based on our identified key focus areas and show relevant information to each team. 

Step 5: Turning insights into action 

The final step of a data-driven strategy is to turn insights gained from data analysis into actionable items. ROI will depend on how useful your insights are and how successfully they were implemented to achieve marketing objectives. At this step, you need to have a clear understanding and a game plan for the implementation phase, actions that will improve business and create value for customers. 

Learn how to visualize data to tell a story 


Become a truly data-driven marketer 

Becoming data-driven is a continuous process, if you think you are data-driven now, technology and competitive environment will change in the next 6 months making your current data-driven strategy obsolete. As a marketer you need to constantly improve and update so does your marketing strategy. With this guide, you can get started with becoming more data-driven and less gut-driven to make sound marketing decisions based on real-time data. This will not only help achieve measurable marketing objectives but improve return on marketing investment and improve overall business value. 


References 

https://www.forbes.com/forbesinsights/data_driven_and_digitally_savvy/ 

https://www.marketo.com/articles/personalization-definition/ 

https://www.campaignmonitor.com/resources/infographics/the-eye-opening-truth-about-data-driven-marketing/ 

https://www.mckinsey.com/capabilities/growth-marketing-and-sales/our-insights/the-big-reset-data-driven-marketing-in-the-next-normal 

https://datasciencedojo.com/blog/data-science-toolkit/ 


Gibran Saleem
| September 23, 2022

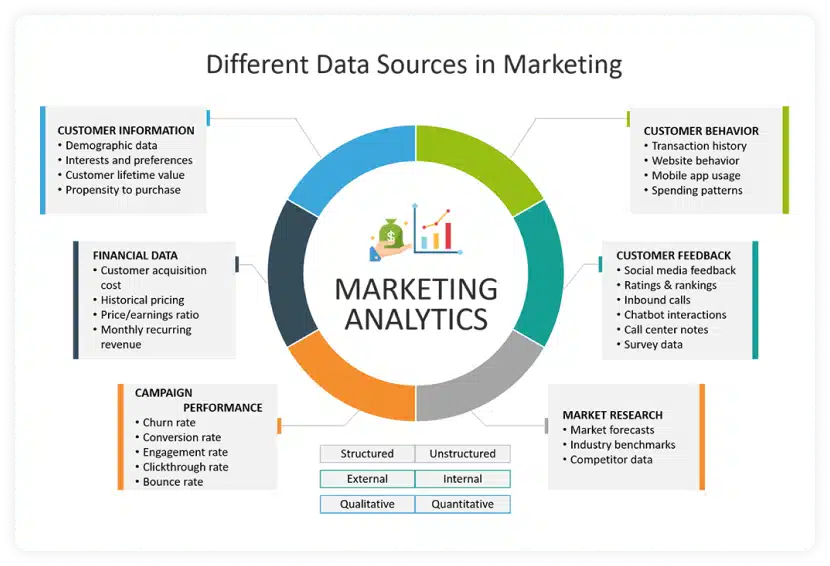
Marketing analytics tells you about the most profitable marketing activities of your business. The more effectively you target the right people with the right approach, the greater value you generate for your business.

However, it is not always clear which of your marketing activities are effective at bringing value to your business.  This is where marketing analytics comes in. Running an Amazon seller competitor analysis is crucial to your success in the marketplace. Using a framework to monitor your competitors’ efforts is a great way to ensure you can beat them at their own game.

It guides you to use the data to evaluate your marketing campaign. It helps you identify which of your activities are effective in engaging with your audience, improving user experience, and driving conversions. 

Grow your business with Data Science Dojo 


Marketing analytics
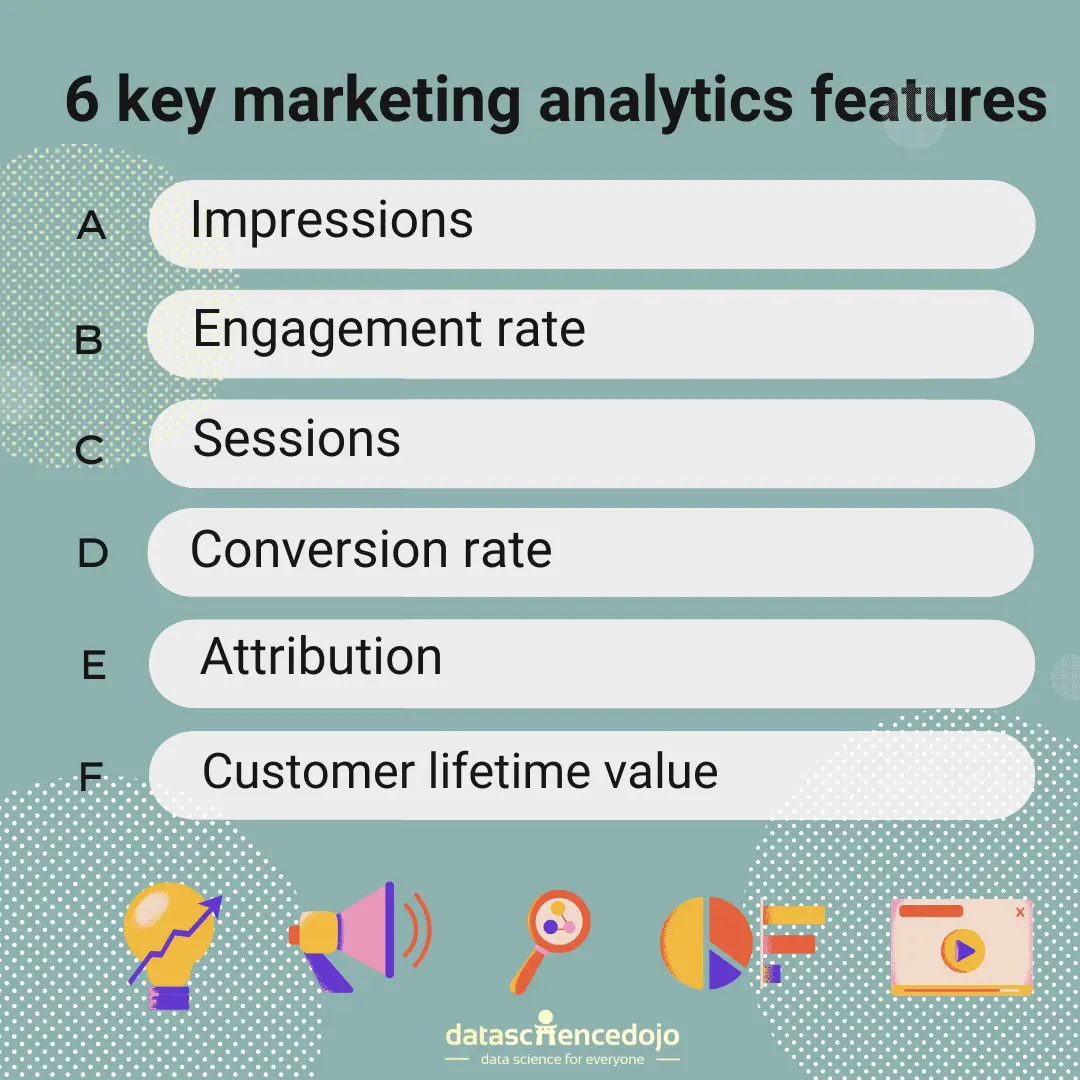
6 marketing analytics features by Data Science Dojo

Data driven marketing is imperative in optimizing your campaigns to generate a net positive value from all your marketing activities in real-time. Without analyzing your marketing data and customer journey, you cannot identify what you are doing right and what you are doing wrong when engaging with potential customers. The 6 features listed below can give you the start you need to get into analyzing and optimizing your marketing strategy using marketing analytics 

 Learn about marketing analytics tools in this blog

1. Impressions 

In digital marketing, impressions are the number of times any piece of your content has been shown on a person’s screen. It can be an ad, a social media post, video etc. However, it is important to remember that impressions do not mean views, a view is an engagement, anytime somebody sees your video that is a view, but an impression would also include anytime they see your video in the recommended videos on YouTube or in their newsfeed on Facebook. The impression will be counted regardless of whether they watch your video or not. 

Learn more about impressions in this video


It is also important to distinguish between impressions and reach. Reach is the number of unique viewers, so for example if the same person views your ad three times, you will have three impressions but a reach of one.  

Impressions and reach are important in understanding how effective your content was at gaining traction. However, these metrics alone are not enough to gauge how effective your digital marketing efforts have been, neither impressions nor reach tell you how many people engaged with your content. So, tracking impressions is important, but it does not specify whether you are reaching the right audience.  


2. Engagement rate 

In social media marketing, engagement rate is an important metric. Engagement is when a user comments, likes, clicks, or otherwise interacts with any of your content. Engagement rate is a metric that measures the amount of engagement of your marketing campaign relative to each of the following: 

  • Reach 
  • Post 
  • Impressions  
  • Days
  • Views 

Engagement rate by reach is the percentage of people who chose to interact with the content after seeing it. It is calculated by the following formula. Reach is a more accurate measurement than follower count, because not all of your brands followers may see the content while those who do not follow your brand may still be exposed to your content. 

Engagement rate by post is the rate at which followers engage with the content. This metric shows how engaged your followers are with your content. However, this metric does not account for organic reach and as your follower count goes up your engagement by post goes down. 

Engagement rate by Impressions is the rate of engagement relative to the number of impressions. If you are running paid ads for your brand, engagement rate by impressions can be used to gauge your ads effectiveness.  

Average Daily engagement rate tells you how much your followers are engaging with your content daily. This is suitable for specific use cases for instance, when you want to know how much your followers are commenting on your posts or other content. 

Engagement rate by views gives the percentage of people who chose to engage with your video after watching them. This metric however does not use unique views so it may double or triple count views from a single user. 

Learn more about engagement rate in this video


3. Sessions 

Sessions are another especially important metric in marketing campaigns that help you analyze engagement on your website. A session is a set of activities by a user within a certain period. For example, a user spent 10 minutes on your website, loading pages, interacting with your content and completed an interaction. All these activities will be recorded in the same 10-minute session.  

In Google Analytics, you can use sessions to check how much time a user spent on your website (session length), how many times they returned to your website (number of sessions), and what interactions users had with your website. Tracking sessions can help you determine how effective your campaigns were in directing traffic towards your website. 

If you have an E-commerce website another very helpful tool on Google Analytics is behavioral analytics. With behavioral analytics you see what key actions are driving purchases on your website. The sessions report can be accessed under conversions tab on Google Analytics. This report can help you understand user behaviors such as abandon carts. This allows you to target these users with targeted ads or offering incentives to complete their purchase. 

Learn more about sessions in this video


4. Conversion rate 

Once you have engaged your audience the next step in the customers’ journey is conversion. A conversion is when you make the customer or user complete a specific action. This desired action can be anything from a form submission, purchasing a product or subscribing to a service. The conversion rate is the percentage of visitors who completed the desired action.

So, if you have a form on your website and you want to find out what the conversion rate is. You would simply divide the number of form submissions by the number of visitors on that form’s page (Total conversions/total interactions). 


Conversion rate is a very important metric that helps you assess the quality of your leads. While you may generate a large number of leads or visitors, if you cannot get them to perform the desired action you may be targeting the wrong audience. Conversion rate can also help you gauge how effective your conversion strategy is, if you aren’t converting visitors, it might indicate that your campaign needs optimization. 


5. Attribution  

Attribution is a sophisticated model that helps you measure which channels are generating the most sales opportunities or conversions. It helps you assign credit to specific touchpoints on the customers journey and understand which touchpoints are driving conversions the most. But how do you know which touchpoint to attribute to a specific conversion?  Well, that depends on which attribution models you are using. There are four common attribution models. 

First touch attribution models assign all the credit to the first touchpoint that drove the prospect to your website. It focuses on the top of the marketing efforts funnel and tells you what is attracting people to your brand 

Last touch attribution models assign credit to the last touchpoint. It focuses on the last touchpoint the visitor interacted with before they converted. 

Linear attribution model assigns an equal weight to all the touchpoints in the buyer’s journey. 

Time decay attributions is based on how close the touchpoint is to the conversion, where a weighted percentage is assigned to the most recent touchpoints. This can be used when the buying cycle is relatively short. 

What model you use is based on what product or subscription you are selling and what is the length of your buyer cycle. While attribution is very important in identifying the effectiveness of your channels, to get the complete picture you need to look at how each touchpoint drives conversion. 

 Learn more about attribution in this video


6. Customer lifetime value 

Businesses prefer retaining customers over acquiring new ones, and one of the main reasons is that attracting new customers has a cost. The customer acquisition cost is the total cost that you incur as a business acquiring a customer. The customer acquisition cost is calculated by dividing the marketing and sales cost by the number of new customers. 

Learn more about CLV in this video


So, as a business, you must weigh the value of each customer with the associated acquisition cost. This is where the customer lifetime value or CLV comes in. The Customer lifetime value is the total value of your customer to your business during the period of your relationship.

The CLV helps you forecast your revenue as well, the larger the average CLV you have the better your forecasted revenue will be. CLV is calculated by dividing the annual revenue generated from customers by the average retention period (in years).  If your CAC is higher than your CLV, then you are on average losing money on every customer you make.

This presents a huge problem. Metrics like CAC and CLV are very important for driving revenue. They help you identify high-value customers and identify low value customers so you can understand how to serve these customers better. They help you make more informed decisions regarding your marketing effort and build a healthy customer base. 


 Integrate marketing analytics into your business 

Marketing analytics is a vast field. There is no one method that suits the needs of all businesses. Using data to analyze and drive your marketing and sales effort is a continuous effort that you will find yourself constantly improving upon. Furthermore, finding the right metrics to track that have a genuine impact on your business activities is a difficult task.

So, this list is by no means exhaustive, however the features listed here can give you the start you need to analyze and understand what actions are important in driving engagement, conversions and eventually value for your business.  


Eric Durkopp
| January 14, 2019

Online videos account for 80% of all consumer internet traffic. Here are some video marketing platforms that make data analysis easy.

The importance of video marketing cannot be overstated. By 2019, video traffic will account for 80% of all consumer internet traffic, and one-third of all online activity is spent watching video content. If your company is looking to expand its presence online, video is the way to go.

We get it, you’re not a data scientist, you’re just a marketing manager, coordinator, or intern looking to increase the company’s online presence. Here’s the thing, you don’t need to be a data scientist to receive valuable information from your videos. There is a plethora of platforms out there with readymade tools that data-driven will make you a data driven video professional. But which ones should you use? That’s why we’re here! In this post, you’ll find what we, the Data Science Dojo Video Team, picked as our top video marketing platforms.

YouTube

YouTube needs no introduction. Nearly one out of every two internet users are on YouTube, and the site is the second largest search engine on the web. Because of YouTube’s rapidly growing popularity, it shouldn’t come as a surprise this would be the first platform on our list.

youtube-home-for-video-team-blog-1
Youtube – marketing platform
Photo by

Christian Wiediger on Unsplash

At its core, YouTube is a video hosting platform that uses your content as the business model, much like Facebook. It’s the reason all the tools are free to use, otherwise, it wouldn’t have caught on as quickly.

Features:

  • Create & customize your own channel
  • Integrations with Google Analytics & tools
  • Subscribers, Likes, Sharing buttons
  • Free Live streaming
  • Powerful recommendation engine
  • Subtitle generation
  • Scheduling public videos
  • Advertising using uploaded videos

YouTube is almost the complete package when it comes to video marketing. But remember, YouTube’s business is keeping users on the site, so the tools they give you are designed to do just that. This can bring complications if the goal is to send users to your site. Which brings us to the pros and the cons to using YouTube as a platform.

Pros:

  • Massive userbase
  • No upload limits
  • Monetization options
  • Google search seo
  • Powerful analytical dashboards
  • Can upload almost anything

Cons:

  • Very competitive
  • Strict content ID system
  • Restrictions on linking interactive media
  • Very limited embedding options
  • No security on videos
  • Lacking support / help articles
  • Ads on the videos
  • Other channels are advertised with the recommendation engine

Don’t underestimate how difficult it will be to get a foothold on your target audience. Since YouTube’s so massive, there is a ton of competition to have the top video in the search results. Therefore, it’s important to know how your videos rank in the system. Applying plugins can help you understand and analyze your video rankings. We use VidIQ and TubeBuddy to help us with our rankings.

  • Tubebuddy: Allows users to quickly manage their YouTube channels and improve SEO, views, and subscriber growth. While it has some SEO features, it focuses more on Bulk updating and ease-of-use.
  • VidIQ: More focused on SEO, it has a more robust tagging system and a nice cleanly laid out interface. If SEO is what you want, look no further.

There’s no harm in using both as the “free” features are more than enough to get you going.  We do suggest paying the extra money for Tubebuddy as the features it adds are time saving especially on larger channels.

Vimeo pro

vimeo-smartphone-for-blog
Vimeo as video marketing platform

Vimeo is the closest competitor to YouTube with over 700 million active users. However, Vimeo caters to a completely different audience. Vimeo is considered the “professionals” choice when it comes to video hosting platforms. This is largely to do with the better compression and lack of ads on the site. A lot of Indy filmmaker content is found there, and they push that genre much higher than, say, a tutorial.
Regardless, It is another great video sharing platform that offers some unique features over its competitors.

  • No advertisements
  • A cleaner and more customizable layout
  • Wider range of embedding options
  • More interaction elements
  • Greater security for your content
  • Higher quality encoding
  • Branding customization
  • Hide videos from Vimeo and keep them public

The cons of using Vimeo:

  • Lower viewer numbers
  • No advertising options
  • Must pay for advanced features
  • Upload limits
  • Lacks automatic subtitle options
  • Lacks bulk updating
  • Limited integrations and 3rd party support
  • Live streaming is expensive
  • No scheduling options

Unlike YouTube’s features, Vimeo’s are not entirely free. Vimeo currently offers five membership plans, which vary in features and upload limits. With the free plan, you can see very basic analytics like:

  • The number of times your video was loaded
  • The number of plays, finishes, likes and comments
  • Your most popular videos

For a marketer, that is not good enough, so upgrading to a Pro plan allows you to see engagement and duration graphs. This makes the analytics much more like YouTube’s.

Depending on the content you produce, Vimeo is a great tool, but for gaining visibility, it may not be the right tool since YouTube has twice the users. It is also worth noting that YouTube is a Google product and Vimeo is not. This means Google will place YouTube videos much higher on search results than Vimeo, but sometimes Google will display the same video from both platforms.
youtube-vs-Vimeo-spiderman-meme
Comparison of Youtube and Vimeo
We use Vimeo more as an embedding tool than anything else. We aren’t trying to necessarily reach the audience on Vimeo, but the seamless embedding is an important tool for our website. It acheives the same goal at a cheaper price than other sites like:

It’s not outlandish to use both platforms, but because Vimeo requires a paid plan to get the deeper analytics, YouTube may still be a better choice.

Facebook

facebook-image-for-top-video-platforms-1
Facebook as video platform
Photo by William Iven on Unsplash

Facebook is the most popular social media site on the planet. With over 2 billion active users, it is not slowing down. When you think of video platforms, Facebook is not one of them, but it has recently been making steps in changing this fact. It is defiantly behind when it comes to the likes of Vimeo and YouTube especially in the metrics department. However, it has been busy adding new features that makes the platform hard to ignore.

Facebook features:

  • A New creator studio for video management and performance monitoring
  • Returning viewers vs new metrics
  • Metrics specific to Facebook news feed
  • Ad performance monitoring
  • Retire and backdate video posts
  • Facebook Live Streaming
  • Automatic Captioning

In recent years, Facebook has been pushing users to start uploading videos to their platform. With this push, they have been treating posts with YouTube and Vimeo links as thumbnails instead of imbedding the content. This explains why Facebook has been adding video tools so quickly. But as it is, Facebook is best used as a supplemental platform and not the main driver of your content.

Facebook pros:

  • 2 Billion users
  • Free Live Streaming
  • Free video tools
  • Has a multitude of apps that work with it
  • No Ads in videos

Facebook cons:

  • Closed platform (can’t embed posts)
  • No Google Search Results
  • Interface has a slight learning curve
  • Lacks depth in metrics
  • No interactive content

If you’re looking to market to Facebook users, it’s better to use Facebook’s native video hosting and not just because of the imbedding issues. Since Facebook videos don’t show up on web search results, Facebook is considered a closed garden in terms of video hosting. But that’s why Facebook should be supplemental to YouTube or Vimeo as it is a social media site first, video hosting second.

social-image-for-video-marketing-platforms

Other up and coming video platform options are:

None of these tools are perfect, each one has their pros and cons, audiences, and metrics. But using them together and understanding your data can provide you with the knowledge you need to continue putting out quality content. Take the time to understand the tools as well as the data they provide and see how you can use them to your advantage.

In the next blog, we will explore video metrics and how to manage them using online tools!

Luna Bell
| January 5, 2022

A list of top machine learning algorithms for marketers that can help to understand trends in user behavior, which further assist with SEO and marketing-based decisions on big data.

machine learning algorithms
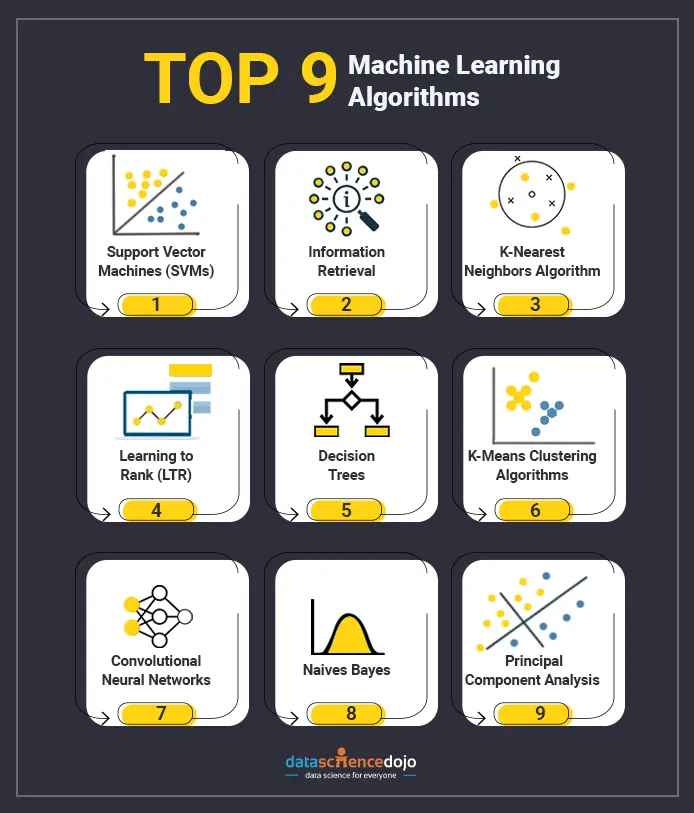
List of the top 9 ML algorithms

The way to advertise and manage your SEO is changing. The tools of the trade for marketers, product managers, and SMBS are ever-evolving. This next wave of MarTech has been ramping up and might put some of us out of business.

We should keep an eye on the cutting-edge machine learning in marketing and SEO and neural network (AI) technologies being used to make our market assessments more accurate, campaigns more successful, and our customers ultimately more satisfied. However, don’t get too lost in how the algorithms work. Just remember their purpose:

“Is the end-user getting the result they want based on how they’ve communicated their search query?”

Understanding how machine learning algorithms work is critical to maximizing ROI. Here are the top 9 machine learning algorithms that work to influence keyword ranking, ad design, content construction, and campaign direction:

1. Support Vector Machines (SVM)

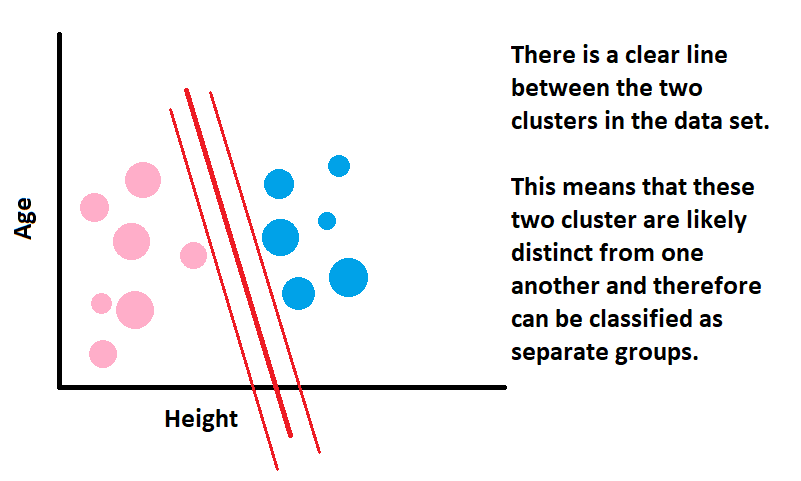
Classification is the process that facilitates segmentation. Simply put, SVMs are predictive algorithms used to classify customer data by feature, leading to segmentation. Features include anything from age and gender to purchase history and channels used.

SVM works by taking a set of features, plotting them in ‘n’ space  ̶ ̶  ‘n’ being the number of features  ̶  and trying to find a clear line of separation in the data. This creates classifications.

graph
Clusters made in Support Vector Machine

For example, Mailchimp is a popular customer relationship management (CMR) tool that uses its own proprietary algorithm to predict user behavior. This allows them to forecast which segments are likely to have high Customer Lifetime Values (LTV) and Costs Per Acquisition (CPA).

2. Information retrieval

Keywords, keywords, keywords…Sometimes the simplest solutions are the most powerful ones. A lot of ML algorithms designed to assess the market can be difficult to comprehend.

Information Retrieval algorithms — like the one that powers Google’s “Relevance Score” metric — use keywords to determine the accuracy of user queries. These types of algorithms are elegant, powerful, and to the point. Which is part of the reason why SEO software such as SE Ranking uses a version of it called Elasticsearch to provide marketers with a list of keywords built using input from the user. The RL algorithm’s basic process follows a 4-step process:

  • Get the user query

  • Break up the keywords

  • Pull a preliminary list of relevant documents

  • Apply a Relevance Score and rank each document

In step 4, The Relevance Score algorithm takes the sum of specific criteria:

  • Keyword Frequency (number of times the keyword appears in the document)

  • Inverse Document Frequency (if the keyword appears too often, it actually demotes the ranking)

  • Coordination (how many keywords from the original query appear in the document)

The algorithm then attaches a score that gets used to rank all of the documents retrieved in the preliminary pull.

3. K-Nearest neighbors algorithm

The K-Nearest Neighbors (K-NN) algorithm is one of the most basic of its kind. Also known as a “lazy learner algorithm,” K-NN classifies new data based on how similar it is to existing data points. Here’s how it works:

Say you have an image of some kind of fruit that resembles either a pear or an apple, and you want to know which of the two categories it belongs to. A KNN model will compare the features of the new fruit image to the datasets for pear images and the datasets of apple images and based on which category the new fruit’s features are most similar to, the model will sort the image into the respective category.

In a nutshell, that’s how the KNN algorithm works. It’s best used in instances where data need to be classified based on preset categories and defining characteristics.

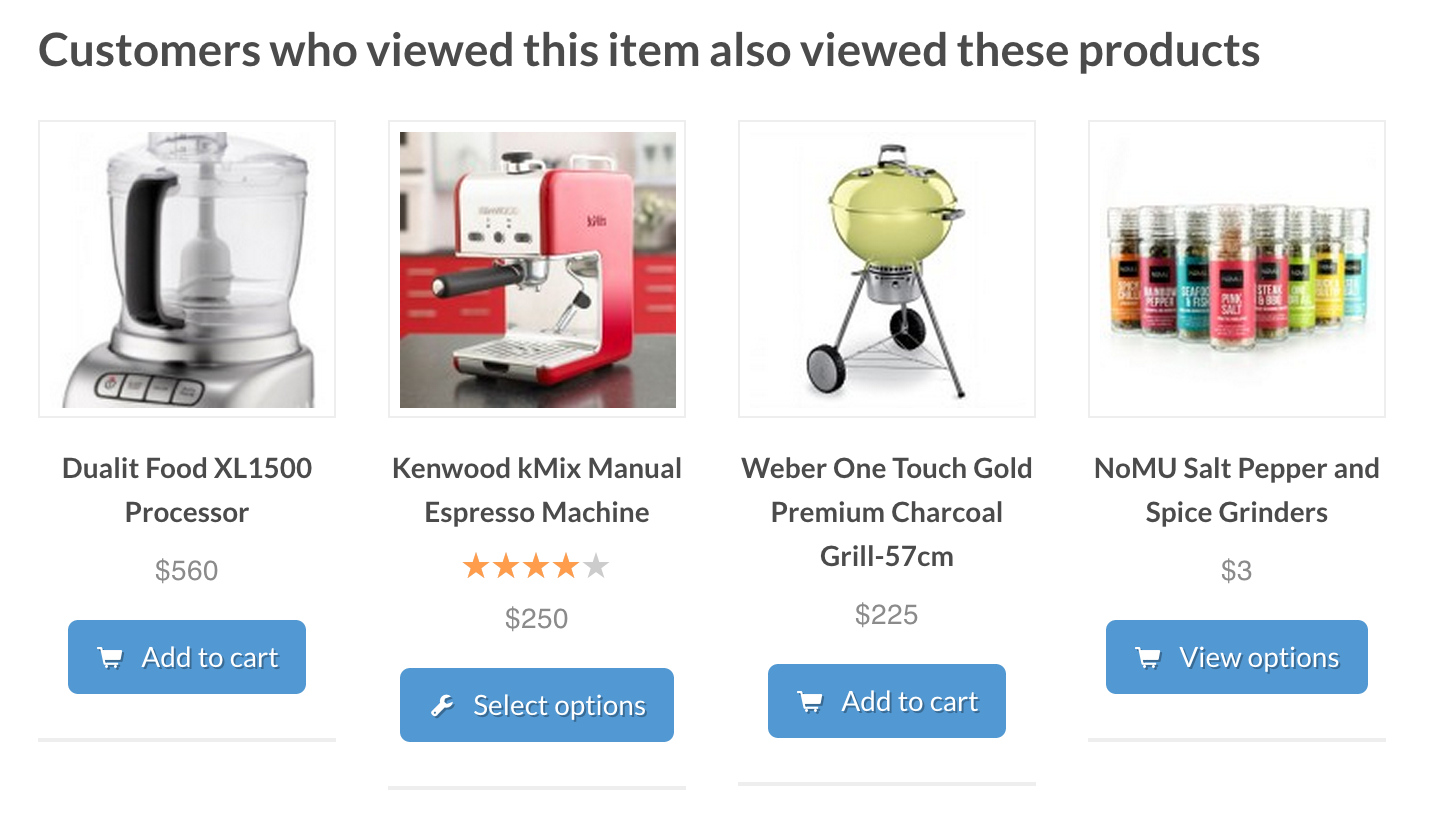
For example, KNN algorithms come in handy for recommendation systems such as the one you might find on an online video streaming platform, where suggestions are made based on what similar users are watching.

If you want to learn further how to implement a K-NN algorithm in Python, sign up for a training program to get you started with Python.

4. Learning to Rank (LTR)

The Learning to Rank class of algorithms is used to solve keyword search relevancy problems. Users expect their search results to populate a page and be ranked in order of relevancy. Companies like Wayfair and Slack use LTRs as part of their search query solutions.

The LTR can be separated into three methods — Pointwise, Pairwise, and Listwise.

Pointwise assesses the relevance score of one document against the keywords. Pairwise compares each document against the keywords and includes another document into the calculation for a more accurate score.

It’s like getting an ‘A’ on a test, but then you notice that the kid sitting next to you got one more correct question than you, and suddenly your ‘A’  isn’t so impressive. Listwise uses a more complicated algorithm based on probabilities to rank based on search result relevance.

5. Decision trees

Decision trees are used for predictive modeling. For a marketing analogy, as a user moves through a sales funnel, they’re likely to apply a few criteria:

  • Behavior-based triggers – the user clicked or opened a link or field;

  • Trait-based values – demographic, location, and affiliation information about the user;

  • Numerical Thresholds – having now spent X dollars, the user is more likely to spend ‘X+’ in the future.

The simplicity of decision trees makes them valuable for:

  • Classifications and regressions — plotting binary and floating values in the same model (ex. Gender vs. annual income);

  • Handling many parameters at once — each ‘node’ in a tree can represent a single parameter without the entire model being overwhelmed;

  • Visual and interpretive diagnostics — it’s easy to see patterns and relationships between values.

Word of caution: the more nodes you add to a decision tree, the less interpretive it becomes. You eventually start losing sight of the forest for the trees.

6. K-means clustering algorithms

K-means clustering algorithms are a part of unsupervised learning partitioning methods. In Layman’s terms, this means it’s a type of machine learning that can be used to break down unlabeled data into meaningful categories.

So, for example, if you owned a supermarket and wanted to divide your entire set of customers into smaller segments, you could use K-means clustering to identify different customer groups. This would then allow you to create specific marketing campaigns and promotions targeted to each of your customer segments, which would translate into more efficient use of your marketing budget.

What makes K-means clustering unique is that it allows you to predefine how many categories or “clusters” you’d like the algorithm to produce from the data.

7. Convolutional neural networks

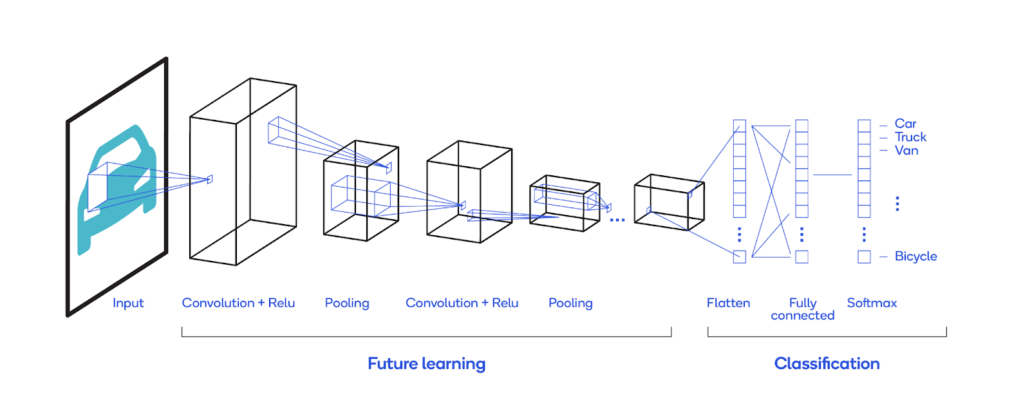
Convolutional Neural Networks, or CNN for short, are used to help computers look at images the way humans do.

Whereas a human can readily identify an apple when shown an image of an apple, computers merely see another set of numbers and identify an object based on the pattern of numbers that make up the object.

CNN work by training a computer to recognize those number patterns of an object by feeding it millions of images of the same object. With each new image, the computer improves its ability to spot the object.

Now that almost anyone can pull out their phone and take a picture wherever they are, it’s easy to imagine how powerful CNN can be for any kind of application that involves picking out objects from images.

For example, companies like Google leverage CNN for facial recognition, where a face can be matched with a name by observing the unique features of each face in an image. Similarly, CNN is being tested for use in document and handwriting analysis, as CNN can rapidly scan and compare an individual’s writing with results from big data.

Convolutional Neural Networks graph
Graph of Convolutional Neural Networks (CNN)

8. Naïve Bayes

The Naive Bayes (NB) algorithm is built on Bayes’ famous theorem that determines the probability of two outcomes — the probability of A, given B. What makes this algorithm so ‘Naive’ is that it is based on the assumption that the predictor variables are independent.

For marketers, this can be retooled to determine the possibility of a successful lead magnet, campaign, advertisement, segmentation, or keyword, given that you know the relevant features like height, age, purchase history, or big data concerning your customer base.

If you want to get into math, Great Learning gives a wonderful introduction here. Suffice to say, the NB algorithm answers two questions,

  • “Is this the type of person to perform X behavior?”

  • “Is this the type of content to achieve X outcome?”

NB is mighty when dealing with large amounts of text-based behavior data like customer chatter online.

Feeding customer dialogue through an NB algorithm helps predict product and service reviews, measure social media & influencer marketing sentiment for trends, and predict direct marketing response rates.

9. Principal component analysis

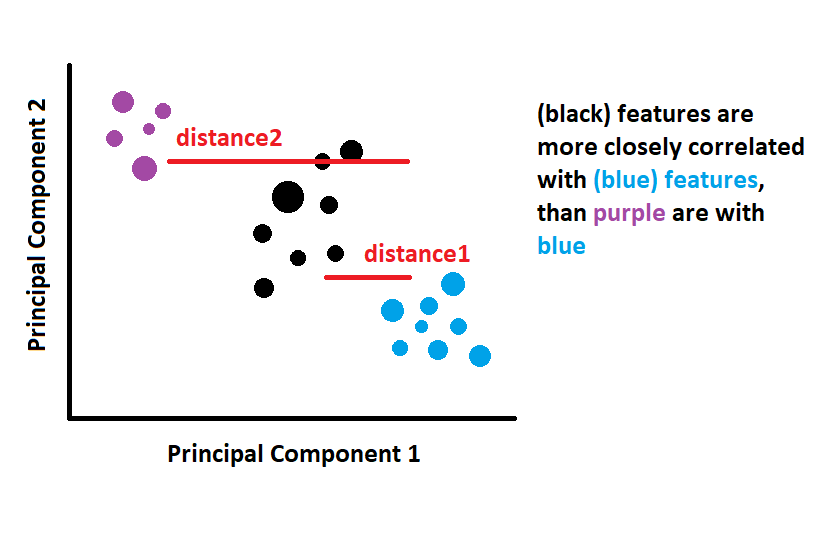
Classification leads to evolved segmentations. Principal Component Analysis is used to find strong or weak correlations between two components by plotting them on a graph and finding a trend line.

Principal Component Analysis
Graph of Principal Component Analysis (PCA)

But what happens when the target market comes with 30+ features? This is where the process of PCA in combination with machine learning becomes incredibly powerful for analyzing multivariate big data sets.

Instead of having two groups that correlate, you start to get clusters correlating with one another, where the distance between clusters now suggests strong or weak relationships.

For marketers, the component axes are no longer single features you choose but determined by the PCA algorithm.

Principal Component Analysis
Correlation in Graph of Principal Component Analysis

All of this helps to answer the question: “Which features are strongly correlated and can therefore be used for better segmentation targeting?”

It’s Not Over

Marketers, agencies, and SMBs will never stop asking for better tools to assess consumer sentiment and behavior.

Machine learning and neural network tools are never going to stop analyzing consumer markets and uncovering new insights. Marketers, agencies, and SMBs will always use these insights to ask for better tools to assess consumer sentiment and behavior.

It’s a feedback loop that you need to plug into if you’re going to be successful in the future  ̶ ̶  especially with the rise in online purchasing activity influenced by geopolitical factors.

Knowing how machine learning algorithms work and learning practical skills via our data science bootcamp will provide you with marketing insights and make you better at communicating ad, content, and campaign strategies to your staff, clients, and customers. This will ultimately lead you to better ROI.

Related Topics

Statistics
Resources
Programming
Machine Learning
LLM
High-Tech
Generative AI
DSD Insights
Development and Operations
Data Visualization
Data Security
Data Science
Data Engineering
Data Analytics
Computer Vision
Career
Artificial Intelligence

Finding our reads interesting?

Become a contributor today and share your data science insights with the community

Up for a Weekly Dose of Data Science?

Subscribe to our weekly newsletter & stay up-to-date with current data science news, blogs, and resources.