fbpx
Learn to build large language model applications: vector databases, langchain, fine tuning and prompt engineering. Learn more

Marketing analytics

Data Science Dojo
Emily Thompson
| June 22

Digital marketing and SEO have become essential as all businesses strive for a strong online presence to stay ahead of the curve.

For the unversed, SEO refers to search engine optimization, which helps websites stay at the top in the search engine results. This will improve the website’s visibility, traffic and conversions. Different SEO practices are employed to make it possible.

SEO in digital marketing
SEO in digital marketing – Source: Freepik

SEO practices demand technical knowledge and skills to execute them effectively. So, if you want to become a pro in SEO, you should consider joining a learning program. 

This blog will walk you through some of the best practices you should learn to make the website SEO optimized. So, let’s get started to learn to help your website rank at the top of the search engine results.  

6 best SEO practices to improve digital marketing initiatives   

1. Conduct keyword research 

The most fundamental part of SEO is keyword research. In this practice, you analyze the terms people use in the search engine. When you conduct keyword research , you will be able to identify the most popular and relevant keywords for your industry or niche and incorporate them into the content on your website. The keyword-optimized content will improve the website’s rank on the search engines. When you target those specific keywords, your website will come to the top when the users search for anything related to those keywords.  

Various tools are used to conduct keyword research effectively, such as Google Keyword Planner, SEMrush, and Ahrefs. When identifying the keywords, consider search volume, competition, and relevance factors.  

2. Optimize your website’s structure  

It is not only the content but the website structure as well that needs to be optimized. How search engines index your site depends heavily on its structure and navigation. It is simpler for search engines to comprehend and effectively index your site’s content if your website’s navigation and structure are optimized. 

Ensure your website’s structure is logically organized with proper categories and subcategories mentioned properly. This will make it easier for visitors and search engines to navigate your site and find the information they seek. One of the most essential SEO best practices is to use internal linking to connect the related pages on your site. This practice will help search engines understand the connectivity between the pages and improve your search engine rankings 

3. Create high-quality, relevant content 

All the SEO best practices will not be of no use if your website lacks this part. Content is the key to making your website SEO-optimized. Therefore, creating original and valuable content is the most important SEO practice. High-quality content will help you to drive more traffic towards your website and will make it more engaging.  

Before you publish content on your site, understand the needs and preferences of your target market. Make sure the content of your post is what they are looking for. You must understand your audience’s needs and preferences to create high-quality, relevant content. You can ensure this by researching the topics and formats that resonate with your target audience. Moreover, use the relevant keywords and effective on-page optimization to improve it. 

4. Use on-page optimization techniques 

On-page optimization involves the techniques used to optimize web pages. With these techniques, you ensure that your meta descriptions, meta titles, header tags, and image alt tags are optimized with relevant keywords and clearly describe your content. 

This is one of the effective SEO best practices that helps enhance your website’s relevancy and visibility on search engines. Search engines can better grasp the content of your website and rank it higher in search results by using important keywords in the page titles and descriptions. Moreover, using header and image alt tags makes your site more accessible and user-friendly. 

5. Build high-quality backlinks 

The links to the other websites placed on certain keywords on your website refer to backlinks. You can enhance your search engine ranking and the website’s authenticity by acquiring high-quality backlinks from reliable, pertinent websites. 

To develop high-quality backlinks, you must produce worthwhile content that other websites will want to connect to. You can achieve this by writing guest posts or producing excellent content. Moreover, you can also market your content and draw backlinks using social media and other digital marketing platforms. 

6. Monitor SEO analytics 

SEO analytics refers to analyzing the data to understand your website’s performance. This is the most essential practice because it results from all the other practices. Monitoring your website’s analytics helps you understand how visitors interact with your site and what can be done to improvise it. You can implement that data in your decisions to optimize your website’s performance and improve your search engine rankings. 

In SEO analytics, you basically analyze the tracking traffic, bounce rate, and engagement metrics. When you monitor the analytics regularly, you can identify which pages and content are performing well and which are not and take measures to make improvements.  

Wrap up!

SEO best practices are essential for all business websites striving for increased traffic and online exposure. By following the methods highlighted in the blog, you can up your SEO game and increase your chances of reaching the top in search results.

Make sure to keep up with the most recent trends and best to maintain your website’s competitiveness in the ever-evolving digital landscape. You may achieve long-term success and benefit from a strong online presence with the appropriate strategy and constant effort. 


Data Science Dojo
Srishti Puri
| August 3

How does Expedia determine the hotel price to quote to site users? How come Mac users end up spending as much as 30 percent more per night on hotels? Digital marketing analytics, a torrent flowing into all the corners of the global economy has revolutionized marketing efforts, so much so, that resetting it all together. It is safe to say that marketing analytics is the science behind persuasion.

Marketers can learn so much about the users, their likes, dislikes, goals, inspirations, drop-off points, inspirations, needs, and demands. This wealth of information is a gold mine but only for those who know how to use it. In fact, one of the top questions that marketing managers struggle with is


“Which metrics to track?” 


Furthermore, several platforms report on marketing, such as email marketing software, paid search advertising platforms, social media monitoring tools, blogging platforms, and web analytics packages. It is a marketer’s nightmare to be buried under sets of reports from different platforms while tracking a campaign all the way to conversion.

Definitely, there are smarter ways to track. But before we take a deep dive into how to track smartly, let me clarify why you should be investing half the time measuring while doing:

  • To identify what’s working
  • To identify what’s not working
  • Identify strategies to improve
  • Do more of what works

To gain a trustworthy answer to the aforementioned, you must: measure everything. While you attempt at it, arm yourself with the lexicon of marketing analytics to form statements that communicate results, for example:


“Twitter mobile drove 40% of all clicks this week on the corporate website” 

Every statement that you form to communicate analytics must state the source, segment, value, metric, and range. Let us break down the above example:

  • Source: Twitter
  • Segment: Mobile
  • Value: 40%
  • Metric: Clicks
  • Range: This week

To be able to report such glossy statements, you will need to get your hands dirty. You can either take a campaign-based approach or a goals-based approach.


Campaign-based approach to marketing analytics


In a campaign-based approach, you measure the impact of every campaign, for example, if you have social media platforms, blogs, and emails trying to get users to sign up for an e-learning course, this approach will enable you to get insight into each.

In this approach we will discuss the following in detail:

  1. Measure the impact on the website
  2. Measure the impact of SEO
  3. Measure the impact of paid search advertising
  4. Measure the impact of blogging efforts
  5. Measure the impact of social media marketing
  6. Measure the impact of e-mail marketing

Measure the impact on the website


  • Unique visitors

How to use: Unique visitors account for a fresh set of eyes on your site.  If the number of unique visitors is not rising, then it is a clear indication to reassess marketing tactics.


  • Repeat visitors

How to use: If you have visitors revisiting your site or a landing page, it is a clear indication that your site sticks or offers content people want to return to. But if your repeat visitor rate is high then it is indicative of your content not gauging new audiences.


  • Sources

How to use: Sources are of three types: organic, direct, and referrals. Learning about your traffic sources will give you clarity on your SEO performance. Also, it can help you find answers to questions like what is the percentage of organic traffic of total traffic?


  • Referrals

How to use: This is when the traffic arriving on your site is from another website. Aim for referrals to deliver 20-30% of your total traffic. Referrals can help you identify the types of sites or bloggers that are linking to your site and the type of content they tend to share. This information can be fed back into your SEO strategy, and help you produce relevant content that generates inbound links.


  • Bounce rate

How to use: High bounce rate indicates trouble. Maybe the content is not relevant, or the pages are not compelling enough. Perhaps the experience is not user-friendly. Or the call-to-action buttons are too confusing? A high bounce rate reflects problems, and the reasons can be many.


Measure the impact of SEO 

Similarly, you can measure the impact of SEO using the following metrics:


  • Keyword performance and rankings:

How to use: You can use tools like Google AdWords to identify keywords that optimize your website. Check if the chosen keywords are driving traffic to your site or if they are improving your site’s keywords.


  • Total traffic from organic search:

How to use: This metric is a mirror of how relevant your content is. Low traffic from the organic search may mean it is time to ramp up content creation – videos, blogs, webinars or expand into newer areas, such as e-books and podcasts that can be ranked higher by search engines.

Measure the impact of paid search advertising

Likewise, it is equally important to measure the impact of your paid search, also known as pay per click (PPC), in which you pay for every click that is generated by paid search advertising. How much are you spending in total? Are those clicks turning into leads? How much profit are you generating from this spend? Some of the following metrics can help you clarify:


  • Click through rate:

How to use: This metric helps you determine the quality of your ad. Is it effective enough to prompt a click? Test different copy treatments, headlines, and URLs to figure out the combination that boosts the CTR for a specific term.


  • Average cost per click:

How to use: Cost per click determines the amount you spend for each click on a paid search ad. Combine this conversion rate and earnings from the clicks.


  • Conversion rate:

How to use: Is conversion always a purchase? No! Each time a user takes the action you want them to do on your site, such as clicking on a button, signing up for a form, or subscribing, it is accounted as a conversion.


Measure the impact of blogging efforts 

Going beyond the website and SEO metrics, you can also measure the impact of your blogging efforts. Since a considerable amount of organizational resources is invested in creating blogs that can develop backlinks to the website. Some of the metrics that can get you clarity on whether you are generating relevant content:

  • Post Views
  • Call to action performance
  • Blog leads

Measure the impact of social media marketing

 Very well-known and quite widely implemented are the strategies to measure social media marketing. Especially now, as the e-commerce industry is expanding, social media can make or break your image online. Some of the commonly measured metrics are:

  • Reach
  • Engagement
  • Mentions to assess the brand perception
  • Traffic
  • Conversion rate


Measure the impact of e-mail marketing

Quite often, the marketing strategy runs on the crutches of e-mail. E-mails are a good place to start visibility efforts and can be very important in maintaining a sustainable relationship with your existing customer base. Some of the metrics that can help you clarify if your emails are working their magic or not are:

  • Bounce rate
  • Delivery rate
  • Click through rate
  • Share/forwarding rate
  • Unsubscribe rate
  • Frequency of emails sent

Goals-based approach

A goals-based approach is defined based on what you’re trying to achieve by a particular campaign. Are you trying to acquire new customers? Or build a loyal customer base, increase engagement, and improve conversion rate? Here are a few examples:

In this approach we will discuss the following in detail:

  • Audience analysis
  • Acquisition analysis
  • Behavioral analysis
  • Conversion analysis
  • A/B testing

 Audience analysis:

The goal is to know:


“Who are your customers?” 


Audience analysis is a measure that helps you gain clarity on who your customers are. The information can include demographics, location, income, age, and so forth. The following set of metrics can help you know your customers better.


  • Unique visitors
  • Lead score

  • Cookies

  • Segment

  • Label

  • Personally Identifiable Information (PII)
  • Properties

  • Taxonomy

Acquisition analysis:


The goal is to know:


“How do customers get to your website?” 


Acquisition analysis helps you understand which channel delivers the most traffic to your site or application. Comparing incoming visitors from different channels helps determine the efficacy of your SEO efforts on organic search traffic and see how well your email campaigns are running. Some of the metrics that can help you are:


  • Omnichannel

  • Funnel

  • Impressions

  • Sources

  • UTM parameters 

  • Tracking URL

  • Direct traffic

  • Referrers

  • Retargeting

  • Attribution

  • Behavioral targeting


Behavioral analysis:

 The goal is to know:


“What do the users do on your website?” 


Behavior analytics explains what customers do on your website. What pages do they visit? Which device do they use? From where do they enter the site? What makes them stay? How long do they stay? Where on the site did, they drop off? Some of the metrics that can help you gain clarity are:

  • Actions

  • Sessions

  • Engagement rate

  • Events

  • Churn

  • Bounce rate

Conversion analysis

The goal is to know:


“Whether customers take actions that you want them to take?” 


Conversions track whether customers take actions that you want them to take. This typically involves defining funnels for important actions — such as purchases — to see how well the site encourages these actions over time. Metrics that can help you gain more clarity are:

  • Conversion rate

  • Revenue report

A/B testing:

The goal is to know:


“What digital assets are likely to be the most effective for higher conversion?” 


A/B testing enables marketers to experiment with different digital options to identify which ones are likely to be the most effective. For example, they can compare one intervention (A Control Group) to another intervention (B). Companies run A/B experiments regularly to learn what works best.

In this article, we discussed what marketing analytics is, its importance, two approaches that marketers can take to report metrics and the marketing lingo they can use while reporting results. Pick the one that addresses your business needs and helps you get clarity on your marketing efforts. This is not an exhaustive list of all the possible metrics that can be used to measure.

Of course, there are more! But this can be a good starting point until the marketing efforts expand into a larger effort that has additional areas that need to be tracked.


Upgrade your data science skillset with our Python for Data Science and Data Science Bootcamp training!

Data Science Dojo
Gibran Saleem
| September 23

Marketing analytics tells you about the most profitable marketing activities of your business. The more effectively you target the right people with the right approach, the greater value you generate for your business.

However, it is not always clear which of your marketing activities are effective at bringing value to your business.  This is where marketing analytics comes in. Running an Amazon seller competitor analysis is crucial to your success in the marketplace. Using a framework to monitor your competitors’ efforts is a great way to ensure you can beat them at their own game.

It guides you to use the data to evaluate your marketing campaign. It helps you identify which of your activities are effective in engaging with your audience, improving user experience, and driving conversions. 

Grow your business with Data Science Dojo 


Marketing analytics
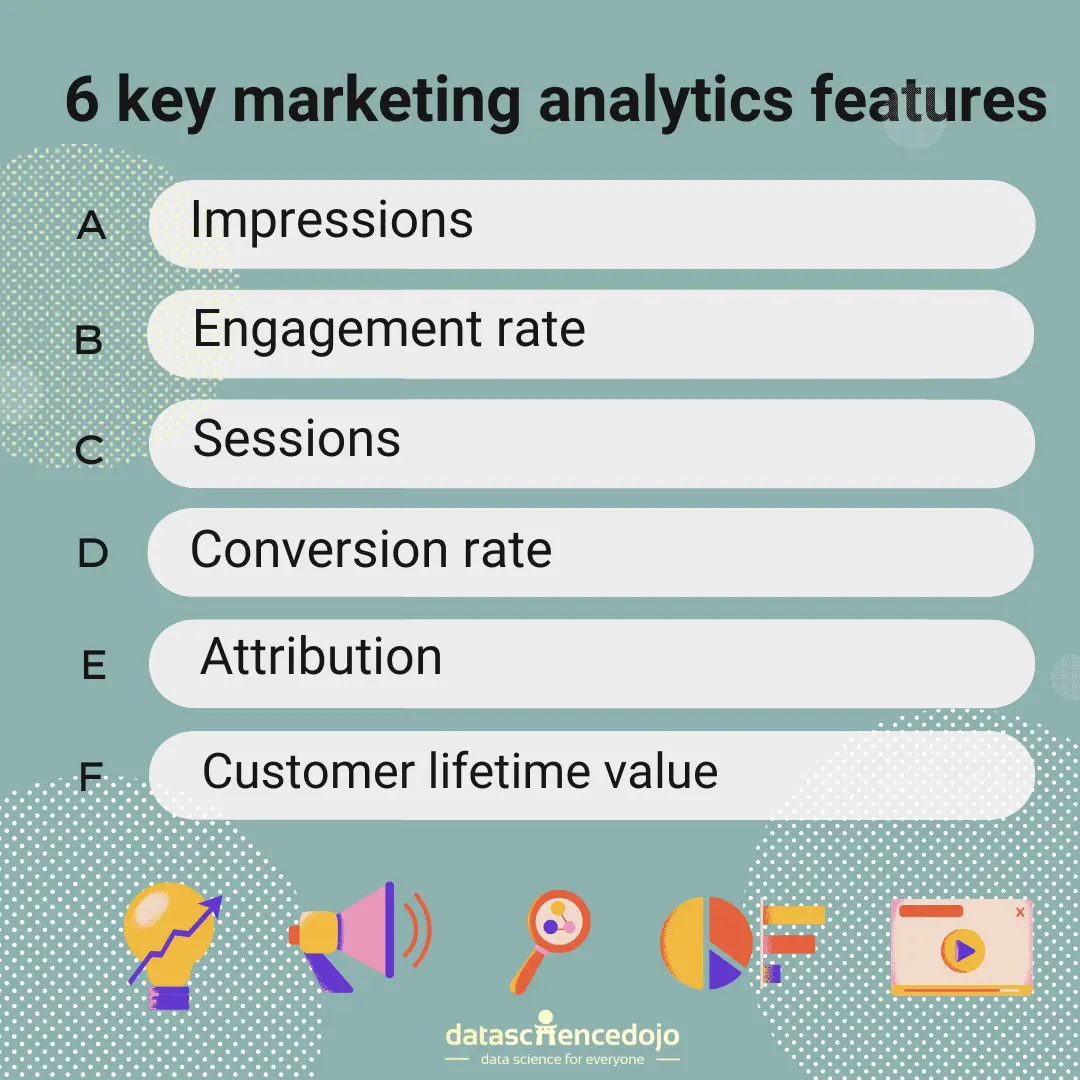
6 marketing analytics features by Data Science Dojo

Data driven marketing is imperative in optimizing your campaigns to generate a net positive value from all your marketing activities in real-time. Without analyzing your marketing data and customer journey, you cannot identify what you are doing right and what you are doing wrong when engaging with potential customers. The 6 features listed below can give you the start you need to get into analyzing and optimizing your marketing strategy using marketing analytics 

 Learn about marketing analytics tools in this blog

1. Impressions 

In digital marketing, impressions are the number of times any piece of your content has been shown on a person’s screen. It can be an ad, a social media post, video etc. However, it is important to remember that impressions do not mean views, a view is an engagement, anytime somebody sees your video that is a view, but an impression would also include anytime they see your video in the recommended videos on YouTube or in their newsfeed on Facebook. The impression will be counted regardless of whether they watch your video or not. 

Learn more about impressions in this video


It is also important to distinguish between impressions and reach. Reach is the number of unique viewers, so for example if the same person views your ad three times, you will have three impressions but a reach of one.  

Impressions and reach are important in understanding how effective your content was at gaining traction. However, these metrics alone are not enough to gauge how effective your digital marketing efforts have been, neither impressions nor reach tell you how many people engaged with your content. So, tracking impressions is important, but it does not specify whether you are reaching the right audience.  


2. Engagement rate 

In social media marketing, engagement rate is an important metric. Engagement is when a user comments, likes, clicks, or otherwise interacts with any of your content. Engagement rate is a metric that measures the amount of engagement of your marketing campaign relative to each of the following: 

  • Reach 
  • Post 
  • Impressions  
  • Days
  • Views 

Engagement rate by reach is the percentage of people who chose to interact with the content after seeing it. It is calculated by the following formula. Reach is a more accurate measurement than follower count, because not all of your brands followers may see the content while those who do not follow your brand may still be exposed to your content. 

Engagement rate by post is the rate at which followers engage with the content. This metric shows how engaged your followers are with your content. However, this metric does not account for organic reach and as your follower count goes up your engagement by post goes down. 

Engagement rate by Impressions is the rate of engagement relative to the number of impressions. If you are running paid ads for your brand, engagement rate by impressions can be used to gauge your ads effectiveness.  

Average Daily engagement rate tells you how much your followers are engaging with your content daily. This is suitable for specific use cases for instance, when you want to know how much your followers are commenting on your posts or other content. 

Engagement rate by views gives the percentage of people who chose to engage with your video after watching them. This metric however does not use unique views so it may double or triple count views from a single user. 

Learn more about engagement rate in this video


3. Sessions 

Sessions are another especially important metric in marketing campaigns that help you analyze engagement on your website. A session is a set of activities by a user within a certain period. For example, a user spent 10 minutes on your website, loading pages, interacting with your content and completed an interaction. All these activities will be recorded in the same 10-minute session.  

In Google Analytics, you can use sessions to check how much time a user spent on your website (session length), how many times they returned to your website (number of sessions), and what interactions users had with your website. Tracking sessions can help you determine how effective your campaigns were in directing traffic towards your website. 

If you have an E-commerce website another very helpful tool on Google Analytics is behavioral analytics. With behavioral analytics you see what key actions are driving purchases on your website. The sessions report can be accessed under conversions tab on Google Analytics. This report can help you understand user behaviors such as abandon carts. This allows you to target these users with targeted ads or offering incentives to complete their purchase. 

Learn more about sessions in this video


4. Conversion rate 

Once you have engaged your audience the next step in the customers’ journey is conversion. A conversion is when you make the customer or user complete a specific action. This desired action can be anything from a form submission, purchasing a product or subscribing to a service. The conversion rate is the percentage of visitors who completed the desired action.

So, if you have a form on your website and you want to find out what the conversion rate is. You would simply divide the number of form submissions by the number of visitors on that form’s page (Total conversions/total interactions). 


Conversion rate is a very important metric that helps you assess the quality of your leads. While you may generate a large number of leads or visitors, if you cannot get them to perform the desired action you may be targeting the wrong audience. Conversion rate can also help you gauge how effective your conversion strategy is, if you aren’t converting visitors, it might indicate that your campaign needs optimization. 


5. Attribution  

Attribution is a sophisticated model that helps you measure which channels are generating the most sales opportunities or conversions. It helps you assign credit to specific touchpoints on the customers journey and understand which touchpoints are driving conversions the most. But how do you know which touchpoint to attribute to a specific conversion?  Well, that depends on which attribution models you are using. There are four common attribution models. 

First touch attribution models assign all the credit to the first touchpoint that drove the prospect to your website. It focuses on the top of the marketing efforts funnel and tells you what is attracting people to your brand 

Last touch attribution models assign credit to the last touchpoint. It focuses on the last touchpoint the visitor interacted with before they converted. 

Linear attribution model assigns an equal weight to all the touchpoints in the buyer’s journey. 

Time decay attributions is based on how close the touchpoint is to the conversion, where a weighted percentage is assigned to the most recent touchpoints. This can be used when the buying cycle is relatively short. 

What model you use is based on what product or subscription you are selling and what is the length of your buyer cycle. While attribution is very important in identifying the effectiveness of your channels, to get the complete picture you need to look at how each touchpoint drives conversion. 

 Learn more about attribution in this video


6. Customer lifetime value 

Businesses prefer retaining customers over acquiring new ones, and one of the main reasons is that attracting new customers has a cost. The customer acquisition cost is the total cost that you incur as a business acquiring a customer. The customer acquisition cost is calculated by dividing the marketing and sales cost by the number of new customers. 

Learn more about CLV in this video


So, as a business, you must weigh the value of each customer with the associated acquisition cost. This is where the customer lifetime value or CLV comes in. The Customer lifetime value is the total value of your customer to your business during the period of your relationship.

The CLV helps you forecast your revenue as well, the larger the average CLV you have the better your forecasted revenue will be. CLV is calculated by dividing the annual revenue generated from customers by the average retention period (in years).  If your CAC is higher than your CLV, then you are on average losing money on every customer you make.

This presents a huge problem. Metrics like CAC and CLV are very important for driving revenue. They help you identify high-value customers and identify low value customers so you can understand how to serve these customers better. They help you make more informed decisions regarding your marketing effort and build a healthy customer base. 


 Integrate marketing analytics into your business 

Marketing analytics is a vast field. There is no one method that suits the needs of all businesses. Using data to analyze and drive your marketing and sales effort is a continuous effort that you will find yourself constantly improving upon. Furthermore, finding the right metrics to track that have a genuine impact on your business activities is a difficult task.

So, this list is by no means exhaustive, however the features listed here can give you the start you need to analyze and understand what actions are important in driving engagement, conversions and eventually value for your business.  


Data Science Dojo
Nathan Piccini
| December 18

From customer relationship management to tracking analytics, marketing tools are important in the modern world. Learn how to make the most of these tools.

What do you normally find in a toolbox? A hammer, screwdriver, nails, tape measure? If you’re building a bird house, these would be perfect for you, but what if you’re creating a marketing campaign? What tools do you want at your disposal? It’s okay if you can’t come up with any. We’re here to help.

These days marketing is all about data. Whether it’s a click on an email or an abandoned cart on Amazon, marketers are using data to better cater to the needs of the consumer. In order to analyze and use this data, marketers have a toolbox of their own.

So what are some of these tools and what do they offer? Here, at Data Science Dojo, we’ve come up with our top 5 marketing analytics tools for success.

Customer Relationship Management Platform (CRM)

CRM is a tool used for managing everything there is to know about the customer. It can track where/when a consumer visits your site, it tracks the interactions on your site, and creates profiles for leads. A few examples of CRMs are:

hubspot_logo

  • HubSpot, along with the two others listed above, took the idea of a CRM and made it into an all-inclusive marketing resort. Along with the traditional CRM uses, HubSpot can be used to:
  • Manage social media
  • Send mass email campaigns
  • View traffic, campaign, and customer analytics
  • Associate emails, blogs, and social media posts to specific marketing campaigns
  • Create workflows and sequences
  • Connect to your other analytics tools such as Google Analytics, Facebook Ads, Amazon seller competitor analysis, YouTube, and Slack.


HubSpot continues its effectiveness by creating reports allowing its users to analyze what is and isn’t working.

This is just a brief description revealing the tip of the iceberg of what HubSpot does. If you want see below the water line, visit its website.

Search Software

Search engine optimization (SEO) is the process of a website ranking on search engines. It’s how you are able to find everything you have ever searched for on Google. Search software helps marketers analyze how to best optimize websites for potential consumers to find.

A few search software companies are:


I would love to describe each one of the above businesses, but I only have experience with Moz. Moz focuses on a

“less invasive way (of marketing) where customers are earned rather than bought”.

In fact, its entire business is focused on upgraging your SEO. Moz offers 9 different services through its Moz Pro toolkit:

MOZ_Services

Personally,

I love the Moz Keyword Explorer. This is the tool I use to check different variations of titles, keywords, phrases, and hashtags. It gives four different scores, which you can see on the photo below.

keyword Search

Now, there’s not enough data to show the average monthly volume for my name, but, according to Moz, it wouldn’t be that difficult to rank higher than my competitors, people have a high likelihood of clicking, and the Priority explains that my name is not a “sweet spot” for high volume, low difficulty, and high CTR. In conclusion, using my name as a keyword to optimize the Data Science Dojo Blog probably isn’t the best idea.

Web Analytics Service

We can’t talk about marketing tools and not mention Web Analytics Services. These are one of the most important pieces of equipment in the marketer’s toolbox. Google Analytics (GA) is a free web analytics service that integrates your company’s website data into a neatly organized dashboard. I wouldn’t say GA is the be-all and end-all piece of equipment, and there are many different services and tools out there, however, it can’t be refuted that Google Analytics is a great tool to integrate into your company’s marketing strategy.

Some similar Web Analytics Services include:

Google-Analytics

Some of the analytics you’ll be able to understand are

  • Real time data – Who’s on your site right now? Where are the users coming from? What pages are they looking at?
  • Audience Information – Where do your users live, age range, interests, gender, new or returning visitor, etc.?
  • Acquisition – Where did they come from (Organic, Direct, Paid Ads, Referrals, Campaigns)? What day/time they landed on your website? What was the final url they visited before leaving? You can also link to any Google Ads campaigns you have running.
  • Behavior – What is the path people take to convert? How is your site speed? What events took place (Contact form submission, newsletter signup, social media share)?
  • Conversions – Are you attributing conversions by first touch, last touch, linear, or decay?


Understanding these metrics is very effective in narrowing down how users interact with your website.

Another way to integrate Google Analytics into your marketing strategy is by setting up goals. Goals are set up to track specific actions taken on your website. For example, you can set up goals to track purchases, newsletter signups, video plays, live chat, and social media shares.

If you want a more in-depth look at what Google Analytics can offer, you can learn the basics through their Analytics Academy.

Analysis_feedback

Analysis and Feedback Platform (A&F)

A&Fs are another great piece of equipment in the marketer’s toolbox; more specifically for looking at how users are interacting on your website. One such A&F, HotJar, does this in the form of heatmaps and recordings. HotJar’s integrated tracking pixel allows you to see how far users scroll on your website and what items were clicked the most.

You can also watch recordings of a user’s experience and even filter down to the url of the page you wish to track, (i.e. /checkout/). This allows you to really capture the user’s unique journey until they make a purchase. For each recording, you can view audience information such as geographical location, country, browser, operating system, and a documented list of user actions.

In addition to UX/UI metrics, you can also integrate polls and forms on your website for more intricate data about your users.

As a marketing manager, these tools really help to visualize all of my data in ways that can’t be displayed by a pivot table. And while I am a fervent user of these platforms, I must admit that it’s not the tool that makes the man, it’s the strategy.

To get the most use out of these platforms, you will need to understand what business problem you are trying to solve and what metrics are important to you.There is a lot of information that these dashboards can provide you. However, it’s up to you to filter through the noise. Not every accessible metric is applicable to you, so you will need to decide what is the most important for your marketing plan.

A few similar platforms include:

Experimentation Platforms

Experimentation platforms are a software for experimenting different variations of a sample. Its purpose is to run A/B tests, something HubSpot does, but these platforms dive head first into them.

Experimentation Platforms

Where HubSpot only tests versions A and B, experimentation platforms let you test versions A, B, C, D, E, F, ect. They don’t just test the different versions, they will also test different audiences and how they respond to each test version. Searching “definition experimentation platforms” is a good place to start in understanding what experimentation platforms are. I can tell you they are a dream come true for marketers who love to get their hands dirty in behavioral targeting.

Optimizely is one such example of a company offering in depth A/B testing. Optimizely’s goal is to let you spend more time experimenting with the customer experience and less time wading through statistics to learn what works and what doesn’t. If you are unsure what to do, you can test it with Optimizely.

Using companies like Optimizely or Split is just one way to experiment. Many name brand comapanies like  Netflix,  MicrosoftEbay, and Uber have all built their own experimentation platforms to use internally.

Not a perfect marketing tool

No one toolbox is perfect and everyone’s is going to be different. One piece of advice I can give is to always understand the problem before deciding which tool is best to solve the problem. You wouldn’t use a hammer to do a job that a drill would be more effective at right?

hammer-in-wall gif

You could, it just wouldn’t be the most efficient method. The same concept goes for marketing. Understanding the problem will help you know which tools should be in your toolbox.

Related Topics

Statistics
Resources
Programming
Machine Learning
LLM
Generative AI
Data Visualization
Data Security
Data Science
Data Engineering
Data Analytics
Computer Vision
Career
Artificial Intelligence