Complete the tutorial to revisit and master the fundamentals of decision trees and classification models, one of the simplest and easiest models to explain.
Introduction
Data Scientists use machine learning techniques to make predictions under a variety of scenarios. Machine learning can be used to predict whether a borrower will default on his mortgage or not, or what might be the median house value in a given zip code area. Depending upon whether the prediction is being made for a quantitative variable or a qualitative variable, a predictive model can be categorized as a regression model (e.g. predicting median house values) or a classification (e.g. predicting loan defaults) model.
Decision trees happen to be one of the simplest and easiest classification models to explain and, as many argue, closely resemble human decision-making.
This tutorial has been developed to help you revisit and master the fundamentals of decision tree classification models which are expanded on in Data Science Dojo’s data science bootcamp and online data science certificate program. Our key focus will be to discuss the:
- Fundamental concepts on data-partitioning, recursive binary splitting, nodes, etc.
- Data exploration and data preparation for building classification models
- Performance metrics for decision tree models – Gini Index, Entropy, and Classification Error.
The content builds your classification model knowledge and skills in an intuitive and gradual manner.
The scenario
You are a Data Scientist working at the Centers for Disease Control (CDC) Division for Heart Disease and Stroke Prevention. Your division has recently completed a research study to collect health examination data among 303 patients who presented with chest pain and might have been suffering from heart disease.
The Chief Data Scientist of your division has asked you to analyze this data and build a predictive model that can accurately predict patients’ heart disease status, identifying the most important predictors of heart failure. Once your predictive model is ready, you will make a presentation to the doctors working at the health facilities where the research was conducted.
The data set has 14 attributes, including patients’ age, gender, blood pressure, cholesterol level, and heart disease status, indicating whether the diagnosed patient was found to have heart disease or not. You have already learned that to predict quantitative attributes such as “blood pressure” or “cholesterol level”, regression models are used, but to predict a qualitative attribute such as the “status of heart disease,” classification models are used.
Classification models can be built using different techniques such as Logistic Regression, Discriminant Analysis, K-Nearest Neighbors (KNN), Decision Trees, etc. Decision Trees are very easy to explain and can easily handle qualitative predictors without the need to create dummy variables.
Although decision trees generally do not have the same level of predictive accuracy as the K-Nearest Neighbor or Discriminant Analysis techniques, They serve as building blocks for other sophisticated classification techniques such as “Random Forest” etc. which makes mastering Decision Trees, necessary!
We will now build decision trees to predict the status of heart disease i.e. to predict whether the patient has heart disease or not, and we will learn and explore the following topics along the way:
- Data preparation for decision tree models
- Classification trees using “rpart” package
- Pruning the decision trees
- Evaluating decision tree models
## You will need following libraries for this exercise
library(dplyr)
library(tidyverse)
library(ggplot2)
library(rpart)
library(rpart.plot)
library(rattle)
library(RColorBrewer)

## Following code will help you suppress the messages and warnings during package loading
options(warn = -1)
The data
You will be working with the Heart Disease Data Set which is available at UC Irvine’s Machine Learning Repository. You are encouraged to visit the repository and go through the data description. As you will find, the data folder has multiple data files available. You will use the processed.cleveland.data.
Let’s read the datafile into a data frame “cardio”
## Reading the data into "cardio" data frame
cardio <- read.csv("processed.cleveland.data", header = FALSE, na.strings = '?')
## Let's look at the first few rows in the cardio data frame
head(cardio)
| V1 |
V2 |
V3 |
V4 |
V5 |
V6 |
V7 |
V8 |
V9 |
V10 |
V11 |
V12 |
V13 |
V14 |
| 63 |
1 |
1 |
145 |
233 |
1 |
2 |
150 |
0 |
2.3 |
3 |
0 |
6 |
0 |
| 67 |
1 |
4 |
160 |
286 |
0 |
2 |
108 |
1 |
1.5 |
2 |
3 |
3 |
2 |
| 67 |
1 |
4 |
120 |
229 |
0 |
2 |
129 |
1 |
2.6 |
2 |
2 |
7 |
1 |
| 37 |
1 |
3 |
130 |
250 |
0 |
0 |
187 |
0 |
3.5 |
3 |
0 |
3 |
0 |
| 41 |
0 |
2 |
130 |
204 |
0 |
2 |
172 |
0 |
1.4 |
1 |
0 |
3 |
0 |
| 56 |
1 |
2 |
120 |
236 |
0 |
0 |
178 |
0 |
0.8 |
1 |
0 |
3 |
0 |
As you can see, this data frame doesn’t have column names. However, we can refer to the data dictionary, given below, and add the column names:
| Column Position |
Attribute Name |
Description |
Attribute Type |
| #1 |
Age |
Age of Patient |
Quantitative |
| #2 |
Sex |
Gender of Patient |
Qualitative |
| #3 |
CP |
Type of Chest Pain (1: Typical Angina, 2: Atypical Angina, 3: Non-anginal Pain, 4: Asymptomatic) |
Qualitative |
| #4 |
Trestbps |
Resting Blood Pressure (in mm Hg on admission) |
Quantitative |
| #5 |
Chol |
Serum Cholestrol in mg/dl |
Quantitative |
| #6 |
FBS |
(Fasting Blood Sugar>120 mg/dl) 1=true; 0=false |
Qualitative |
| #7 |
Restecg |
Resting ECG results (0=normal; 1 and 2 = abnormal) |
Qualitative |
| #8 |
Thalach |
Maximum heart Rate Achieved |
Quantitative |
| #9 |
Exang |
Exercise Induced Angina (1=yes; 0=no) |
Qualitative |
| #10 |
Oldpeak |
ST Depression Induced by Exercise Relative to Rest |
Quantitative |
| #11 |
Slope |
The slope of peak exercise st segment (1=upsloping; 2=flat; 3=downsloping) |
Qualitative |
| #12 |
CA |
Number of major vessels (0-3) colored by flourosopy |
Qualitative |
| #13 |
Thal |
Thalassemia (3=normal; 6=fixed defect; 7=reversable defect) |
Qualitative |
| #14 |
NUM |
Angiographic disease status (0=no heart disease; more than 0=no heart disease) |
Qualitative |
The following code chunk will add column names to your data frame:
## Adding column names to dataframe
names(cardio) <- c( "age", "sex", "cp", "trestbps", "chol","fbs", "restecg",
                           "thalach","exang", "oldpeak","slope", "ca", "thal", "status")
You are going to build a decision tree model to predict values under variable #14 status, the “angiographic disease status” which labels or classifies each patient as “having heart disease” or “not having heart disease.
Intuitively, we expect some of these other 13 variables to help us predict the values under status. In other words, we expect variables #1 to #13, to segment the patients or create partitions in the cardio data frame in a manner that any given partition (or segment) thus created either has patients as “having heart disease” or “not having heart disease.
Data preparation for decision trees
It is time to get familiar with the data. Let’s begin with data types.
## We will use str() function
str(cardio)
'data.frame':	303 obs. of  14 variables:
 $ age      : num  63 67 67 37 41 56 62 57 63 53 ...
 $ sex      : num  1 1 1 1 0 1 0 0 1 1 ...
 $ cp       : num  1 4 4 3 2 2 4 4 4 4 ...
 $ trestbps : num  145 160 120 130 130 120 140 120 130 140 ...
 $ chol     : num  233 286 229 250 204 236 268 354 254 203 ...
 $ fbs      : num  1 0 0 0 0 0 0 0 0 1 ...
 $ restecg  : num  2 2 2 0 2 0 2 0 2 2 ...
 $ thalach  : num  150 108 129 187 172 178 160 163 147 155 ...
 $ exang    : num  0 1 1 0 0 0 0 1 0 1 ...
 $ oldpeak  : num  2.3 1.5 2.6 3.5 1.4 0.8 3.6 0.6 1.4 3.1 ...
 $ slope    : num  3 2 2 3 1 1 3 1 2 3 ...
 $ ca       : num  0 3 2 0 0 0 2 0 1 0 ...
 $ thal     : num  6 3 7 3 3 3 3 3 7 7 ...
 $ status   : int  0 2 1 0 0 0 3 0 2 1 ...
As you can see, some qualitative variables in our data frame are included as quantitative variables
- status is declared as $$ which makes it a quantitative variable but we know disease status must be qualitative
- You can see that sex, cp, fbs, restecg, exang, slope, ca, and thal too
must be qualitative
The next code-chunk will convert and correct the datatypes:
## We can use lapply to convert data types across multiple columns
cardio[c("sex", "cp", "fbs","restecg", "exang",
                     "slope", "ca", "thal", "status")] <- lapply(cardio[c("sex", "cp", "fbs","restecg",
                                                                         "exang", "slope", "ca", "thal", "status")], factor)
## You can verify the data frame
str(cardio)
'data.frame':	303 obs. of  14 variables:
 $ age     : num  63 67 67 37 41 56 62 57 63 53 ...
 $ sex     : Factor w/ 2 levels "0","1": 2 2 2 2 1 2 1 1 2 2 ...
 $ cp      : Factor w/ 4 levels "1","2","3","4": 1 4 4 3 2 2 4 4 4 4 ...
 $ trestbps: num  145 160 120 130 130 120 140 120 130 140 ...
 $ chol    : num  233 286 229 250 204 236 268 354 254 203 ...
 $ fbs     : Factor w/ 2 levels "0","1": 2 1 1 1 1 1 1 1 1 2 ...
 $ restecg : Factor w/ 3 levels "0","1","2": 3 3 3 1 3 1 3 1 3 3 ...
 $ thalach : num  150 108 129 187 172 178 160 163 147 155 ...
 $ exang   : Factor w/ 2 levels "0","1": 1 2 2 1 1 1 1 2 1 2 ...
 $ oldpeak : num  2.3 1.5 2.6 3.5 1.4 0.8 3.6 0.6 1.4 3.1 ...
 $ slope   : Factor w/ 3 levels "1","2","3": 3 2 2 3 1 1 3 1 2 3 ...
 $ ca      : Factor w/ 4 levels "0","1","2","3": 1 4 3 1 1 1 3 1 2 1 ...
 $ thal    : Factor w/ 3 levels "3","6","7": 2 1 3 1 1 1 1 1 3 3 ...
 $ status  : Factor w/ 5 levels "0","1","2","3",..: 1 3 2 1 1 1 4 1 3 2 ...
Also, note that status has 5 different values viz. 0, 1, 2, 3, 4. While status = 0, indicates no heart disease, all other values under status indicate a heart disease. In this exercise, you are building a decision tree model to classify each patient as “normal”(not having heart disease) or “abnormal” (having heart disease)”.
Therefore, you can merge status = 1, 2, 3, and 4 into a single-level status = “1”. This way you will convert status into a Binary or Dichotomous variable having only two values status = “0” (normal) and status = “1” (abnormal)
Let’s do that!
##  We will use the 'forcats' package included in the s'tidyverse' package
##  The function to be used will be fct_collpase
cardio$status <- fct_collapse(cardio$status, "1" = c("1","2", "3", "4"))


## Let's also change the labels under the "status" from (0,1) to (normal, abnormal)
levels(cardio$status) <- c("normal", "abnormal")

## levels under sex can also be changed to (female, male)
## We can change level names in other categorical variables as well but we are not doing that
levels(cardio$sex) <- c("female", "male")
So, you have corrected the data types. What’s next?
How about getting a summary of all the variables in the data?
## Overall summary of all the columns
summary(cardio)
      age            sex      cp         trestbps          chol       fbs
 Min.   :29.00   female: 97   1: 23   Min.   : 94.0   Min.   :126.0   0:258
 1st Qu.:48.00   male  :206   2: 50   1st Qu.:120.0   1st Qu.:211.0   1: 45
 Median :56.00                3: 86   Median :130.0   Median :241.0
 Mean   :54.44                4:144   Mean   :131.7   Mean   :246.7
 3rd Qu.:61.00                        3rd Qu.:140.0   3rd Qu.:275.0
 Max.   :77.00                        Max.   :200.0   Max.   :564.0

 restecg    thalach      exang      oldpeak     slope      ca        thal
 0:151   Min.   : 71.0   0:204   Min.   :0.00   1:142   0   :176   3   :166
 1:  4   1st Qu.:133.5   1: 99   1st Qu.:0.00   2:140   1   : 65   6   : 18
 2:148   Median :153.0           Median :0.80   3: 21   2   : 38   7   :117
         Mean   :149.6           Mean   :1.04           3   : 20   NA's:  2
         3rd Qu.:166.0           3rd Qu.:1.60           NA's:  4
         Max.   :202.0           Max.   :6.20

       status
 normal  :164
 abnormal:139
Did you notice the missing values (NAs) under the ca and thal columns? With the following code, you can count the missing values across all the columns in your data frame.
# Counting the missing values in the datframe
sum(is.na(cardio))
6
Only 6 missing values across 303 rows which is approximately 2%. That seems to be a very low proportion of missing values. What do you want to do with these missing values, before you start building your decision tree model?
- Option 1: discard the missing values before training.
- Option 2: rely on the machine learning algorithm to deal with missing values during the model training.
- Option 3: impute missing values before training.
For most learning methods, Option 3 the imputation approach is necessary. The simplest approach is to impute the missing values by the mean or median of the non-missing values for the given feature.
The choice of Option 2 depends on the learning algorithm. Learning algorithms such as CART and rpart simply ignore missing values when determining the quality of a split. To determine, whether a case with a missing value for the best split is to be sent left or right, the algorithm uses surrogate splits. You may want to read more on this here.
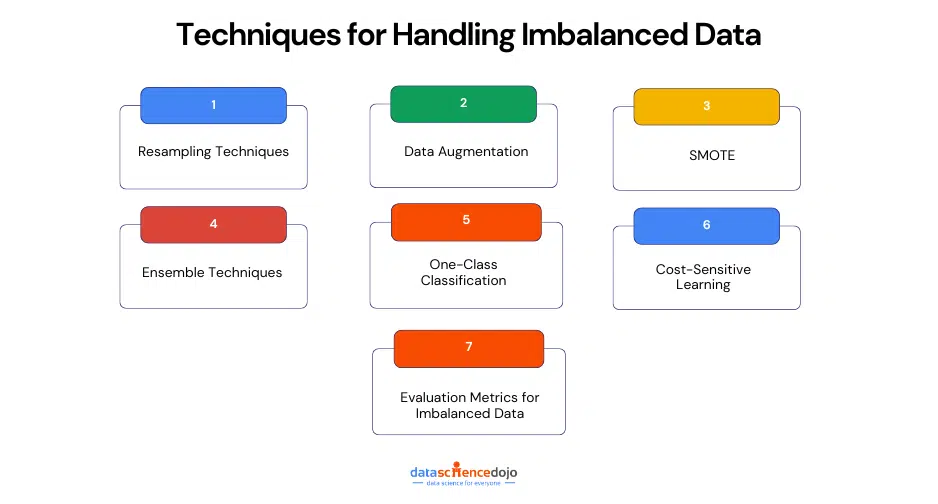
However, if the relative amount of missing data is small, you can go for Option 1 and discard the missing values as long as it doesn’t lead to or further alleviate the class imbalance which is briefly discussed in the following section.
As for your data set, you are safe to delete missing value cases. The following code-chunk does that for you.
## Removing missing values
cardio <- na.omit(cardio)
Data exploration
Status is the variable that you want to predict with your model. As we have discussed earlier, other variables in the cardio dataset should help you predict status.
For example, amongst patients with heart disease, you might expect the average value of Cholesterol levels (chol), to be higher than amongst those who are normal. Likewise, amongst patients with high blood sugar (fbs = 1), the proportion of patients with heart disease would be expected to be higher than what it is amongst normal patients. You can do some data visualization and exploration.
You may want to start with a distribution of status. The following code-chunk will provide you with:
## plotting a histrogram for status
cardio %>%
          ggplot(aes(x = status)) +
          geom_histogram(stat = 'count', fill = "steelblue") +
          theme_bw()
From this histogram, you can observe that there is almost an equal split between patients having status as normal and abnormal.
This may not always be the case. There might be datasets in which one of the classes in the predicted variable has a very low proportion. Such datasets are said to have a class imbalance problem where one of the classes in the predicted variable is rare within the dataset.
A Credit Card Fraud Detection Model or a Mortgage Loan Default Model are some examples of classification models that are built with a dataset having a class imbalance problem. What other scenarios come to your mind?
You are encouraged to read this article: ROSE: A Package for Binary Imbalanced Learning
You should now explore the distribution of quantitative variables. You can make density plots with frequency counts on the Y-axis and split the plot by the two levels in the status variable.
The following code will produce the plots arranged in a grid of 2 rows
## frequency plots for quantitative variables, split by status
cardio %>%
  gather(-sex, -cp, -fbs, -restecg, -exang, -slope, -ca, -thal, -status, key = "var", value = "value") %>%
            ggplot(aes(x = value, y = ..count.. , colour = status)) +
            scale_color_manual(values=c("#008000", "#FF0000"))+
            geom_density() +
            facet_wrap(~var, scales = "free",  nrow = 2) +
            theme_bw()
What are your observations from the quantitative plots? Some of your observations might be:
- In all the plots, as we move along the X-axis, the abnormal curve, mostly but not always, lies below the normal curve. You should expect this, as the total number of patients with abnormal is
smaller. However, for some values on the X-axis (which could be smaller values of X or larger, depending upon the predictor), the abnormal curve lies above.
- For example, look at the age plot. Till x = 55 years, the majority of patients are included in the normal curve. Once x > 55 years, the majority goes to patients
with
abnormal and remains so until x = 68 years. Intuitively, age could be a good predictor of status and you may want to partition the data at x = 55 years
and then again at x = 68 years. When you build your decision tree model, you may expect internal nodes with x > 55 years and x > 68 years.
- Next, observe the plot for chol. Except for a narrow range (x = 275 mg/dl to x = 300 mg/dl), the normal curve always lies above the abnormal curve. You may want to
form a hypothesis that Cholesterol is not a good predictor of status. In other words, you may not expect chol to be amongst the earliest internal nodes in your decision
tree model.
Likewise, you can make hypotheses for other quantitative variables as well. Of course, your decision tree model will help you validate your hypothesis.
Now you may want to turn your attention to qualitative variables.
## frequency plots for qualitative variables, split by status
cardio %>%
       gather(-age, -trestbps, -chol, -thalach, -oldpeak, -status, key = "var", value = "value") %>%
        ggplot(aes(x = value, color = status)) +
         scale_color_manual(values=c("#008000", "#FF0000"))+
          geom_histogram(stat = 'count', fill = "white") +
          facet_wrap(~var, nrow = 3) +
          facet_wrap(~var, scales = "free",  nrow = 3) +
          theme_bw()
What are your observations from the qualitative plots? How do you want to partition data along the qualitative variables?
- Observe the cp or the chest pain plot. The presence of asymptotic chest pain indicated by cp = 4, could provide a partition in the data and could be among the earliest nodes in your decision tree.
- Likewise, observe the sex plot. Clearly, the proportion of abnormal is much lower (approximately 25%) among females compared to the proportion among males (approximately
50%). Intuitively, sex might also be a good predictor and you may want to partition the patients’ data along sex. When you build your decision tree model, you may expect internal nodes with sex.
At this point, you may want to go back to both plots and list down the partition (variables and, more importantly, variable values) that you expect to find in your decision tree model.
Of course, all our hypotheses will be validated once we build our decision tree model.
Partitioning data: Training and test sets
Before you start building your decision tree, split the cardio data into a training set and test set:
cardio.train: 70% of the dataset
cardio.test: 30% of the dataset
The following code-chunk will do that:
## Now you can randomly split your data in to 70% training set and 30% test set
## You should set seed to ensure that you get the same training vs/ test split every time you run the code
set.seed(1)

## randomly extract row numbers in cardio dataset which will be included in the training set
train.index <- sample(1:nrow(cardio), round(0.70*nrow(cardio),0))

## subset cardio data set to include only the rows in train.index to get cardio.train
cardio.train <- cardio[train.index, ]

## subset cardio data set to include only the rows NOT in train.index to get cardio.test
## Did you note the negative sign?
cardio.test <- cardio[-train.index,  ]
Classification trees using rpart
“rpart” Package
You will now use rpart package to build your decision tree model. The decision tree that you will build, can be plotted using packages rpart.plot or rattle which provides better-looking plots.
You will use function rpart() to build your decision tree model. The function has the following key arguments:
formula: rpart(, …)
The formula where you declare what predictors you are using in your decision tree. You can specify status ~. to indicate that you want to use all the predictors in your decision tree.
method: rpart(method = < >, …)
The same function can be used to build a decision tree as well as a regression tree. You can use “class” to specify that you are using rpart() function for building a classification tree. If you were building a regression tree, you would specify “anova” instead.
cp rpart(cp = <>,…)
The main role of the Complexity Parameter (cp) is to control the size of the decision tree. Any split that does not reduce the tree’s overall complexity by a factor of cp is not attempted. The default value is 0.01. A value of cp = 1 will result in a tree with no splits. Setting cp to negative values ensures a fully grown tree.
minsplit rpart( minsplit = <>, …)
The minimum number of observations must exist in a node in order for a split to be attempted. The default value is 20.
minbucket rpart( minbucket = <>, …)
The minimum number of observations in any terminal node. If only one minbucket or minsplit is specified, the code either sets minsplit to minbucket*3 or minbucket to minsplit/3, which is the default.
You are encouraged to read the package documentation rpart documentation
You can build a decision tree using all the predictors and with a cp = 0.05. The following code chunk will build your decision tree model:
## using all the predictors and setting cp = 0.05
cardio.train.fit <- rpart(status ~ . , data = cardio.train, method = "class", cp = 0.05)
It is time to plot your decision tree. You can use the function rpart.plot() for plotting your tree. However, the function fancyRpartPlot() in the rattle package is more ‘fancy’
## Using fancyRpartPlot() from "rattle" package
fancyRpartPlot(cardio.train.fit, palettes = c("Greens", "Reds"), sub = "")
Interpreting decision tree plot
What are your observations from your decision tree plot?
Each square box is a node of one or the other type (discussed below):
Root Node cp = 1, 2, 3: The root node represents the entire population or 100% of the sample.
Decision Nodes thal = 3, and ca = 0: These are the two internal nodes that get split up either in further internal nodes or in terminal nodes. There are 3 decision nodes here.
Terminal Nodes (Leaf): The nodes that do not split further are called terminal nodes or leaves. Your decision tree has 4 terminal nodes.
The decision tree plot gives the following information:
Predictors Used in Model: Only the thal, cp, and ca variables are included in this decision tree.
Predicted Probabilities: Predicted probability of a patient being normal or abnormal. Note that the two probabilities add to 100%, at each node.
Node Purities: Each node has two proportions written left and right. The leftmost leaf has 0.82 and 0.18. The number on the left, 0.82 tells you what proportion of the node actually belongs to the predicted class. You can see that this leaf has 82% purity.
Sample Proportion: Each node has a proportion of the sample. The proportion is 100% for the root node. The percentages under the split nodes add up to give the percentage in their parent node.
Predicted class: Each node shows the predicted class as normal or abnormal. It is the most commonly occurring predictor class in that node but the node might still include observations belonging to the other predictor class as well. This forms the concept of node impurity.
Fully grown decision tree
Is this the fully-grown decision tree?
No! Recall that you have grown the decision tree with the default value of cp = 0.05 which ensures that your decision tree doesn’t include any split that does not decrease the overall lack of fit by a factor of 5%.
However, if you change this parameter, you might get a different decision tree. Run the following code-chunk to get the plot of a fully grown decision tree, with a cp = 0
## using all the predictors and setting all other arguments to default
cardioFull <- rpart(status ~ . , data = cardio.train, method = "class", cp = 0)

## Using fancyRpartPlot() from "rattle" package
fancyRpartPlot(cardioFull, palettes = c("Greens", "Reds"),sub = "")
The fully grown tree adds two more predictors thal and oldpeak to the tree that you built earlier. Now you have seen that changing the cp parameter, gives a decision tree of different sizes – more nodes and/or more leaves. At this stage, you might want to ask the following questions:
- Which of the two decision trees you should go ahead with and present to your division’s Chief Data Scientist? The one developed with a default value of cp = 0.01 or the one with cp = 0?
- Does a bigger decision tree present a better classification model or worse?
- Is the default value of cp = 0.01, the best possible?
- How would you select a cp value that ensures the best-performing decision tree model
There are no thumb rules on how large or small a decision tree should grow. However, you should be aware that:
- A large tree might overfit the data and thus might lead to a model with high variance
- A small tree might miss important parameters and thus might lead to a model with a high bias
So, which of the two decision trees you should present to your division’s Chief Data Scientist? What are the parameters that you can control to build your best decision tree? What are the metrics that you can use to justify the performance of your decision tree model? Conversely, what are the metrics that can help you evaluate the performance of your decision tree model?
Pruning the decision trees
The optimal tree size is chosen adaptively from the training data. The recommended approach is to build a fully-grown decision tree and then extract a nested sub-tree (prune it) in a way that you are left with a tree that has minimal node impurities.
As you have learned in your in-class module, there are three different metrics to calculate the node impurities that can be used for a given node m:
Gini Index:
A measure of total variance across all the classes in the predictor variable. A smaller value of G indicates a purer or more homogeneous node.
Here, Pmk gives the proportion of training observations in the mth region that are from the kth class.
Cross-Entropy or Deviance:
Another measure of node impurity:
As with the Gini index, the mth node is purer if the entropy D is smaller.
In your fitted decision tree model, there are two classes in the predictor variable therefore K = 2 and there are m = 5 regions.
Misclassification Error:
The fraction of the training observations in the mth node that do not belong to the most common class:
When growing a decision tree, Gini Index or Entropy is typically used to evaluate the quality of the split.
However, for pruning the tree, a Misclassification Error is used.
You can now get back to the fully grown decision tree that you built with cp = 0.
The Complexity Parameter Table will help you evaluate the fitted decision tree model. For your decision tree cardio.train.full, you can print the complexity parameter table using printcp() as well as plot using plotcp()
The CP table will help you select the decision tree that minimizes the misclassification error. CP table lists down all the trees nested within the fitted tree. The best-nested sub-tree can then be extracted by selecting the corresponding value for cp.
The following code will print the CP table for you:
## printing the CP table for the fully-grown tree
printcp(cardioFull)
Classification tree:
rpart(formula = status ~ ., data = cardio.train, method = "class",
    cp = 0)

Variables actually used in tree construction:
[1] ca      cp      oldpeak thal    thalach

Root node error: 95/208 = 0.45673

n= 208

        CP nsplit rel error  xerror     xstd
1 0.536842      0   1.00000 1.00000 0.075622
2 0.063158      1   0.46316 0.52632 0.064872
3 0.031579      3   0.33684 0.38947 0.058056
4 0.015789      4   0.30526 0.35789 0.056138
5 0.000000      6   0.27368 0.36842 0.056794
The plotcp() gives a visual representation of the cross-validation results in an rpart object.
## plotting the cp
plotcp(cardioFull, lty = 3, col = 2, upper = "splits" )
CP table
How do we interpret the cp table? What is your objective here?
Your objective is to prune the fitted tree i.e. select a nested sub-tree from this fitted tree, such that the cross-validated error or the xerror is the minimum.
The Complexity table for your decision tree lists down all the trees nested within the fitted tree. The complexity table is printed from the smallest tree possible (nsplit = 0 i.e. no splits) to the largest one (nsplit = 8, eight splits). The number of nodes included in the sub-tree is always 1+ the number of splits.
For easier reading, the error columns have been scaled so that the first node (nsplit = 0) has an error of 1. In your decision tree the model with no splits makes 123/267 misclassifications, you can multiply the columns rel error, xerror, and xstd by 123 to get the absolute values. In the first column, the complexity parameter has been similarly scaled. From the cp table we want to select the cp value that minimizes the cross-validated error (xerror).
CP plot
plotcp() gives a visual representation of the CP table. The Y-axis of the plot has the xerrors and the X-axis has the geometric means of the intervals of cp values, for which pruning is optimal. The red horizontal line is drawn 1-SE above the minimum of the curve. A good choice of cp for pruning is typical, the leftmost value for which the mean lies below the red line.
The following code chunk will help you select the best cp from the cp table
## selecting the best cp, corresponding to the minimum value in xerror
bestcp <- cardioFull$cptable[which.min(cardioFull$cptable[,"xerror"]),"CP"]

## print the best cp
bestcp
0.0157894736842105
You can now use this bestcp to prune the fully-grown decision tree
## Prune the tree using the best cp.
cardio.pruned <- prune(cardioFull, cp = bestcp)
## You can now plot the pruned tree
fancyRpartPlot(cardio.pruned, palettes = c("Greens", "Reds"), sub = "")
You can use the summary() function to get a detailed summary of the pruned decision tree. It prints the call, the table shown by printcp, the variable importance (summing to 100), and details for each node (the details depend on the type of tree).
## printing the
summary(cardio.pruned)
Call:
rpart(formula = status ~ ., data = cardio.train, method = "class",
    cp = 0)
  n= 208

          CP nsplit rel error    xerror       xstd
1 0.53684211      0 1.0000000 1.0000000 0.07562158
2 0.06315789      1 0.4631579 0.5263158 0.06487215
3 0.03157895      3 0.3368421 0.3894737 0.05805554
4 0.01578947      4 0.3052632 0.3578947 0.05613824

Variable importance
      cp     thal    exang  thalach       ca  oldpeak trestbps      age
      28       17       14       13       12       12        3        2
     sex
       1

Node number 1: 208 observations,    complexity param=0.5368421
  predicted class=normal    expected loss=0.4567308  P(node) =1
    class counts:   113    95
   probabilities: 0.543 0.457
  left son=2 (109 obs) right son=3 (99 obs)
  Primary splits:
      cp      splits as  LLLR,      improve=34.19697, (0 missing)
      thal    splits as  LRR,       improve=31.59722, (0 missing)
      exang   splits as  LR,        improve=23.76356, (0 missing)
      ca      splits as  LRRR,      improve=21.46291, (0 missing)
      thalach < 147.5 to the right, improve=17.90570, (0 missing)
  Surrogate splits:
      exang   splits as  LR,        agree=0.731, adj=0.434, (0 split)
      thal    splits as  LRR,       agree=0.702, adj=0.374, (0 split)
      thalach < 148.5 to the right, agree=0.683, adj=0.333, (0 split)
      ca      splits as  LRRR,      agree=0.625, adj=0.212, (0 split)
      oldpeak < 0.85  to the left,  agree=0.611, adj=0.182, (0 split)

Node number 2: 109 observations,    complexity param=0.03157895
  predicted class=normal    expected loss=0.1834862  P(node) =0.5240385
    class counts:    89    20
   probabilities: 0.817 0.183
  left son=4 (98 obs) right son=5 (11 obs)
  Primary splits:
      oldpeak < 1.95  to the left,  improve=5.018621, (0 missing)
      slope   splits as  LRL,       improve=4.913298, (0 missing)
      thal    splits as  LRR,       improve=4.888193, (0 missing)
      ca      splits as  LRRR,      improve=3.642018, (0 missing)
      thalach < 152.5 to the right, improve=3.280350, (0 missing)

Node number 3: 99 observations,    complexity param=0.06315789
  predicted class=abnormal  expected loss=0.2424242  P(node) =0.4759615
    class counts:    24    75
   probabilities: 0.242 0.758
  left son=6 (35 obs) right son=7 (64 obs)
  Primary splits:
      thal    splits as  LRR,       improve=8.002922, (0 missing)
      exang   splits as  LR,        improve=7.972659, (0 missing)
      ca      splits as  LRRR,      improve=7.539716, (0 missing)
      oldpeak < 0.7   to the left,  improve=3.625175, (0 missing)
      thalach < 175   to the right, improve=3.354320, (0 missing)
  Surrogate splits:
      trestbps < 116   to the left,  agree=0.717, adj=0.200, (0 split)
      oldpeak  < 0.05  to the left,  agree=0.707, adj=0.171, (0 split)
      thalach  < 175   to the right, agree=0.697, adj=0.143, (0 split)
      sex      splits as  LR,        agree=0.677, adj=0.086, (0 split)
      age      < 69.5  to the right, agree=0.667, adj=0.057, (0 split)

Node number 4: 98 observations
  predicted class=normal    expected loss=0.1326531  P(node) =0.4711538
    class counts:    85    13
   probabilities: 0.867 0.133

Node number 5: 11 observations
  predicted class=abnormal  expected loss=0.3636364  P(node) =0.05288462
    class counts:     4     7
   probabilities: 0.364 0.636

Node number 6: 35 observations,    complexity param=0.06315789
  predicted class=normal    expected loss=0.4857143  P(node) =0.1682692
    class counts:    18    17
   probabilities: 0.514 0.486
  left son=12 (20 obs) right son=13 (15 obs)
  Primary splits:
      ca       splits as  LRRR,      improve=7.619048, (0 missing)
      exang    splits as  LR,        improve=6.294925, (0 missing)
      trestbps < 126.5 to the right, improve=2.519048, (0 missing)
      thalach  < 170   to the right, improve=2.057143, (0 missing)
      age      < 53.5  to the left,  improve=1.866667, (0 missing)
  Surrogate splits:
      thalach  < 134   to the right, agree=0.743, adj=0.400, (0 split)
      trestbps < 129   to the right, agree=0.714, adj=0.333, (0 split)
      exang    splits as  LR,        agree=0.686, adj=0.267, (0 split)
      oldpeak  < 1.7   to the left,  agree=0.686, adj=0.267, (0 split)
      age      < 62.5  to the left,  agree=0.657, adj=0.200, (0 split)

Node number 7: 64 observations
  predicted class=abnormal  expected loss=0.09375  P(node) =0.3076923
    class counts:     6    58
   probabilities: 0.094 0.906

Node number 12: 20 observations
  predicted class=normal    expected loss=0.2  P(node) =0.09615385
    class counts:    16     4
   probabilities: 0.800 0.200

Node number 13: 15 observations
  predicted class=abnormal  expected loss=0.1333333  P(node) =0.07211538
    class counts:     2    13
   probabilities: 0.133 0.867
Evaluating decision tree models
You can now use the predict function in rpart package to predict the status of patients included in the test data cardio.test
The following code-chunk predicts the status values for test data and will also print the confusion matrix for actual v/s. predicted values:
## You can now use your pruned tree model to predict the status for your test data
cardio.predict <- predict(cardio.pruned, cardio.test, type = "class")
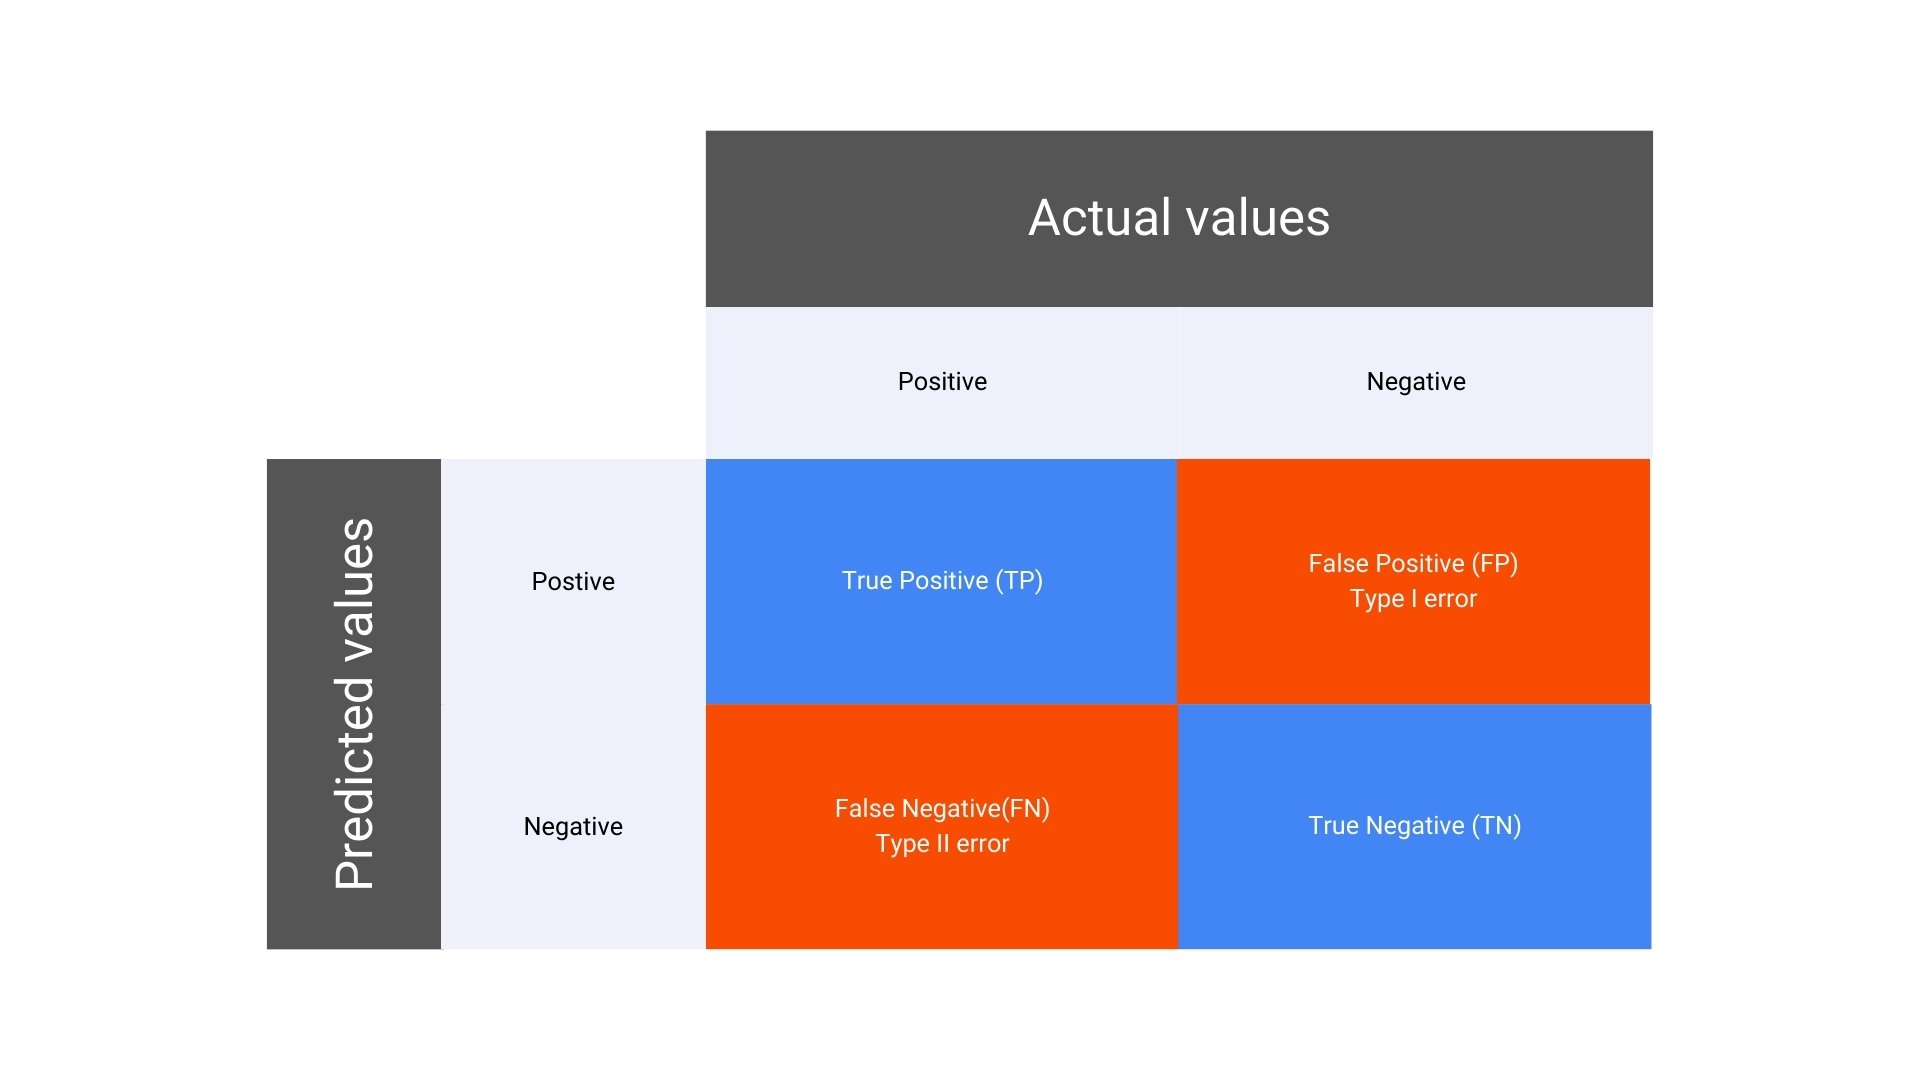
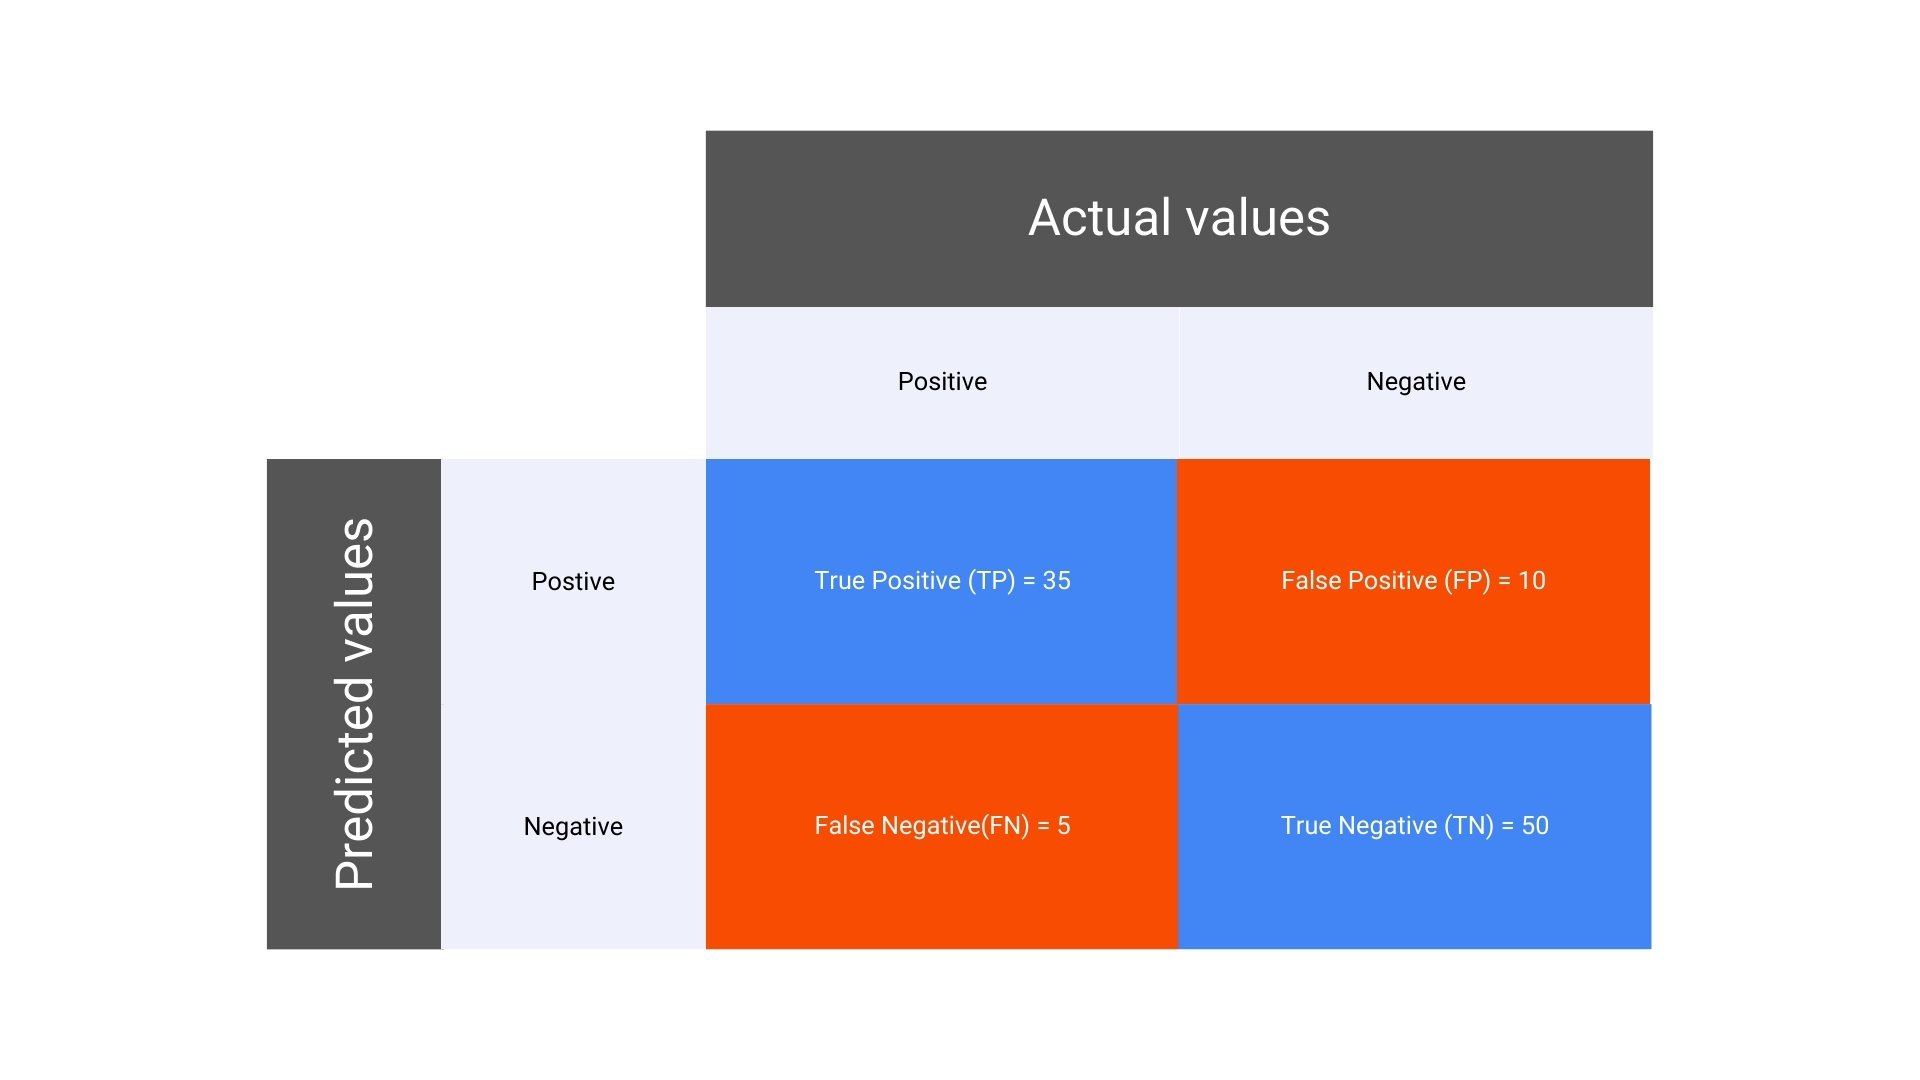
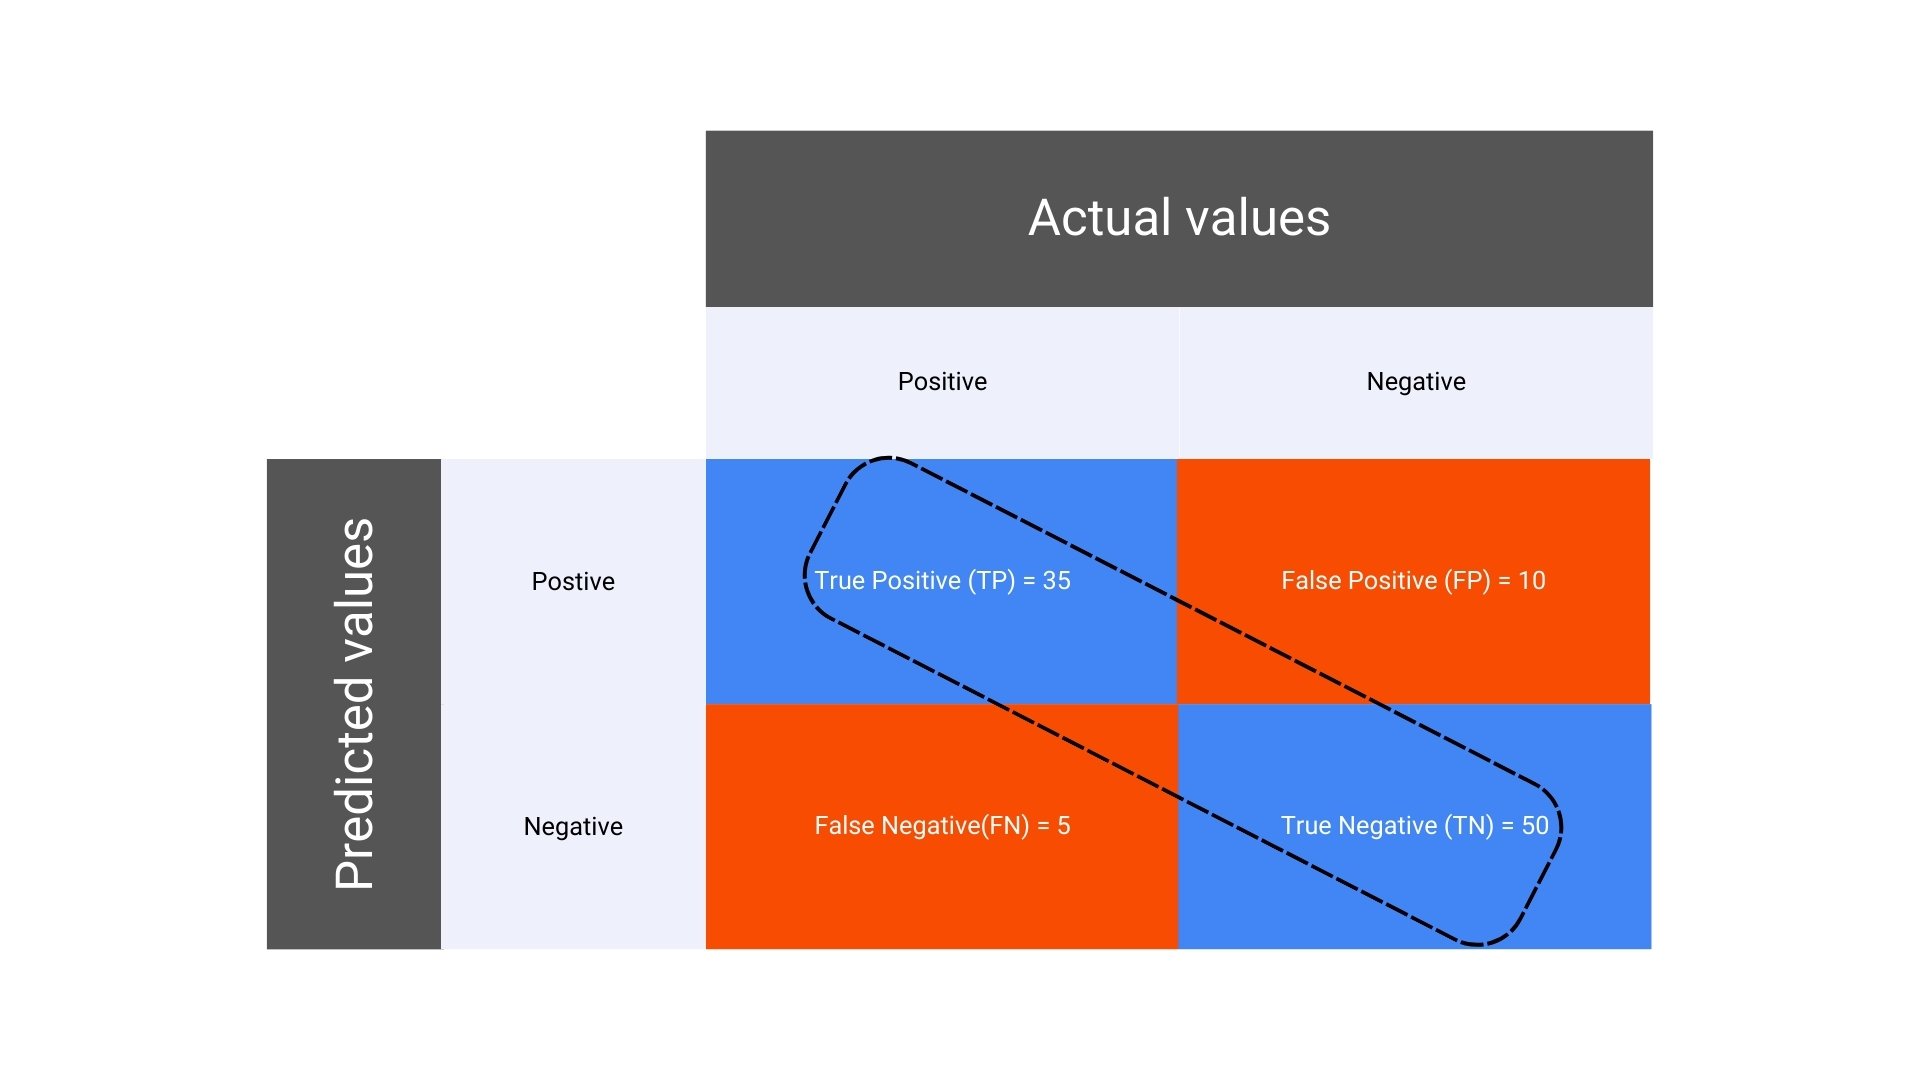
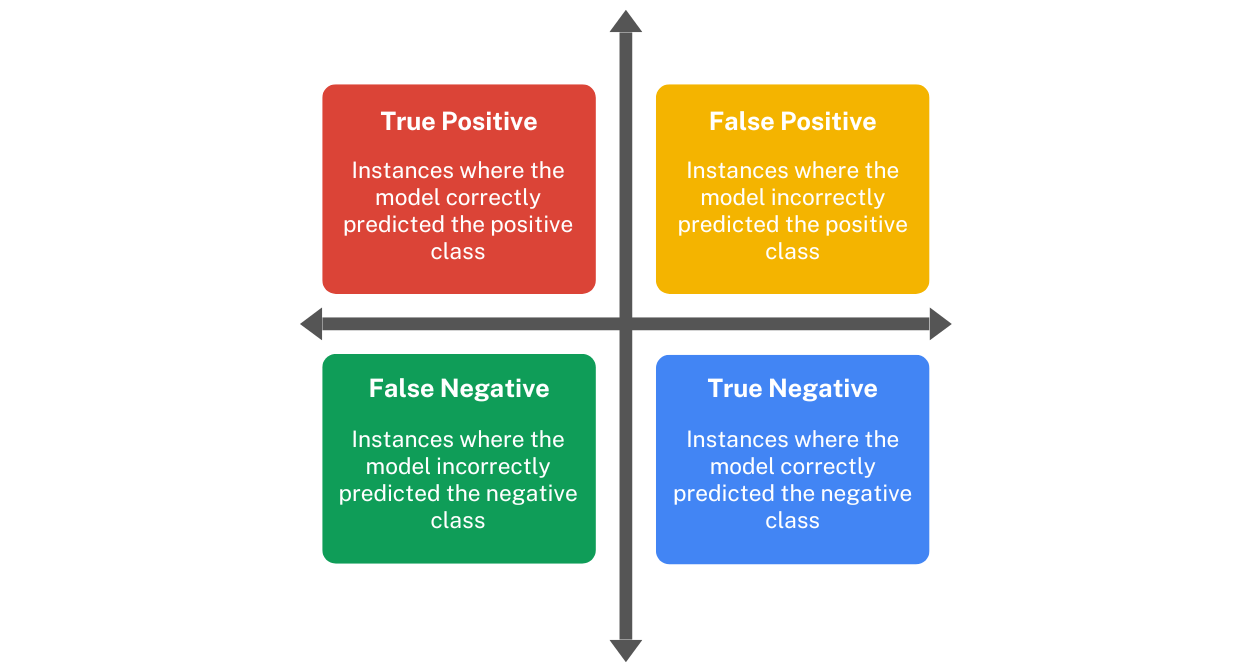
You should now evaluate the performance of your model on the test data. You will use your Confusion Matrix and calculate the Classification Error in the predictions:
# confusion matrix (training data)
conf.matrix <- table(cardio.test$status, cardio.predict)
rownames(conf.matrix) <- paste("Actual", rownames(conf.matrix), sep = ":")
colnames(conf.matrix) <- paste("Predicted", colnames(conf.matrix), sep = ":")
print(conf.matrix)
                 cardio.predict
                  Predicted:normal Predicted:abnormal
  Actual:normal                 40                  7
  Actual:abnormal               14                 28
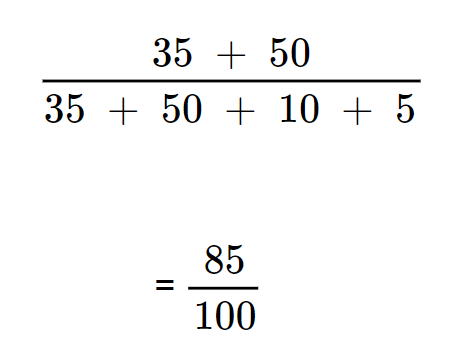
You can calculate the classification error as:
## caclulating the classification error
round((14 + 7)/89,3)
0.236
So, your decision tree has a 23.6% prediction error. In other words, your model has been able to classify the patients as normal or abnormal with an accuracy of 76.4%. Your division’s Chief Data Scientist should be impressed. Also, you have a classification model that you can very easily explain to doctors.
However, before we wind up, here is a small exercise for you.
Small Exercise:
Decision tree models can suffer from extremely high variance. A small change in the training data can give you very different results. This short exercise is designed to make this point. In the code chunk given below change the values, one at a time, for the following parameters, run the code, and then observe how the decision tree model changes:
set.seed (a): Set the seed to a different number: ‘1234’ or ‘1729’ or ‘9999’ or whatever you like
Training set proportion (p): Set the proportion to different numbers: ‘70%’ or ‘80%’, ‘90%’ or whatever you like
You can go ahead and use the code till the calculation of the prediction error but even plotting the fitted tree would help!
## You should keep the original data frame intact so let's make a copy cardioplay
cardioplay <- cardio

## you set the seed to ensure that you get the same training v/s. test split every time you run the code
## Keeping all else constant, you should change the seed from '1234' to any other number
a <- as.numeric(1234)


## randomly extract row numbers in cardio dataset which will be included in the training set
## Keeping all else constant, you should change the proportion from '50%' to any other proportion
p <- as.numeric(0.50)
## You don't need to make any changes in this code-chunk
## Make changes in the code-chunk just above and observe the changes in the output of this code-chunk

## seed
set.seed(a)

## rows in training data
trainset <- sample(1:nrow(cardioplay), round(p*nrow(cardioplay),0))
cardioplay.train <- cardio[trainset, ]

## rows in test data
cardioplay.test <- cardio[-trainset,  ]

## fit the tree
cardioplay.train.fit <- rpart(status ~ . , data = cardioplay.train, method = "class")

## plot the tree
fancyRpartPlot(cardioplay.train.fit, palettes = c("Greens", "Reds"), sub = "")
Conclusion
Now, you have a good understanding of how to perform the exploratory data analysis and prepare your dataset, before you can set out to build a decision tree. You are also familiar with various functions in the rpart package with which you can build decision trees, plot the trees, and prune decision trees to build. As we have discussed earlier, there are other tree-based approaches such as Bagging, Random Forests, and Boosting which improve the accuracy.
You are all set to start practicing exercises on these advanced topics!


