fbpx
Learn to build large language model applications: vector databases, langchain, fine tuning and prompt engineering. Learn more

Programming language

Author image - Ayesha
Ayesha Saleem
| April 24

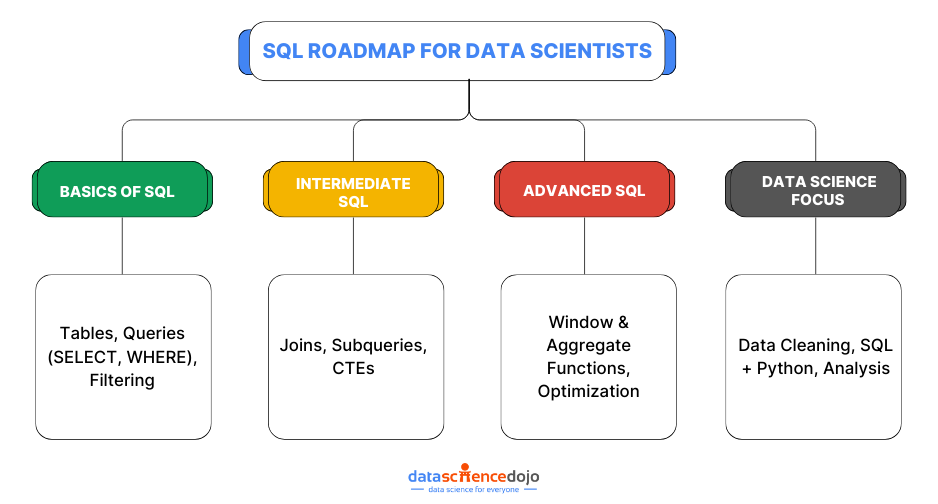
SQL (Structured Query Language) is an important tool for data scientists. It is a programming language used to manipulate data stored in relational databases. Mastering SQL concepts allows a data scientist to quickly analyze large amounts of data and make decisions based on their findings. Here are some essential SQL concepts that every data scientist should know:

First, understanding the syntax of SQL statements is essential in order to retrieve, modify or delete information from databases. For example, statements like SELECT and WHERE can be used to identify specific columns and rows within the database that need attention. A good knowledge of these commands can help a data scientist perform complex operations with ease.

Second, developing an understanding of database relationships such as one-to-one or many-to-many is also important for a data scientist working with SQL.

Here’s an interesting read about Top 10 SQL commands

Let’s dive into some of the key SQL concepts that are important to learn for a data scientist.  

1. Formatting Strings

We are all aware that cleaning up the raw data is necessary to improve productivity overall and produce high-quality decisions. In this case, string formatting is crucial and entails editing the strings to remove superfluous information. For transforming and manipulating strings, SQL provides a large variety of string methods. When combining two or more strings, CONCAT is utilized. The user-defined values that are frequently required in data science can be substituted for the null values using COALESCE. Tiffany Payne  

2. Stored Methods

We can save several SQL statements in our database for later use thanks to stored procedures. When invoked, it allows for reusability and has the ability to accept argument values. It improves performance and makes modifications simpler to implement. For instance, we’re attempting to identify all A-graded students with majors in data science. Keep in mind that CREATE PROCEDURE must be invoked using EXEC in order to be executed, exactly like the function definition. Paul Somerville 

3. Joins

Based on the logical relationship between the tables, SQL joins are used to merge the rows from various tables. In an inner join, only the rows from both tables that satisfy the specified criteria are displayed. In terms of vocabulary, it can be described as an intersection. The list of pupils who have signed up for sports is returned. Sports ID and Student registration ID are identical, please take note. Left Join returns every record from the LEFT table, while Right Join only shows the matching entries from the RIGHT table. Hamza Usmani 

4. Subqueries

Knowing how to utilize subqueries is crucial for data scientists because they frequently work with several tables and can use the results of one query to further limit the data in the primary query. The nested or inner query is another name for it. The subquery is conducted before the main query and needs to be surrounded in parenthesis. It is referred to as a multi-line subquery and requires the use of multi-line operators if it returns more than one row. Tiffany Payne 

5. Left Joins vs Inner Joins

It’s easy to confuse left joins and inner joins, especially for those who are still getting their feet wet with SQL or haven’t touched the language in a while. Make sure that you have a complete understanding of how the various joins produce unique outputs. You will likely be asked to do some kind of join in a significant number of interview questions, and in certain instances, the difference between a correct response and an incorrect one will depend on which option you pick. Tom Miller 

6. Manipulation of dates and times

There will most likely be some kind of SQL query using date-time data, and you should prepare for it. For instance, one of your tasks can be to organize the data into groups according to the months or to change the format of a variable from DD-MM-YYYY to only the month. You should be familiar with the following functions:

– EXTRACT
– DATEDIFF
– DATE ADD, DATE SUB
– DATE TRUNC 

Olivia Tonks 

7. Procedural Data Storage 

Using stored procedures, we can compile a series of SQL commands into a single object in the database and call it whenever we need it. It allows for reusability and when invoked, can take in values for its parameters. It improves efficiency and makes it simple to implement new features. Using this method, we can identify the students with the highest GPAs who have declared a particular major. One goal is to identify all A-students whose major is Data Science. It’s important to remember that, like a function declaration, calling a CREATE PROCEDURE with EXEC is necessary for the procedure to be executed. Nely Mihaylova 

8. Connecting SQL to Python or R 

A developer who is fluent in a statistical language, like Python or R, may quickly and easily use the packages of
language to construct machine learning models on a massive dataset stored in a relational database management system. A programmer’s employment prospects will improve dramatically if they are fluent in both these statistical languages and SQL. Data analysis, dataset preparation, interactive visualizations, and more may all be accomplished in SQL Server with the help of Python or R. Rene Delgado  

9. Features of windows

In order to apply aggregate and ranking functions over a specific window, window functions are used (set of rows). When defining a window with a function, the OVER clause is utilized. The OVER clause serves dual purposes:

– Separates rows into groups (PARTITION BY clause is used).
– Sorts the rows inside those partitions into a specified order (ORDER BY clause is used).
– Aggregate window functions refer to the application of aggregate
functions like SUM(), COUNT(), AVERAGE(), MAX(), and MIN() over a specific window (set of rows). Tom Hamilton Stubber  

10. The emergence of Quantum ML

With the use of quantum computing, more advanced artificial intelligence and machine learning models might be created. Despite the fact that true quantum computing is still a long way off, things are starting to shift as a result of the cloud-based quantum computing tools and simulations provided by Microsoft, Amazon, and IBM. Combining ML and quantum computing has the potential to greatly benefit enterprises by enabling them to take on problems that are currently insurmountable. Steve Pogson 

11. Predicates

Predicates occur from your WHERE, HAVING, and JOIN clauses. They limit the amount of data that has to be processed to run your query. If you say SELECT DISTINCT customer_name FROM customers WHERE signup_date = TODAY() that’s probably a much smaller query than if you run it without the WHERE clause because, without it, we’re selecting every customer that ever signed up!

Data science sometimes involves some big datasets. Without good predicates, your queries will take forever and cost a ton on the infra bill! Different data warehouses are designed differently, and data architects and engineers make different decisions about to lay out the data for the best performance. Knowing the basics of your data warehouse, and how the tables you’re using are laid out, will help you write good predicates that save your company a lot of money during the year, and just as importantly, make your queries run much faster.

For example, a query that runs quickly but simply touches a huge amount of data in Bigquery can be really expensive if you’re using on-demand pricing which scales with the amount of data touched by the query. The same query can be really cheap if you’re using Bigquery’s Flat-rate pricing or Snowflake, both of which are affected by how long your query takes to run, not how much data is fed into it. Kyle Kirwan 

12. Query Syntax

This is what makes SQL so powerful and much easier than coding individual statements for every task we want to complete when extracting data from a database. Every query starts with one or more clauses such as SELECT, FROM, or WHERE – each clause gives us different capabilities; SELECT allows us to define which columns we’d like returned in the results set; FROM indicates which table name(s) we should get our data from; WHERE allows us to specify conditions that rows must meet for them to be included in our result set etcetera! Understanding how all these clauses work together will help you write more effective and efficient queries quickly, allowing you to do better analysis faster! John Smith 

Elevate your business with essential SQL concepts 

AI and machine learning, which have been rapidly emerging, are quickly becoming one of the top trends in technology. Developments in AI and machine learning are being seen all over the world, from big businesses to small startups.

Businesses utilizing these two technologies are able to create smarter systems for their customers and employees, allowing them to make better decisions faster.

These advancements in artificial intelligence and machine learning are helping companies reach new heights with their products or services by providing them with more data to help inform decision-making processes.

Additionally, AI and machine learning can be used to automate mundane tasks that take up valuable time. This could mean more efficient customer service or even automated marketing campaigns that drive sales growth through
real-time analysis of consumer behavior. Rajesh Namase

Data Science Dojo
Dave Langer

Feature engineering and data wrangling are key skills for a data scientist. Learn how to accelerate your R coding to deliver more, and better, features.

Earlier this month I had the privilege of traveling to Amsterdam to teach an excellent group of folk’s data science. As is so often the case, I learned as much from the students as they learned from me.

Understanding feature engineering and data wrangling

For example, one of the students asked for some R programming assistance around data wrangling and feature engineering. The scenario in question really intrigued me. I knew how I could solve the problem using traditional non-functional programming techniques (e.g., using loops), but I was looking for something more elegant.

In the hotel that evening I fired up RStudio and started noodling on the problem using my current go-to solution for data wrangling in R – the mighty dplyr package. I had so much fun working through the scenario, here’s some example code from the video showing dplyr in action.

[splus] #====================================================================== 
#Add the new feature for the Title of each passenger 
# 
train <- train %>% 
mutate(Title = str_extract(Name, "[a-zA-Z]+\\.")) table(train$Title)
table(train$Title)
 #====================================================================== 
 #Condense titles down to small subset 
# 
titles.lookup <- data.frame(Title = c("Mr.", "Capt.", "Col.", "Don.", "Dr.",
                                    "Jonkheer.", "Major.", "Rev.", "Sir.",
                                    "Mrs.", "Dona.", "Lady.", "Mme.", "Countess.", 
                                    "Miss.", "Mlle.", "Ms.",
                                    "Master."),
                          New.Title = c(rep("Mr.", 9),
                                        rep("Mrs.", 5),
                                        rep("Miss.", 3),
                                        "Master."),
                                        stringsAsFactors = FALSE)
View(titles.lookup)
#Replace Titles using lookup table 
train <- train %>% 
left_join(titles.lookup, by = "Title") 
View(train) 
train <- train %>% 
mutate(Title = New.Title) %>% 
select(-New.Title) 
View(train) 
[/splus]

Now compare the above elegant (if I do say so myself ;-)) code with the following code from my series:

[splus]
# Expand upon the relationship between `Survived` and `Pclass` by adding the new `Title` variable to the
# data set and then explore a potential 3-dimensional relationship.
# Create a utility function to help with title extraction
extractTitle <- function(name) {
  name <- as.character(name) if (length(grep("Miss.", name)) > 0) {
return ("Miss.")
 } else if (length(grep("Master.", name)) > 0) {
return ("Master.")
} else if (length(grep("Mrs.", name)) > 0) {
return ("Mrs.")
} else if (length(grep("Mr.", name)) > 0) {
return ("Mr.")
} else {
return ("Other")
}
}
titles <- NULL
for (i in 1:nrow(data.combined)) {
 titles <- c(titles, extractTitle(data.combined[i,"name"]))
}
data.combined$title <- as.factor(titles)
# Re-map titles to be more exact
titles[titles %in% c("Dona.", "the")] <- "Lady."
titles[titles %in% c("Ms.", "Mlle.")] <- "Miss."
titles[titles == "Mme."] <- "Mrs."
titles[titles %in% c("Jonkheer.", "Don.")] <- "Sir."
titles[titles %in% c("Col.", "Capt.", "Major.")] <- "Officer"
table(titles)

# Make title a factor
data.combined$new.title <- as.factor(titles)
# Collapse titles based on visual analysis
indexes <- which(data.combined$new.title == "Lady.")
data.combined$new.title[indexes] <- "Mrs."
indexes <- which(data.combined$new.title == "Dr." | 
             data.combined$new.title == "Rev." |
             data.combined$new.title == "Sir." |
             data.combined$new.title == "Officer")
data.combined$new.title[indexes] <- "Mr."

Beautiful!

In our Bootcamp we spend a lot of time emphasizing that in the bulk of scenarios a Data Scientist is best served by focusing their time on Data Wrangling and (most importantly) Feature Engineering. So often quality trumps everything else – algorithm selection, hyperparameter tuning, blending, etc. My work on this video series is aligned to our teachings on the importance of both in R. Hopefully folks get as much out of my new series as I am getting out of making it.

Enjoy and happy data sleuthing!

Data wrangling cheat sheet

Here is a cheat sheet:

Data wrangling-Cheat sheet
Data Science Dojo
Usman Shahid
| June 10

Learn how to use Chatterbot, the Python library, to build and train AI-based chatbots.

Chatbots have become extremely popular in recent years and their use in the industry has skyrocketed. The chatbot market is projected to grow from $2.6 billion in 2019 to $9.4 billion by 2024. This doesn’t come as a surprise when you look at the immense benefits chatbots bring to businesses. According to a study by IBM, chatbots can reduce customer services cost by up to 30%.

In the third blog of A Beginners Guide to Chatbots, we’ll be taking you through how to build a simple AI-based chatbot with Chatterbot; a Python library for building chatbots.

Introduction to chatterbot

Chatterbot is a python-based library that makes it easy to build AI-based chatbots. The library uses machine learning to learn from conversation datasets and generate responses to user inputs. The library allows developers to train their chatbot instances with pre-provided language datasets as well as build their datasets.


Training chatterbot

A newly initialized Chatterbot instance starts with no knowledge of how to communicate. To allow it to properly respond to user inputs, the instance needs to be trained to understand how conversations flow. Since conversational chatbot Python relies on machine learning at its backend, it can very easily be taught conversations by providing it with datasets of conversations.

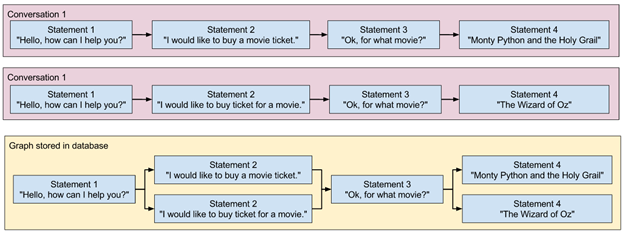
Chatterbot’s training process works by loading example conversations from provided datasets into its database. The bot uses the information to build a knowledge graph of known input statements and their probable responses. This graph is constantly improved and upgraded as the chatbot is used.

Chatterbot knowledge graph - AI based chatbot Python

Chatterbot knowledge graph (Source: Chatterbot Knowledgebase)

Chatterbot corpus

The Chatterbot Corpus is an open-source user-built project that contains conversational datasets on a variety of topics in 22 languages. These datasets are perfect for training a chatbot on the nuances of languages – such as all the different ways a user could greet the bot. This means that developers can jump right to training the chatbot on their customer data without having to spend time teaching common greetings.

Chatterbot has built-in functions to download and use datasets from the Chatterbot Corpus for initial training.

Chatterbot logic adapters

Conversational chatbot Python uses Logic Adapters to determine the logic for how a response to a given input statement is selected.

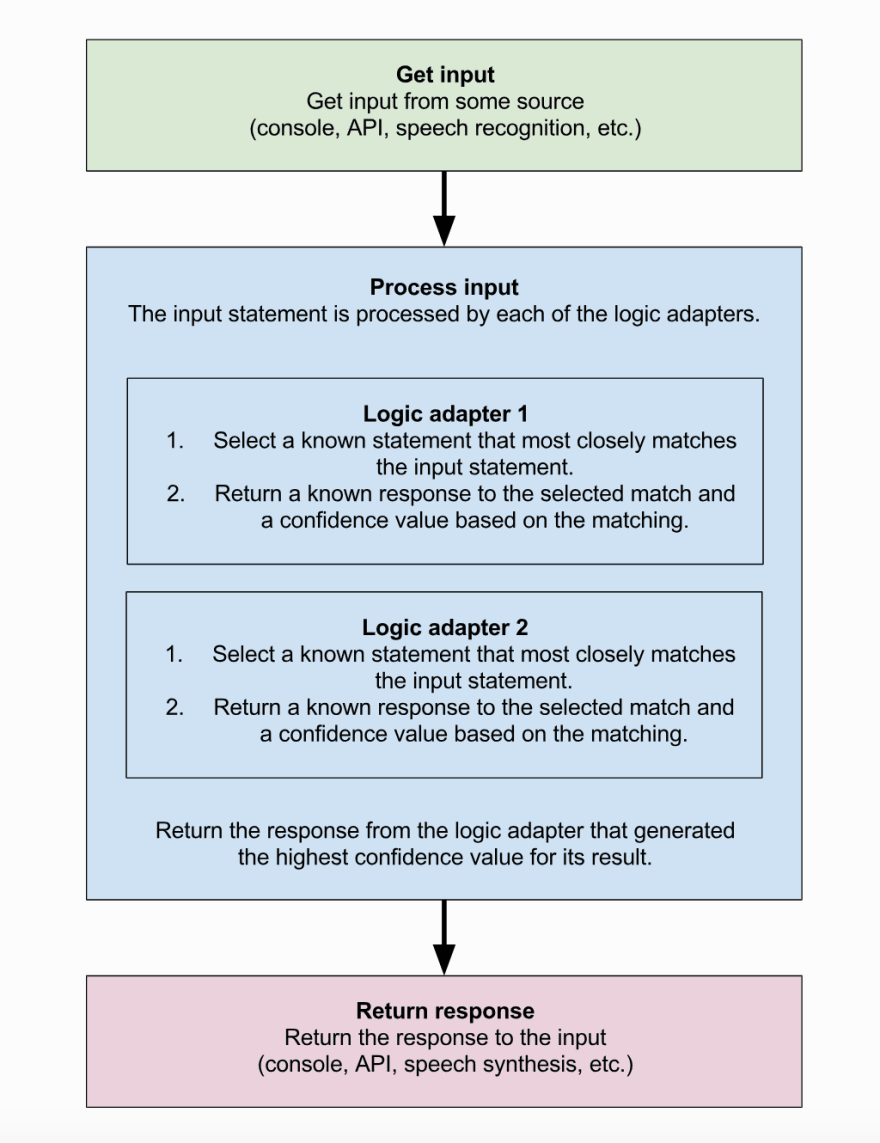
A typical logic adapter designed to return a response to an input statement will use two main steps to do this. The first step involves searching the database for a known statement that matches or closely matches the input statement. Once a match is selected, the second step involves selecting a known response to the selected match. Frequently, there will be several existing statements that are responses to the known match. In such situations, the Logic Adapter will select a response randomly. If more than one Logic Adapter is used, the response with the highest cumulative confidence score from all Logic Adapters will be selected.

logic adapters in chatbot
Working process of logic adapters- How logic adapters work (Source: Chatterbot Knowledgebase)

Chatterbot storage adapters

Chatterbot stores its knowledge graph and user conversation data in an SQLite database. Developers can interface with this database using Chatterbot’s Storage Adapters.

Storage Adapters allow developers to change the default database from SQLite to MongoDB or any other database supported by the SQLAlchemy ORM. Developers can also use these Adapters to add, remove, search, and modify user statements and responses in the Knowledge Graph as well as create, modify and query other databases that Chatterbot might use.

Building an AI-based chatbot

In this tutorial, we will be using the Chatterbot Python library to build an AI-based Chatbot.

We will be following the steps below to build our chatbot

  1. Importing Dependencies
  2. Instantiating a ChatBot Instance
  3. Training on Chatbot-Corpus Data
  4. Training on Custom Data
  5. Building a front end

Importing dependencies

The first thing we’ll need to do is import the modules we’ll be using. The ChatBot module contains the fundamental Chatbot class that will be used to instantiate our chatbot object. The ListTrainer module allows us to train our chatbot on a custom list of statements that we will define. The ChatterBotCorpusTrainer module contains code to download and train our chatbot on datasets part of the ChatterBot Corpus Project.

#Importing modules
from chatterbot import ChatBot
from chatterbot.trainers import ListTrainer
from chatterbot.trainers import ChatterBotCorpusTrainer

Instantiating chatbots instance

A chatbot instance can be created by creating a Chatbot object. The Chatbot object needs to have the name of the chatbot and must reference any logic or storage adapters you might want to use.

In the case you don’t want your chatbot to learn from user inputs after it has been trained, you can set the read-only parameter to True.

BankBot = ChatBot(name = 'BankBot',
                  read_only = False,                  
                  logic_adapters = ["chatterbot.logic.BestMatch"],                 
                  storage_adapter = "chatterbot.storage.SQLStorageAdapter")

Training on chatterbot-corpus data

Training your chatbot agent on data from the Chatterbot-Corpus project is relatively simple. To do that, you need to instantiate a ChatterBotCorpusTrainer object and call the train() method. The ChatterBotCorpusTrainer takes in the name of your ChatBot object as an argument. The train() method takes in the name of the dataset you want to use for training as an argument.

Detailed information about ChatterBot-Corpus Datasets is available on the project’s Github repository.

corpus_trainer = ChatterBotCorpusTrainer(BankBot)
corpus_trainer.train("chatterbot.corpus.English")

Training on custom list data

You can also train ChatterBot on custom conversations. This can be done by using the module’s ListTrainer class.

In this case, you will need to pass in a list of statements where the order of each statement is based on its placement in a given conversation. Each statement in the list is a possible response to its predecessor in the list.

The training can be undertaken by instantiating a ListTrainer object and calling the train() method. It is important to note that the train() method must be individually called for each list to be used.

greet_conversation = [
    "Hello",
    "Hi there!",
    "How are you doing?",
    "I'm doing great.",
    "That is good to hear",
    "Thank you.",
    "You're welcome."
]
open_timings_conversation = [
    "What time does the Bank open?",
    "The Bank opens at 9AM",
]
close_timings_conversation = [
    "What time does the Bank close?",
    "The Bank closes at 5PM",
]
#Initializing Trainer Object
trainer = ListTrainer(BankBot)

#Training BankBot
trainer.train(greet_conversation)
trainer.train(open_timings_conversation)
trainer.train(close_timings_conversation)

Building a front end

Once the chatbot has been trained, it can be used by calling Chatterbot’s get response() method. The method takes a user string as an input and returns a response string.

while (True):
    user_input = input()
    if (user_input == 'quit'):
        break
    response = BankBot.get_response(user_input)
    print (response)

Conclusion

This blog was hands-on to building a simple AI-based chatbot in Python. The functionality of this bot can easily be increased by adding more training examples. You could, for example, add more lists of custom responses related to your application.

As we saw, building an AI-based chatbot is easy compared to building and maintaining a Rule-based Chatbot. Despite this ease, chatbots such as this are very prone to mistakes and usually give robotic responses because of a lack of good training data.

A better way of building robust AI-based Chatbots is to use Conversational AI Tools offered by companies like Google and Amazon. These tools are based on complex machine learning models with AI that has been trained on millions of datasets. This makes them extremely intelligent and, in most cases, are almost indistinguishable from human operators.

In the next blog to learn data science, we’ll be looking at how to create a Dialog Flow Chatbot using Google’s Conversational AI Platform.

Want to upgrade your Python abilities? Check out Data Science Dojo’s Introduction to Python for Data Science.

Data Science Dojo
Arsalan Shahid
| March 6

R and Python remain the most popular data science programming languages. But if we compare r vs python, which of these languages is better?

As data science becomes more and more applicable across every industry sector, you might wonder which programming language is best for implementing your models and analysis. If you attend a data science Bootcamp, Meetup, or conference, chances are you’ll run into people who use one of these languages.

Since R and Python remain the most popular languages for data science, according to  IEEE Spectrum’s latest rankings, it seems reasonable to debate which one is better. Although it’s suggested to use the language you are most comfortable with and one that suits the needs of your organization, for this article, we will evaluate the two languages. We will compare R and Python in four key categories: Data Visualization, Modelling Libraries, Ease of Learning, and Community Support.

Data visualization

A significant part of data science is communication. Most of the time, you as a data scientist need to show your result to colleagues with little or no background in mathematics or statistics. So being able to illustrate your results in an impactful and intelligible manner is very important. Any language or software package for data science should have good data visualization tools.

Good data visualization involves clarity. No matter how complicated your model is, there will be a simple and unambiguous way of illustrating your results such that even a layperson would understand.

Python

Python is renowned for its extensive number of libraries. There are plenty of libraries that can be used for plotting and visualizations. The most popular libraries are matplotlib and  seaborn. The library matplotlib is adapted from MATLAB, it has similar features and styles. The library is a very powerful visualization tool with all kinds of functionality built in. It can be used to make simple plots very easily, especially as it works well with other Python data science libraries, pandas and numpy.

Although matplotlib can make a whole host of graphs and plots, what it lacks is simplicity. The most troublesome aspect is adjusting the size of the plot: if you have a lot of variables it can get hectic trying to neatly fit them all into one plot. Another big problem is creating subplots; again, adjusting them all in one figure can get complicated.

Now, seaborn builds on top of matplotlib, including more aesthetic graphs and plots. The library is surely an improvement on matplotlib’s archaic style, but it still has the same fundamental problem: creating figures can be very complicated. However, recent developments have tried to make things simpler.

R

Many libraries could be used for data visualization in R but ggplot2 is the clear winner in terms of usage and popularity? The library uses a grammar of graphics philosophy, with layers used to draw objects on plots. Layers are often interconnected to each other and can share many common features. These layers allow one to create very sophisticated plots with very few lines of code. The library allows the plotting of summary functions. Thus, ggplot2 is more elegant than matplotlib and thus I feel that in this department R has an edge.

It is, however, worth noting that Python includes a ggplot library, based on similar functionality as the original ggplot2 in R. It is for this reason that R and Python both are on par with each other in this department.

Modelling libraries

Data science requires the use of many algorithms. These sophisticated mathematical methods require robust computation. It is rarely or maybe never the case that you as a data scientist need to code the whole algorithm on your own. Since that is incredibly inefficient and sometimes very hard to do so, data scientists need languages with built-in modelling support. One of the biggest reasons why Python and R get so much traction in the data science space is because of the models you can easily build with them.

Python

As mentioned earlier Python has a very large number of libraries. So naturally, it comes as no surprise that Python has an ample amount of machine learning libraries. There is scikit-learnXGboostTensorFlowKeras and PyTorch just to name a few. Python also has pandas, which allows tabular forms of data. The library pandas make it very easy to manipulate CSVs or Excel-based data.

In addition to this Python has great scientific packages like numpy. Using numpy, you can do complicated mathematical calculations like matrix operations in an instant. All of these packages combined, make Python a powerhouse suited for hardcore modelling.

R

R was developed by statisticians and scientists to perform statistical analysis way before that was such a hot topic. As one would expect from a language made by scientists, one can build a plethora of models using R. Just like Python, R has plenty of libraries — approximately 10000 of them. The mice package, rpartparty and caret are the most widely used. These packages will have your back, starting from the pre-modelling phase to the post-model/optimization phase.

Since you can use these libraries to solve almost any sort of problem; for this discussion let’s just look at what you can’t model. Python is lacking in statistical non-linear regression (beyond simple curve fitting) and mixed-effects models. Some would argue that these are not major barriers or can simply be circumvented. True! But when the competition is stiff you have to be nitpicky to decide which is better. R, on the other hand, lacks the speed that Python provides, which can be useful when you have large amounts of data (big data).

Ease of learning

It’s no secret that currently data science is one of the most in-demand jobs, if not the one most in demand. As a consequence, many people are looking to get on the data science bandwagon, and many of them have little or no programming experience. Learning a new language can be challenging, especially if it is your first. For this reason, it is appropriate to include ease of learning as a metric when comparing the two languages.

Python

Designed in 1989 with a philosophy that emphasizes code readability and a vision to make programming easy or simple, the designers of Python succeeded as the language is fairly easy to learn. Although Python takes inspiration for its syntax from C, unlike C it is uncomplicated. I recommend it as my choice of language for beginners since anyone can pick it up in relatively less time.

R

I wouldn’t say that R is a difficult language to learn. It is quite the contrary, as it is simpler than many languages like C++ or JavaScript. Like Python, much of R’s syntax is based on C, but unlike Python R was not envisioned as a language that anyone could learn and use, as it was specifically initially designed for statisticians and scientists. IDEs such as RStudio have made R significantly more accessible, but in comparison with Python, R is a relatively more difficult language to learn.

In this category Python is the clear winner. However, it must be noted that programming languages in general are not hard to learn. If a beginner wanted to learn R, it won’t be as easy in my opinion as learning Python but it won’t be an impossible task either.

Community support

Every so often as a data scientist you are required to solve problems that you haven’t encountered before. Sometimes you may have difficulty finding the relevant library or package that could help you solve your problem. To find a solution, it is not uncommon for people to search in the language’s official documentation or online community forums. Having good community support can help programmers, in general, to work more efficiently.

Both of these languages have active Stack overflow members and also an active mailing list available (where one can easily ask for solutions from experts). R has online R-documentation where you can find information about certain functions and function inputs. Most Python libraries like pandas and scikit-learn have their official online documentation that explains each library.

Both languages have a significant amount of user base, hence, they both have a very active support community. It isn’t difficult to see that both seem to be equal in this regard.

Why R?

R has been used for statistical computing for over two decades now. You can get started with writing useful code in no time. It has been used extensively by data scientists and has an insane number of packages available for a lot of data science-related tasks. I have almost always been able to find a package in R to get the task done very quickly. I have decent python skills and have written production code in python. Even with that, I find R slightly better for quickly testing out ideas, trying out different ways to visualize data and for rapid prototyping work.

Why Python?

Python has many advantages over R in certain situations. Python is a general-purpose programming language. Python has libraries like pandas, NumPy, scipy and sci-kit-learn, to name a few which can come in handy for doing data science-related work.

If you get to the point where you have to showcase your data science work, Python once would be a clear winner. Python combined with Django is an awesome web application framework, which can help you create a web service/site with both your data science and web programming done in the same language.

You may hear some speed and efficiency arguments from both camps – ignore them for now. If you get to a point when you are doing something substantial enough where the speed of your code matters to you, you will probably figure out things on your own. So don’t worry about it at this point.

You can learn Python for data science with Data Science Dojo!

R and Python – The most popular languages

Considering that you are a beginner in both data science and programming and that you have a background in Economics and Statistics, I would lean towards R. Besides being very powerful, Python is without a doubt one of the friendliest programming languages to beginners – but it is still a programming language. Your learning curve may be a bit steeper in Python as opposed to R.

You should learn Python, once you are comfortable with R, and have grasped the general concepts of data science – which will take some time. You can read “What are the key skills of a data scientist? To get an idea of the skill set you will need to become a data scientist.

Start with R, transition to Python gradually and then start using both as needed. Both are great for data science but one is better than the other in certain situations.

Data Science Dojo
Luna Bell
| September 9

Over the years, the popularity of different programming languages has been increasing. This blog lists down some of the top & most useful programming languages for you to learn.

The use of programming languages ​​remains a popular way of earning money and the main tool for creating modern technologies. Even if you start studying some of these programming languages right now, you can be sure of high wages and rapid career growth.

The more programming languages ​​you know and use, the higher your status will be. For the development of one application/technology, several of them can be used at once. Since the inception of the first computers, more than 8,000 programming languages have been invented. There are basic ones that are used everywhere. It is impossible to single out the best one, each has advantages and disadvantages.

Below is the list to get you acquainted with the best programming languages ​​and find out which one to start with:

Python 

Python is a simple programming language that is suitable for beginners and will be a relatively easy way to get into a new profession. A clear code, a large library of tools, and a minimum of tricks allow you to quickly get the hang of it, making the language the most popular in education and also helping you to learn data science. Although learning Python for Data Science is not an easy task, there is a lot of training out there that can help one get started.  It is not for nothing called “language with batteries included”, it itself provides methods for solving basic problems. It is easy to integrate with C and C ++ languages.

Python’s performance is inferior to other languages, but because of this, it does not lose its relevance. Scientists all over the world use it for machine learning. Plus, it’s ideal for web services; backend, and sysadmin.

C & C++

The C language appeared in 1975, and its more multifaceted extension C ++, in 1985. They are the progenitors of most programming languages. Every 3 years the C ++ language is updated, and today there is already the 20th ISO standard. Initially, the C language was developed for less powerful computers, was economical, and more tied to the hardware. This binding remains today, which allows you to “squeeze” the maximum out of productivity. Now the language is used both for game development and for machines with a low-power processor.

These complex languages ​​are not the most fun places to learn programming. When studying, you can quickly burn out and say goodbye to the profession. However, it is C ++ that will help to fully probe the “brain” of the computer, which is extremely important for the programmer. This hard start is suitable for those who want to understand the basics. C ++ does not support validation at the time of writing the code, which also complicates the development work.

That is why these specialists are in great demand.

.NET

.NET is a framework from Microsoft that allows you to use the same namespaces, libraries, and APIs for different languages. .NET supports several languages: along with C#, it also includes VB.NET, C ++, F #, as well as various dialects of other languages ​​tied to .NET.

.NET is fairly widespread in the development of in-house software products, but it is still relatively rare in web development, like other software products from Microsoft. Therefore, finding .NET developers for a web project can be quite difficult. The use of .NET usually  “pulls” the purchase of other software from Microsoft. However, if you are looking for a promising direction, this is a great option.

JavaScript

Created in 1995, JavaScript is the dominant frontend language around the world. Its relevance is not lost even for a minute, it can be used to create interactive websites. It is also easy to learn, but today it is not enough for development, and the number and quality of frameworks can become difficult. That is why you should not start with it, because constant retraining for the changing frontend, by virtue of already active programmers.

Thanks to a large number of add-ons, the functionality of JavaScript is limitless. The main disadvantage is that due to the fact that the language is used to encode pop-ups, we often have to deal with malicious content.

Java

Java was also introduced in 1995 but has nothing to do with JavaScript. It is in demand in the backend and occupies a good position in it. Death is predicted for the language every year, but it seems that this will not happen soon. Behind the “boring and verbose” structure, many find the perfect solution to many problems. For example, it is used by banking structures to write mobile applications for large companies.

The main advantage is that the developed application will run on any platform that supports Java due to the weak link system. That is, after the initial creation, there is no need to modify the application specifically for each server.

The disadvantages of the language include additional payment for the licensed version of the Java Development Kit, and it is not suitable for applications in the cloud.

Learning Java first is not worth it, it is the perfect complement to other more fundamental languages.

Swift

Created by Apple in 2014, Swift has grown exponentially in popularity. The creators positioned it as a replacement for Objective-C and the beginning of a “new era” of programming. But so far it is in demand for only iOS applications.

The language is perfectly adapted for both custom and server-side development. The syntax is easy to read and the code runs quickly.

It’s only worth learning if you’re going to develop apps for Apple products.

But even for iOS, it does not always work. Since the language is new, it is used to write applications for at least the seventh generation of iOS. In addition, Swift still has many shortcomings, it is unstable and has a small number of third-party resources to work with.

Conclusion

A number of programmers build their careers with professional knowledge in only one programming language, but they are more proficient in several of them at once, which significantly increases their chances of succeeding in their careers. It is difficult to say which of them should be studied. For example, if you want to work in a large company, it is better to learn C and Java, Python and JavaScript are suitable for participation in web startups, and for iOS mobile applications, it is enough to have knowledge of Swift.

Data Science Dojo
Albar Wahab
| February 22

Data Science Dojo has launched Jupyter Hub offering to the Azure Marketplace with pre-installed data exploration, analysis, and modeling libraries.

Data Science Dojo’s free Jupyter Hub

We are offering on Microsoft’s Azure platform– uses cloud services to provide you with an effortless coding environment. It is your ideal partner if you want to dive into the world of programming. The service has built-in support for multiple programming languages: R, Python, and Bash. These languages are popular in data science, machine learning, and deep learning thus making JupyerHub.

But that is not all!

The offering comes pre-installed with several popular tools for data exploration, analysis, modeling, and development. Listed below are a few examples of the pre-installed libraries:

Python libraries

  • NumPy, SciPy, Matplotlib, pandas, Scikit-learn, Seaborn, Beautifulsoup4, Plotly, OpenCV-python, azure-storage-blob, azure-storage-file, azure-storage-queue, azure-storage-common 

R libraries

  • tm, lsa, stats, miscTools, animation, lattice, rpart, party, randomForest, bst, AUC, pROC, e1071, kLaR, ElemStatLearn, glmnet, Metrics, fpc, ggplot2, caret, GGally,rpart.plot, xgboost, quanteda, plyr,dplyr, stringr, irlba, doSNOW, Rtsne

With our free offer, you can analyze and visualize data, as well as construct machine learning models in Python and R. You can also personalize your experience using the notebook interface. Everything from the theme to the behavior of individual cells and widgets may be changed as per your requirements

When working in the Jupyter instance, your programming code, along with your outputs, narrations, and multimedia, can all be combined into one single document. It also comes with a unique tool, nbcovert, that lets you turn your notebooks into HTML and PDF. You can work with Microsoft cloud services without having to worry about installation or maintenance. Furthermore, because the computations are not conducted locally on your PC, but rather in the cloud, the responsiveness and processing speed are enhanced to the max!

We here at Data Science Dojo deliver data science education, consulting, and technical services to increase the power of data. We are therefore adding a free Jupyter Notebook Environment dedicated specifically for Data Scientists Using Python and R. The offering leverages the power of Microsoft Azure services to run effortlessly with outstanding responsiveness. Install the Jupyter Hub offers now in the Azure marketplace, your ideal companion in your data science journey!

Jupyter hub initiating coding in the cloud | Data Science Dojo

Related Topics

Statistics
Resources
Programming
Machine Learning
LLM
Generative AI
Data Visualization
Data Security
Data Science
Data Engineering
Data Analytics
Computer Vision
Career
Artificial Intelligence