Imagine tackling a mountain of laundry. You wouldn’t throw everything in one washing machine, right? You’d sort the delicates, towels, and jeans, sending each to its own specialized cycle.
The human brain does something similar when solving complex problems. We leverage our diverse skillset, drawing on specific knowledge depending on the task at hand.
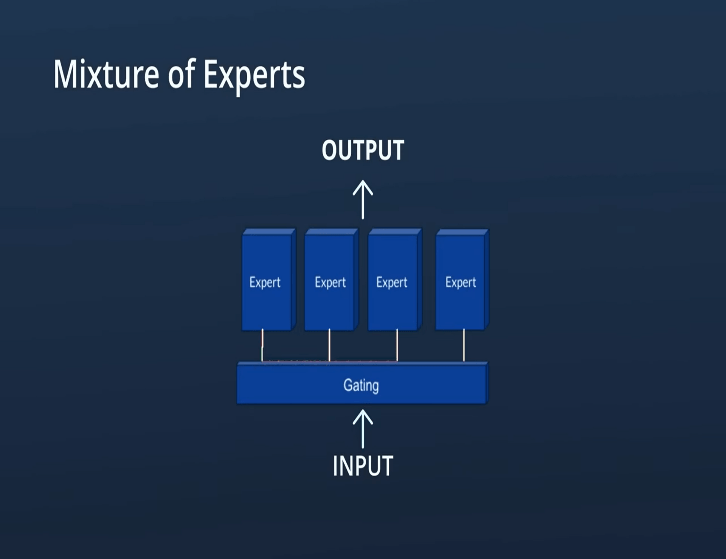
This blog delves into the fascinating world of Mixture of Experts (MoE), an artificial intelligence (AI) architecture that mimics this divide-and-conquer approach. MoE is not one model but a team of specialists—an ensemble of miniature neural networks, each an “expert” in a specific domain within a larger problem.
So, why is MoE important? This innovative model unlocks unprecedented potential in the world of AI. Forget brute-force calculations and mountains of parameters. MoE empowers us to build powerful models that are smarter, leaner, and more efficient.
It’s like having a team of expert consultants working behind the scenes, ensuring accurate predictions and insightful decisions, all while conserving precious computational resources.
This blog will be your guide on this journey into the realm of MoE. We’ll dissect its core components, unveil its advantages and applications, and explore the challenges and future of this revolutionary technology. Buckle up, fellow AI enthusiasts, and prepare to witness the power of specialization in the world of intelligent machines!
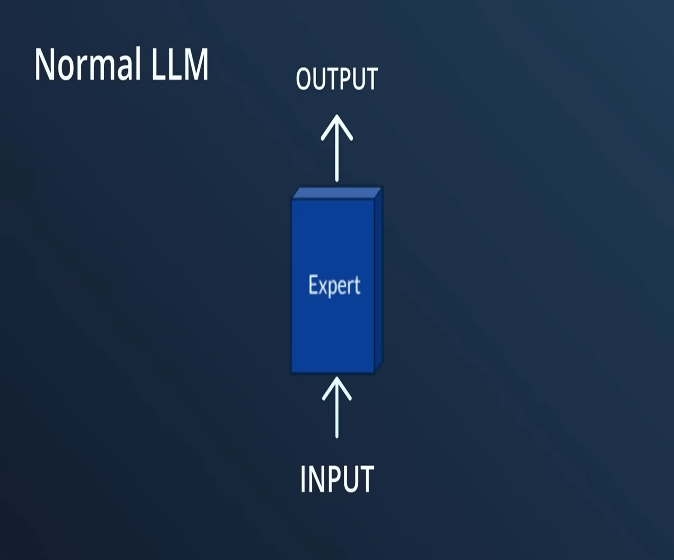
Imagine a bustling marketplace where each stall houses a master in their craft. In MoE, these stalls are the expert networks, each a miniature neural network trained to handle a specific subtask within the larger problem. These experts could be, for example:
Linguistics experts: adept at analyzing the grammar and syntax of language.
Factual experts: specializing in retrieving and interpreting vast amounts of data.
Visual experts: trained to recognize patterns and objects in images or videos.
The individual experts are relatively simple compared to the overall model, making them more efficient and flexible in adapting to different data distributions. This specialization also allows MoE to handle complex tasks that would overwhelm a single, monolithic network.
The Gatekeeper: Choosing the right expert
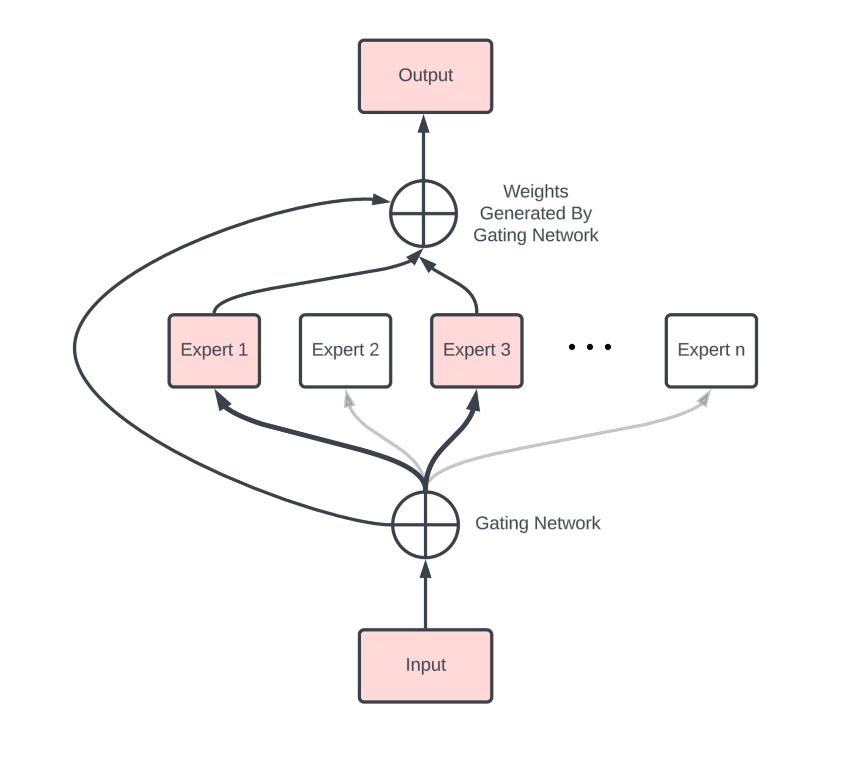
But how does MoE know which expert to call upon for a particular input? That’s where the gating function comes in. Imagine it as a wise oracle stationed at the entrance of the marketplace, observing each input and directing it to the most relevant expert stall.
The gating functiontypically another small neural network within the MoE architecture, analyzes the input and calculates a probability distribution over the expert networks. The input is then sent to the expert with the highest probability, ensuring the most suited specialist tackles the task at hand.
This gating mechanism is crucial for the magic of MoE. It dynamically assigns tasks to the appropriate experts, avoiding the computational overhead of running all experts on every input. This sparse activation, where only a few experts are active at any given time, is the key to MoE’s efficiency and scalability.
Traditional ensemble approach vs MoE:
MoE is not alone in the realm of ensemble learning. Techniques like bagging, boosting, and stacking have long dominated the scene. But how does MoE compare? Let’s explore its unique strengths and weaknesses in contrast to these established approaches
Bagging:
Both MoE and bagging leverage multiple models, but their strategies differ. Bagging trains independent models on different subsets of data and then aggregates their predictions by voting or averaging.
MoE, on the other hand, utilizes specialized experts within a single architecture, dynamically choosing one for each input. This specialization can lead to higher accuracy and efficiency for complex tasks, especially when data distributions are diverse.
Boosting:
While both techniques learn from mistakes, boosting focuses on sequentially building models that correct the errors of their predecessors. MoE, with its parallel experts, avoids sequential dependency, potentially speeding up training. However, boosting can be more effective for specific tasks by explicitly focusing on challenging examples.
Stacking:
Both approaches combine multiple models, but stacking uses a meta-learner to further refine the predictions of the base models. MoE doesn’t require a separate meta-learner, making it simpler and potentially faster. However, stacking can offer greater flexibility in combining predictions, potentially leading to higher accuracy in certain situations.
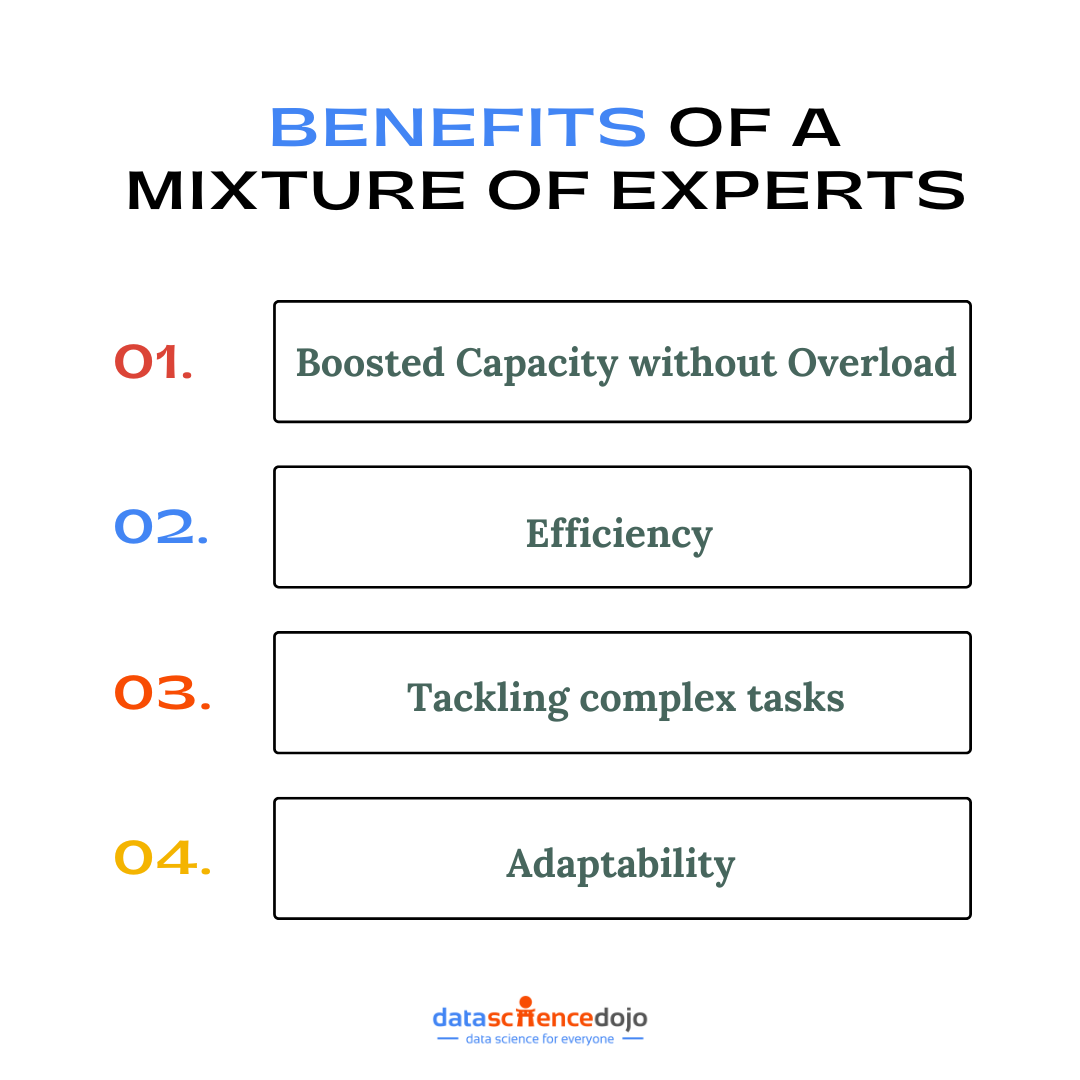
Advantages and benefits of a mixture of experts:
Boosted model capacity without parameter explosion:
The biggest challenge traditional neural networks face is complexity. Increasing their capacity often means piling on parameters, leading to computational nightmares and training difficulties.
MoE bypasses this by distributing the workload amongst specialized experts, increasing model capacity without the parameter bloat. This allows us to tackle more complex problems without sacrificing efficiency.
Efficiency:
MoE’s sparse activation is a game-changer in terms of efficiency. With only a handful of experts active per input, the model consumes significantly less computational power and memory compared to traditional approaches.
This translates to faster training times, lower hardware requirements, and ultimately, cost savings. It’s like having a team of skilled workers doing their job efficiently, while the rest take a well-deserved coffee break.
Tackling complex tasks:
By dividing and conquering, MoE allows experts to focus on specific aspects of a problem, leading to more accurate and nuanced predictions. Imagine trying to understand a foreign language – a linguist expert can decipher grammar, while a factual expert provides cultural context.
This collaboration leads to a deeper understanding than either expert could achieve alone. Similarly, MoE’s specialized experts tackle complex tasks with greater precision and robustness.
Adaptability:
The world is messy, and data rarely comes in neat, homogenous packages. MoE excels at handling diverse data distributions. Different experts can be trained on specific data subsets, making the overall model adaptable to various scenarios.
Think of it like having a team of multilingual translators – each expert seamlessly handles their assigned language, ensuring accurate communication across diverse data landscapes.
Applications of MoE:
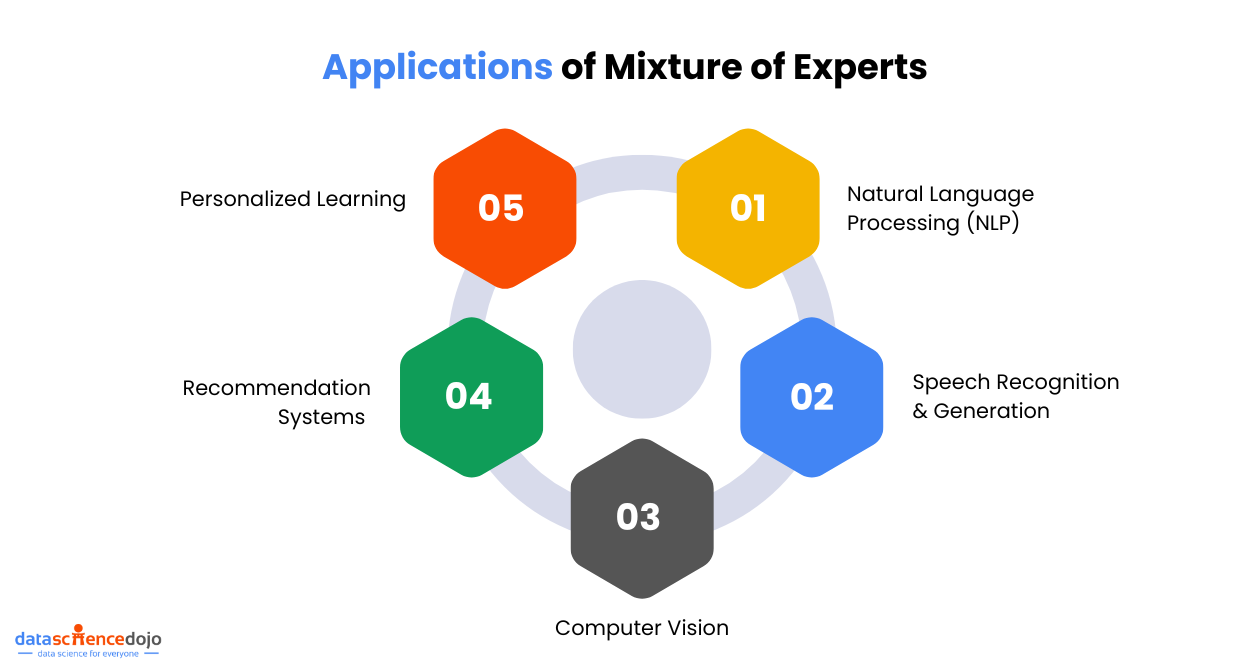
Now that we understand what Mixture of Experts are and how they work. Let’s explore some common applications of the Mixture of Experts models.
Natural language processing (NLP)
MoE’s experts can handle nuances, humor, and cultural references, delivering translations that sing and flow. Text summarization takes flight, condensing complex articles into concise gems, and dialogue systems evolve beyond robotic responses, engaging in witty banter and insightful conversations.
Computer vision:
Experts trained on specific objects, like birds in flight or ancient ruins, can identify them in photos with hawk-like precision. Video understanding takes center stage, analyzing sports highlights, deciphering news reports, and even tracking emotions in film scenes.
Speech recognition & generation:
MoE experts untangle accents, background noise, and even technical jargon. On the other side of the spectrum, AI voices powered by MoE can read bedtime stories with warmth and narrate audiobooks with the cadence of a seasoned storyteller.
Recommendation systems & personalized learning:
Get personalized product suggestions or adaptive learning plans crafted by MoE experts who understand you.
Challenges and limitations of MoE:
Training complexity:
Finding the right balance between experts and gating is a major challenge in training an MoE model. too few, and the model lacks capacity; too many, and training complexity spikes. Finding the optimal number of experts and calibrating their interaction with the gating function is a delicate balancing act.
Explainability and interpretability:
Unlike monolithic models, MoE’s internal workings can be opaque. Understanding which expert handles a specific input and why can be challenging, hindering interpretability and debugging efforts.
Hardware limitations:
While MoE shines in efficiency, scaling it to massive datasets and complex tasks can be hardware-intensive. Optimizing for specific architectures and leveraging specialized hardware, like TPUs, are crucial for tackling these scalability challenges.
MoE, shaping the future of AI:
This concludes our exploration of the Mixture of Experts. We hope you’ve gained valuable insights into this revolutionary technology and its potential to shape the future of AI. Remember, the journey doesn’t end here. Stay curious, keep exploring, and join the conversation as we chart the course for a future powered by the collective intelligence of humans and machines.
In the dynamic landscape of artificial intelligence, the emergence of Large Language Models (LLMs) has propelled the field of natural language processing into uncharted territories. As these models, exemplified by giants like GPT-3 and BERT, continue to evolve and scale in complexity, the need for robust evaluation methods becomes increasingly paramount.
This blog embarks on a journey through the transformative trends that have shaped the evaluation landscape of large language models. From the early benchmarks to the multifaceted metrics of today, we explore the nuanced evolution of evaluation methodologies.
Introduction to large language models (LLMs)
The advent of Large Language Models (LLMs) marks a transformative era in natural language processing, redefining the landscape of artificial intelligence. LLMs are sophisticated neural network-based models designed to understand and generate human-like text at an unprecedented scale.
Among the notable LLMs, OpenAI’s GPT (Generative Pre-trained Transformer) series and Google’s BERT (Bidirectional Encoder Representations from Transformers) have gained immense prominence.
Fueled by massive datasets and computational power, these models showcase an ability to grasp the context, generate coherent text, and even perform language-related tasks, from translation to question-answering.
The significance of LLMs lies not only in their impressive linguistic capabilities but also in their potential applications across various domains, such as content creation, conversational agents, and information retrieval. As we delve into the evolving trends in evaluating LLMs, understanding their fundamental role in reshaping how machines comprehend and generate language becomes crucial.
Early evaluation benchmarks
In the nascent stages of evaluating Large Language Models (LLMs), early benchmarks predominantly relied on simplistic metrics such as perplexity and accuracy. This was because LLMs were initially developed for specific tasks, such as machine translation and question answering.
As a result, accuracy was seen as a crucial measure of their performance—these rudimentary assessments aimed to gauge a model’s language generation capabilities and overall accuracy in processing information.
The following are some of the metrics that were used in the early evaluation of LLMs.
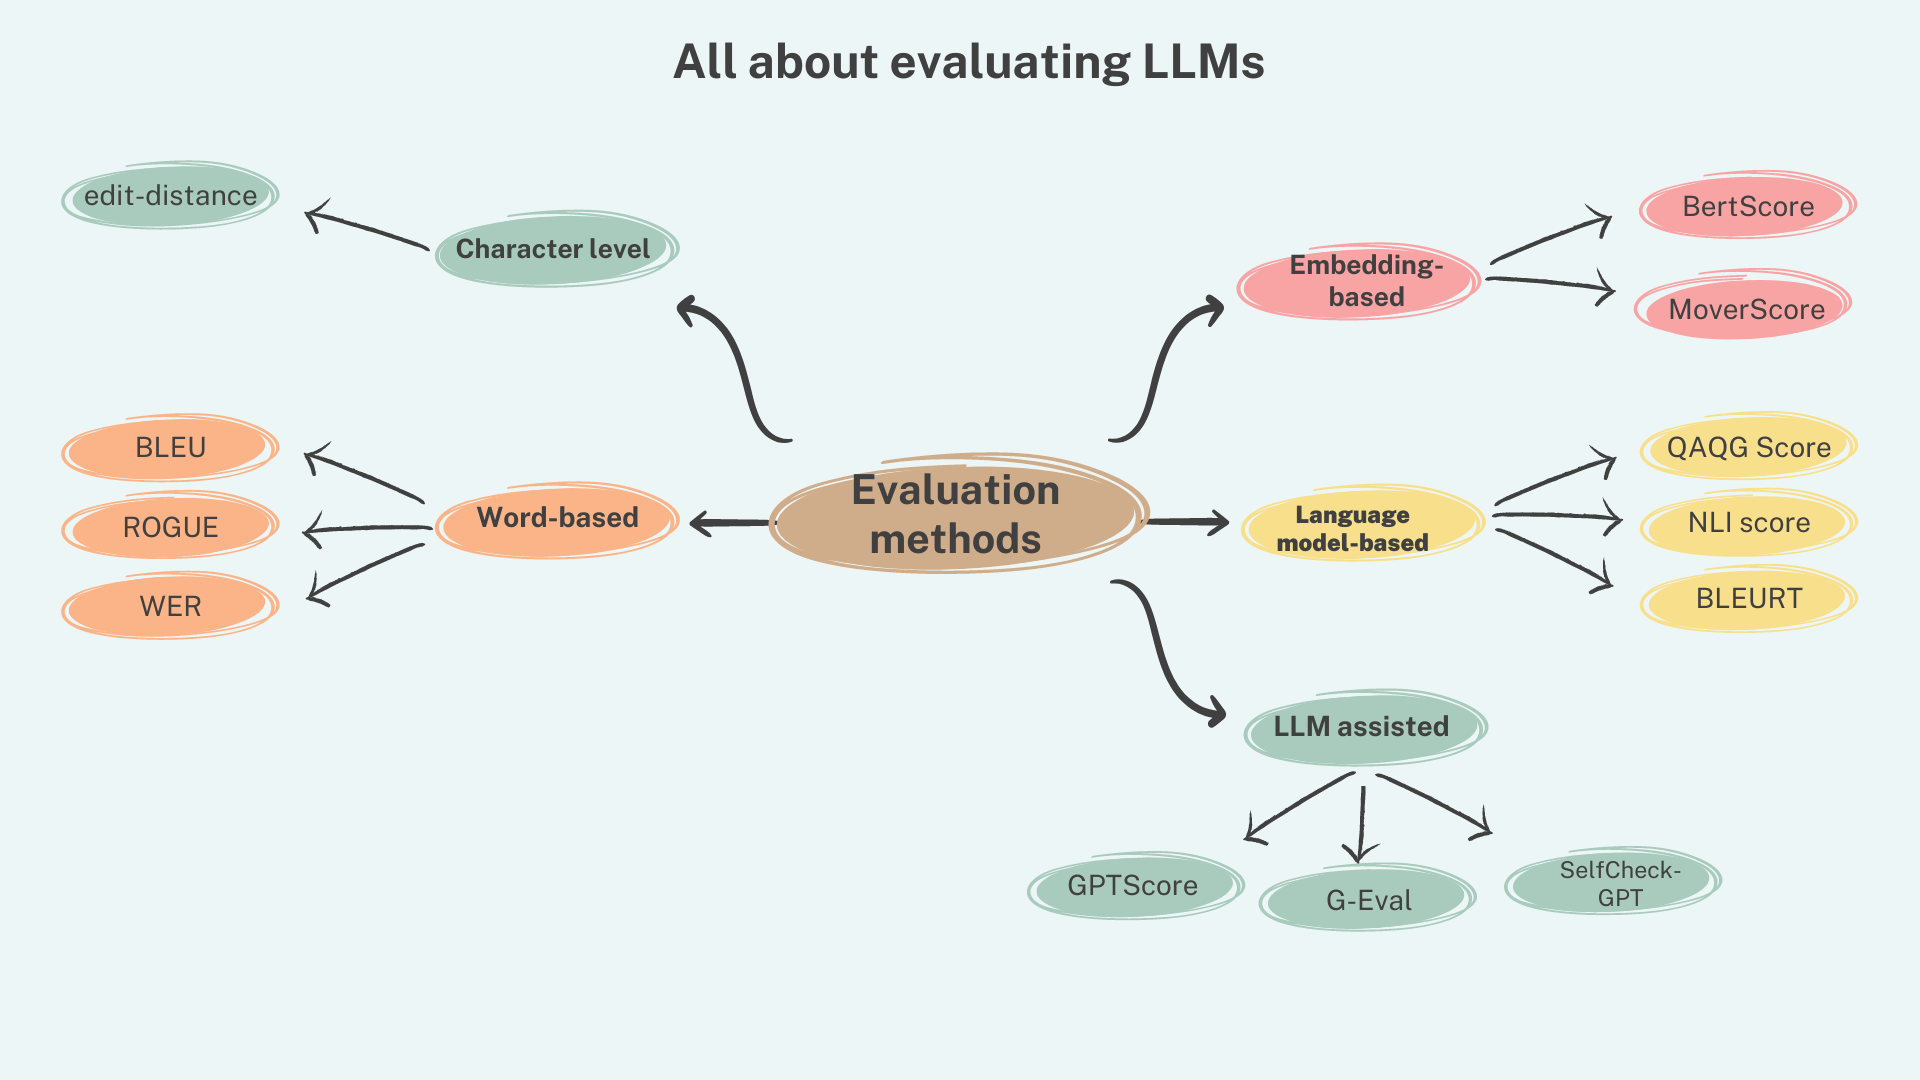
1. Word error rate (WER)
One of the earliest metrics used to evaluate LLMs was the Word Error Rate (WER). WER measures the percentage of errors in a machine-generated text compared to a reference text. It was initially used for machine translation evaluation, where the goal was to minimize the number of errors in the translated text.
WER is calculated by dividing the total number of errors by the total number of words in the reference text. Errors can include substitutions (replacing one word with another), insertions (adding words that are not in the reference text), and deletions (removing words that are in the reference text).
WER is a simple and intuitive metric that is easy to understand and calculate. However, it has some limitations. For example, it does not consider the severity of the errors. A single substitution of a common word may not be as serious as the deletion of an important word.
2. Perplexity
Another early metric used to evaluate LLMs was perplexity. Perplexity measures the likelihood of a machine-generated text given a language model. It was widely used for evaluating the fluency and coherence of generated text. Perplexity is calculated by exponentiating the negative average log probability of the words in the text. A lower perplexity score indicates that the language model can better predict the next word in the sequence.
Perplexity is a more sophisticated metric than WER, as it considers the probability of all the words in the text. However, it is still a measure of accuracy, and it does not capture all of the nuances of human language.
3. BLEU Score
One of the most widely used metrics for evaluating machine translation is the BLEU score. BLEU (Bilingual Evaluation Understudy) is a precision-based metric that compares a machine-generated translation to one or more human-generated references.
The BLEU score is calculated by finding the n-gram precision of the machine-generated translation. N-grams are sequences of n words, and precision is the proportion of n-grams that are correct in the machine-generated translation.
The BLEU score has been criticized for some of its limitations, such as its sensitivity to word order and its inability to capture the nuances of meaning. However, it remains a widely used metric for evaluating machine translation.
These early metrics played a crucial role in the development of LLMs, providing a way to measure their progress and identify areas for improvement. However, as the complexity of LLMs burgeoned, it became apparent that these early benchmarks offered a limited perspective on the models’ true potential.
The evolving nature of language tasks demanded a shift towards more holistic evaluation metrics. The transition from these initial benchmarks marked a pivotal moment in the evaluation landscape, urging researchers to explore more nuanced methodologies that could capture the diverse capabilities of LLMs across various language tasks and domains.
This shift laid the foundation for a more comprehensive understanding of the models’ linguistic prowess and set the stage for transformative trends in the evaluation of Large Language Models.
Holistic evaluation:
As large language models (LLMs) have evolved from simple text generators to sophisticated tools capable of understanding and responding to complex tasks, the need for a more holistic approach to evaluation has become increasingly apparent. Moving beyond the limitations of accuracy-focused metrics, holistic evaluation aims to capture the diverse capabilities of LLMs and provide a comprehensive assessment of their performance.
While accuracy remains a crucial aspect of LLM evaluation, it alone cannot capture the nuances of their performance. LLMs are not just about producing grammatically correct text; they are also expected to generate fluent, coherent, creative, and fair text. Accuracy-focused metrics often fail to capture these broader aspects, leading to an incomplete understanding of LLM capabilities.
Holistic evaluation framework
Holistic evaluation encompasses a range of metrics that assess various aspects of LLM performance, including:
Fluency: The ability of the LLM to generate text that is grammatically correct, natural-sounding, and easy to read.
Coherence: The ability of the LLM to generate text that is organized, well-structured, and easy to understand.
Creativity: The ability of the LLM to generate original, imaginative, and unconventional text formats.
Relevance: The ability of the LLM to produce text that is pertinent to the given context, task, or topic.
Fairness: The ability of the LLM to avoid biases and stereotypes in its outputs, ensuring that it is free from prejudice and discrimination.
Interpretability: The ability of the LLM to explain its reasoning process, make its decisions transparent, and provide insights into its internal workings.
Holistic evaluation metrics:
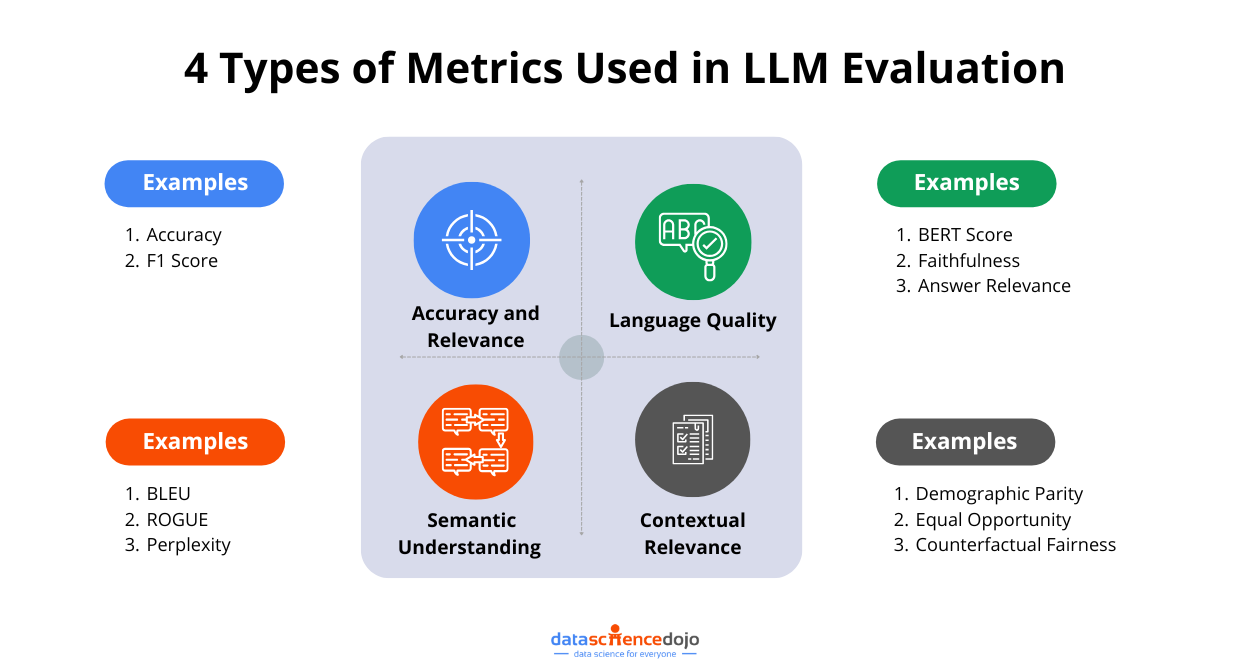
Several metrics have been developed to assess these holistic aspects of LLM performance. Some examples include:
1. METEOR
METEOR is a metric for evaluating machine translation (MT). It combines precision and recall to assess the fluency and adequacy of machine-generated translations. METEOR considers factors such as matching words, matching stems, chunk matches, synonymy matches, and ordering.
METEOR has been shown to correlate well with human judgments of translation quality. It is a versatile metric that can be used to evaluate translations of various lengths and genres.
2. GEANT
GEANT is a human-based evaluation scheme for assessing the overall quality of machine translation. It considers aspects like fluency, adequacy, and relevance. GEANT involves a panel of human evaluators who rate machine-generated translations on a scale of 1 to 4.
GEANT is a more subjective metric than METEOR, but it is considered to be a more reliable measure of overall translation quality.
3. ROUGE
ROUGE (Recall-Oriented Understudy for Gisting Evaluation) is a recall-based metric for evaluating machine-generated summaries. It focuses on the recall of important words and phrases in the summaries. ROUGE considers the following factors:
N-gram recall: The number of matching n-grams (sequences of n words) between the machine-generated summary and a reference summary.
Skip-gram recall: The number of matching skip-grams (sequences of words that may not be adjacent) between the machine-generated summary and a reference summary.
ROUGE has been shown to correlate well with human judgments of summary quality. It is a versatile metric that can be used to evaluate summaries of various lengths and genres.
Multifaceted evaluation metrics:
As LLMs like GPT-3 and BERT took center stage, the demand for more nuanced evaluation metrics surged. Researchers and practitioners recognized the need to evaluate models across a spectrum of language tasks and domains.
Enter the era of multifaceted evaluation, where benchmarks expanded to include sentiment analysis, question answering, summarization, and translation. This shift allowed for a more comprehensive understanding of a model’s versatility and adaptability.
Several metrics have been developed to assess these multifaceted aspects of LLM performance. Some examples include:
1. Semantic similarity:
Metrics like word embeddings and sentence embeddings measure the similarity between machine-generated text and human-written text, capturing nuances of meaning and context.
2. Human evaluation panels:
Subjective assessments by trained human evaluators provide in-depth feedback on the quality of LLM outputs, considering aspects like fluency, coherence, creativity, relevance, and fairness.
3. Interpretability methods:
Techniques like LIME (Local Interpretable Model-agnostic Explanations) and SHAP (Shapley Additive explanations) enable us to understand the reasoning process behind LLM outputs, addressing concerns about interpretability.
4. Bias detection and mitigation:
Metrics and techniques to identify and address potential biases in LLM training data and outputs, ensuring fairness and non-discrimination.
5. Multidimensional evaluation frameworks:
Comprehensive frameworks like the FLUE (Few-shot Learning Evaluation) benchmark and the PaLM benchmark encompass a wide range of tasks and evaluation criteria, providing a holistic assessment of LLM capabilities.
LLMs evaluating LLMs
LLMs Evaluating LLMs is an emerging approach to assessing the performance of large language models (LLMs) by leveraging the capabilities of LLMs themselves. This approach aims to overcome the limitations of traditional evaluation metrics, which often fail to capture the nuances and complexities of LLM performance.
Benefits of LLM-based Evaluation
Large language models offer several advantages over traditional evaluation methods:
Comprehensiveness: It can capture a broader range of aspects than traditional metrics, providing a more holistic assessment of LLM performance.
Context-awareness: It has an ability to adapt to specific tasks and domains, generating reference text and evaluating outputs within relevant contexts.
Nuanced feedback: LLMs can identify subtle nuances and provide detailed feedback on fluency, coherence, creativity, relevance, and fairness, enabling more precise evaluation.
Adaptability: Language models can evolve alongside the development of new LLM models, continuously adapting their evaluation methods to assess the latest advancements.
Mechanism of LLM-based evaluation
LLMs can be utilized in various ways to evaluate other LLMs:
1.Generating reference text:
Large language models can be used to generate reference text against which the outputs of other LLMs can be compared. This reference text can be tailored to specific tasks or domains, providing a more relevant and context-aware evaluation.
2. Assessing fluency and coherence:
They can be employed to assess the fluency and coherence of text generated by other LLMs. They can identify grammatical errors, inconsistencies, and lack of clarity in the generated text, providing valuable feedback for improvement.
3. Evaluating creativity and originality:
It also evaluates the creativity and originality of text generated by other LLMs. They can identify novel ideas, unconventional expressions, and the ability to break away from established patterns, providing insights into the creative potential of different models.
4. Assessing relevance and fairness:
LLMs can be used to assess the relevance and fairness of text generated by other LLMs. They can identify text that is not pertinent to the given context or task, as well as text that contains biases or stereotypes, promoting responsible and ethical development of LLMs.
GPT-Eval
GPTEval is a framework for evaluating the quality of natural language generation (NLG) outputs using large language models (LLMs). GPTEval was popularized by a paper released on May 2023 called “G-EVAL: NLG Evaluation using GPT-4 with Better Human Alignment”.
It utilizes a chain-of-thoughts (CoT) approach and a form-filling paradigm to assess the coherence, fluency, and informativeness of generated text. The framework has been shown to correlate highly with human judgments in text summarization and dialogue generation tasks.
GPTEval addresses the limitations of traditional reference-based metrics, such as BLEU and ROUGE, which often fail to capture the nuances and creativity of human-generated text. By employing LLMs, GPTEval provides a more comprehensive and human-aligned evaluation of NLG outputs.
Key features of GPTEval include:
Chain-of-thoughts (CoT) approach: GPTEval breaks down the evaluation process into a sequence of reasoning steps, mirroring the thought process of a human evaluator.
Form-filling paradigm: It utilizes a form-filling interface to guide the LLM in providing comprehensive and informative evaluations.
Human-aligned evaluation: It demonstrates a strong correlation with human judgments, indicating its ability to capture the quality of NLG outputs from a human perspective.
GPTEval represents a significant advancement in NLG evaluation, offering a more accurate and human-centric approach to assessing the quality of the generated text. Its potential applications span a wide range of domains, including machine translation, dialogue systems, and creative text generation.
Challenges in LLM evaluations
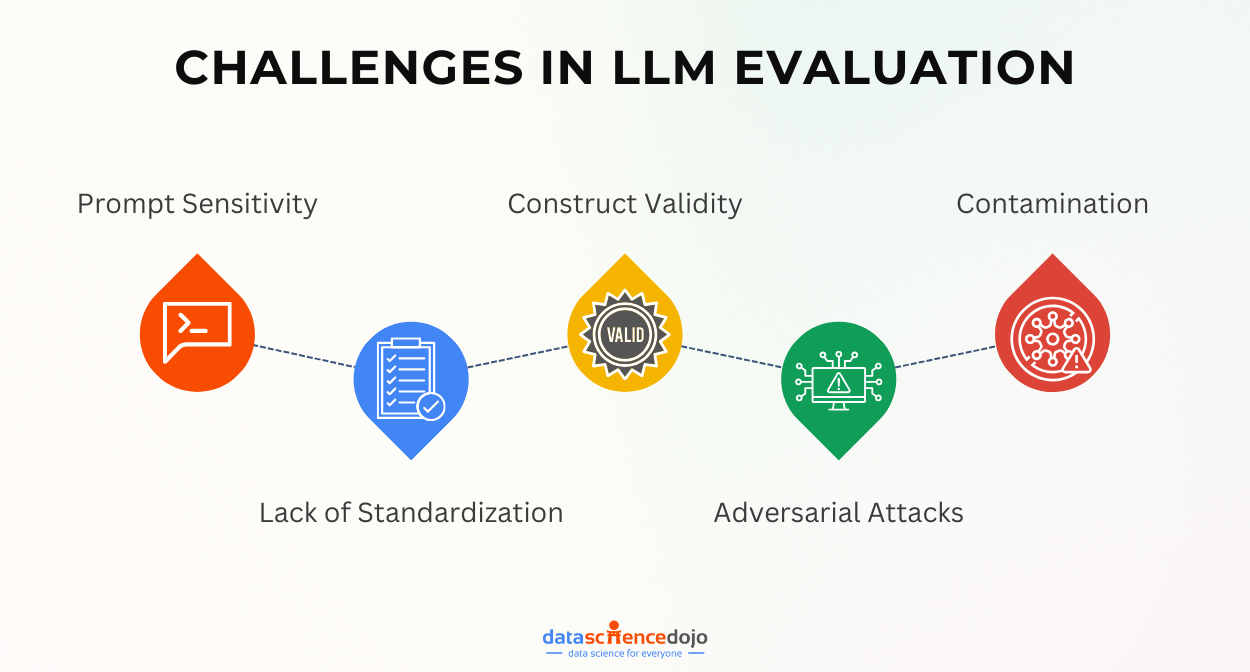
The evaluation of Large Language Models (LLMs) is a complex and evolving field, and there are several challenges that researchers face while evaluating LLMs. Some of the current challenges in evaluating LLMs are:
Prompt sensitivity: Determining if an evaluation metric accurately measures the unique qualities of a model or is influenced by the specific prompt.
Construct validity: Defining what constitutes a satisfactory answer for diverse use cases proves challenging due to the wide range of tasks that LLMs are employed for.
Contamination: The presence of bias in LLMs introduces risk, and discerning whether the model harbors a liberal or conservative bias is a complex task.
Lack of standardization: The absence of standardized evaluation practices leads to researchers employing diverse benchmarks and rankings to assess LLM performance, contributing to a lack of consistency in evaluations.
Adversarial attacks: LLMs are susceptible to adversarial attacks, posing a challenge in evaluating their resilience and robustness against such intentional manipulations.
Future horizons for evaluating large language models
The core objective in evaluating Large Language Models (LLMs) is to align them with human values, fostering models that embody helpfulness, harmlessness, and honesty. Recognizing current evaluation limitations as LLM capabilities advance, there’s a call for a dynamic process.
This section explores pivotal future directions: Risk Evaluation, Agent Evaluation, Dynamic Evaluation, and Enhancement-Oriented Evaluation, aiming to contribute to the evolution of sophisticated, value-aligned LLMs.
Evaluating risks:
Current risk evaluations, often tied to question answering, may miss nuanced behaviors in LLMs with RLHF. Recognizing QA limitations, there’s a call for in-depth risk assessments, delving into why and how behaviors manifest to prevent catastrophic outcomes.
Navigating environments: Efficient evaluation:
Efficient LLM evaluation depends on specific environments. Existing agent research focuses on capabilities, prompting a need to diversify operating environments to understand potential risks and enhance environmental diversity.
Dynamic challenges: Rethinking benchmarks:
Static benchmarks present challenges, including data leakage and limitations in assessing dynamic knowledge. Dynamic evaluation emerges as a promising alternative. Through continuous data updates and varied question formats, this aligns with LLMs’ evolving nature. The goal is to ensure benchmarks remain relevant and challenging as LLMs progress toward human-level performance.
Conclusion
In conclusion, the evaluation of Large Language Models (LLMs) has undergone a transformative journey, adapting to the dynamic capabilities of these sophisticated language generation systems. From early benchmarks to multifaceted metrics, the quest for a comprehensive understanding has been evident.
The trends explored, including contextual considerations, human-centric assessments, and ethical awareness, signify a commitment to responsible AI development. Challenges like bias, adversarial attacks, and standardization gaps emphasize the complexity of LLM evaluation.
Looking ahead, a holistic approach that embraces diverse perspectives evolves benchmarks, and prioritizes ethics is crucial. These transformative trends not only shape the evaluation of LLMs but also contribute to their development aligned with human values. As we navigate this evolving landscape, we uncover the path to unlocking the full potential of language models in the expansive realm of artificial intelligence.
“Statistics is the grammar of science”, Karl Pearson
In the world of data science, there is a secret language that benefits those who understand it. Do you want to know what makes a data expert efficient? It’s having a profound understanding of the data. Unfortunately, you can’t have a friendly conversation with the data, but don’t worry, we have the next best solution.
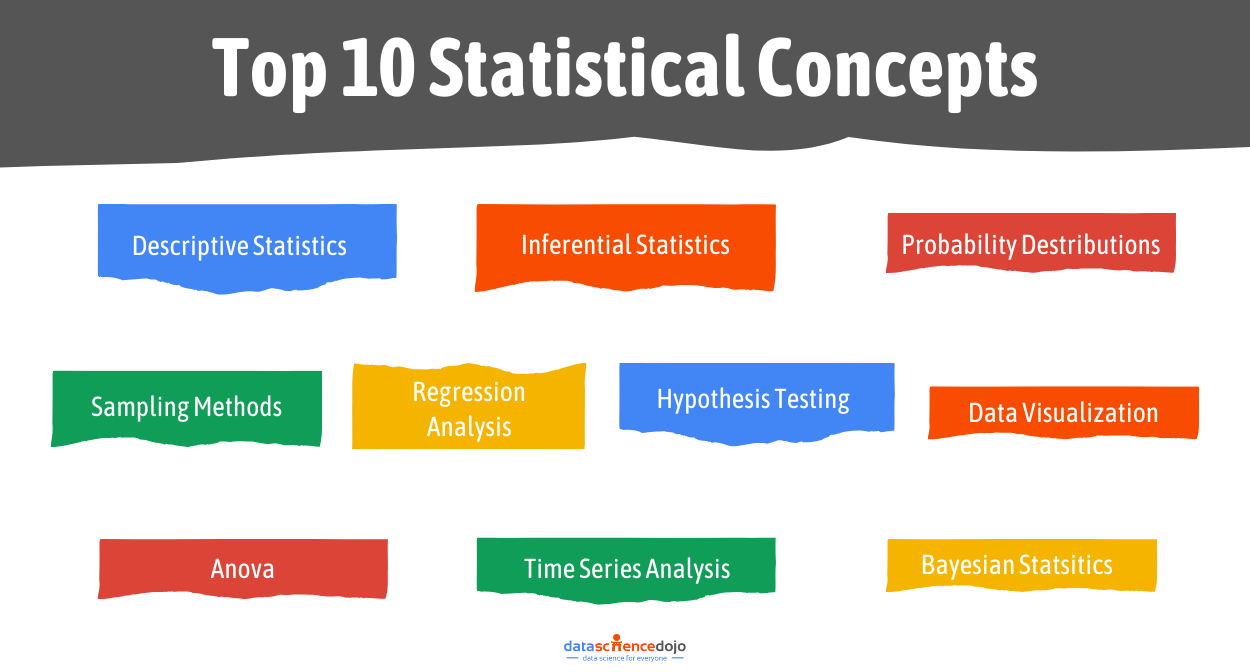
Here are the top ten statistical concepts that you must have in your arsenal. Whether you’re a budding data scientist, a seasoned professional, or merely intrigued by the inner workings of data-driven decision-making, prepare for an enthralling exploration of the statistical principles that underpin the world of data science.
10 statistical concepts you should know
1. Descriptive statistics:
Starting with the most fundamental and essential statistical concept, descriptive statistics. Descriptive statistics are the specific methods and measures that describe the data. It’s like the foundation of your building. It is a sturdy groundwork upon which further analysis can be constructed. Descriptive statistics can be broken down into measures of central tendency and measures of variability.
Measure of Central Tendency:
Central Tendency is defined as “the number used to represent the center or middle of a set of data values”. It is a single value that is typically representative of the whole data. They help us understand where the “average” or “central” point lies amidst a collection of data points.
There are a few techniques to find the central tendency of the data, namely “Mean” (average), “Median” (middle value when data is sorted), and “Mode” (most frequently occurring values).
Measures of variability:
Measures of variability describe the spread, dispersion, and deviation of the data. In essence, they tell us how much each value point deviates from the central tendency. A few measures of variability are “Range”, “Variance”, “Standard Deviation”, and “Quartile Range”. These provide valuable insights into the degree of variability or uniformity in the data.
2. Inferential statistics:
Inferential statistics enable us to draw conclusions about the population from a sample of the population. Imagine having to decide whether a medicinal drug is good or bad for the general public. It is practically impossible to test it on every single member of the population.
This is where inferential statistics comes in handy. Inferential statistics employ techniques such as hypothesis testing and regression analysis (also discussed later) to determine the likelihood of observed patterns occurring by chance and to estimate population parameters.
This invaluable tool empowers data scientists and researchers to go beyond descriptive analysis and uncover deeper insights, allowing them to make data-driven decisions and formulate hypotheses about the broader context from which the data was sampled.
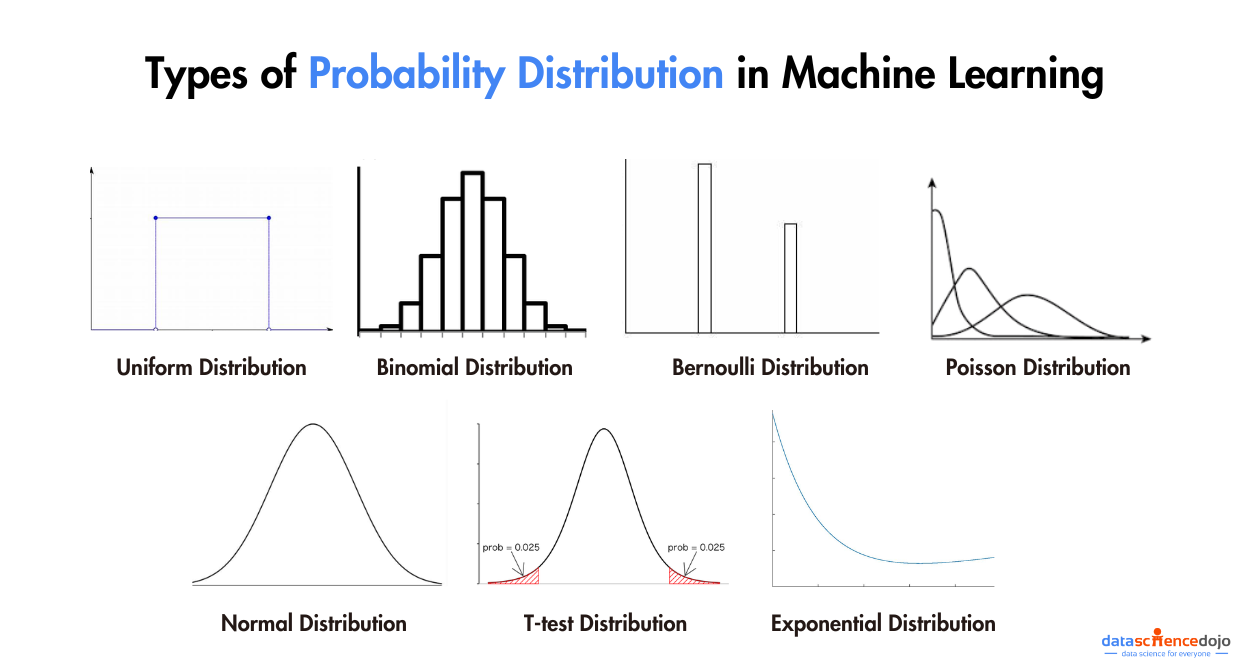
3. Probability distributions:
Probability distributions serve as foundational concepts in statistics and mathematics, providing a structured framework for characterizing the probabilities of various outcomes in random events. These distributions, including well-known ones like the normal, binomial, and
Poisson distributions offer structured representations for understanding how data is distributed across different values or occurrences.
Much like navigational charts guiding explorers through uncharted territory, probability distributions function as reliable guides through the landscape of uncertainty, enabling us to quantitatively assess the likelihood of specific events.
They constitute essential tools for statistical analysis, hypothesis testing, and predictive modeling, furnishing a systematic approach to evaluate, analyze, and make informed decisions in scenarios involving randomness and unpredictability. Comprehension of probability distributions is imperative for effectively modeling and interpreting real-world data and facilitating accurate predictions.
We now know inferential statistics help us make conclusions about the population from a sample of the population. How do we ensure that the sample is representative of the population? This is where sampling methods come to aid us.
Sampling methods are a set of methods that help us pick our sample set out of the population. Sampling methods are indispensable in surveys, experiments, and observational studies, ensuring that our conclusions are both efficient and statistically valid. There are many types of sampling methods. Some of the most common ones are defined below.
Simple Random Sampling: A method where each member of the population has an equal chance of being selected for the sample, typically through random processes.
Stratified Sampling: The population is divided into subgroups (strata), and a random sample is taken from each stratum in proportion to its size.
Systematic Sampling: Selecting every “kth” element from a population list, using a systematic approach to create the sample.
Cluster Sampling: The population is divided into clusters, and a random sample of clusters is selected, with all members in selected clusters included.
Convenience Sampling: Selection of individuals/items based on convenience or availability, often leading to non-representative samples.
Purposive (Judgmental) Sampling: Researchers deliberately select specific individuals/items based on their expertise or judgment, potentially introducing bias.
Quota Sampling: The population is divided into subgroups, and individuals are purposively selected from each subgroup to meet predetermined quotas.
Snowball Sampling: Used in hard-to-reach populations, where participants refer researchers to others, leading to an expanding sample.
5. Regression analysis:
Regression analysis is a statistical method that helps us quantify the relationship between a dependent variable and one or more independent variables. It’s like drawing a line through data points to understand and predict how changes in one variable relate to changes in another.
Regression models, such as linear regression or logistic regression, are used to uncover patterns and causal relationships in diverse fields like economics, healthcare, and social sciences. This technique empowers researchers to make predictions, analyze cause-and-effect connections, and gain insights into complex phenomena.
6. Hypothesis testing:
Hypothesis testing is a key statistical method used to assess claims or hypotheses about a population using sample data. It’s like a process of weighing evidence to determine if there’s enough proof to support a hypothesis.
Researchers formulate a null hypothesis and an alternative hypothesis, then use statistical tests to evaluate whether the data supports rejecting the null hypothesis in favor of the alternative.
This method is crucial for making informed decisions, drawing meaningful conclusions, and assessing the significance of observed effects in various fields of research and decision-making.
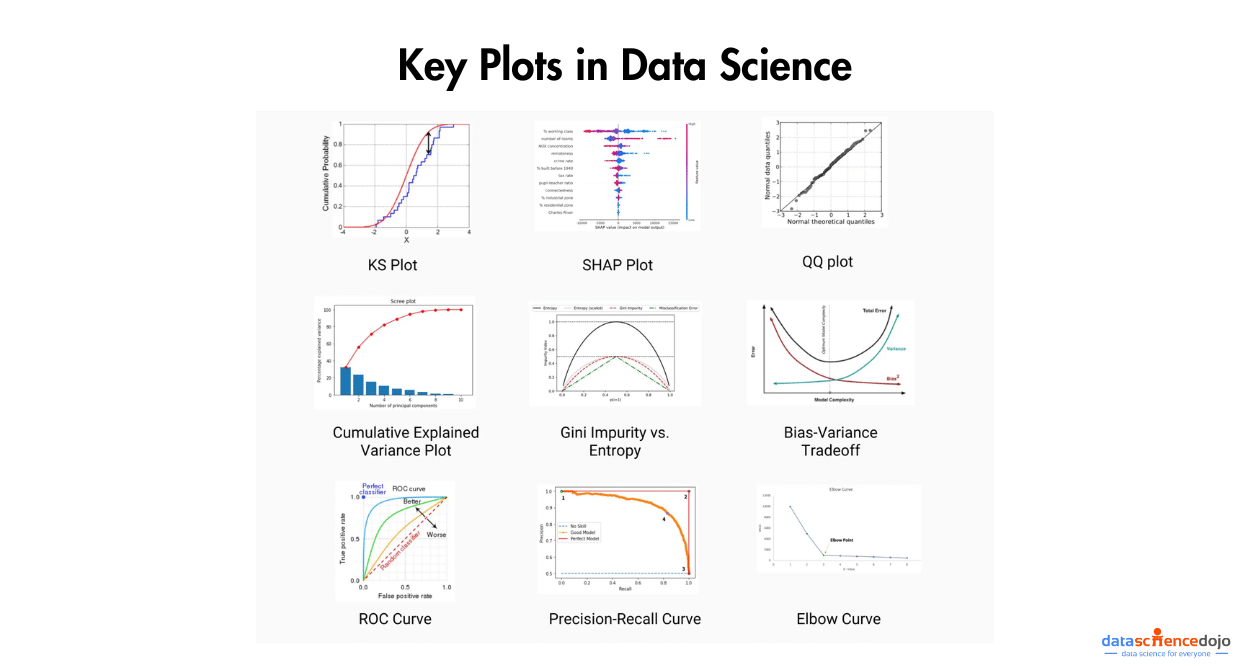
7. Data visualizations:
Data visualization is the art and science of representing complex data in a visual and comprehensible form. It’s like translating the language of numbers and statistics into a graphical story that anyone can understand at a glance.
Effective data visualization not only makes data more accessible but also allows us to spot trends, patterns, and outliers, making it an essential tool for data analysis and decision-making. Whether through charts, graphs, maps, or interactive dashboards, data visualization empowers us to convey insights, share information, and gain a deeper understanding of complex datasets.
Check out some of the most important plots for Data Science here.
8. ANOVA (Analysis of variance):
Analysis of Variance (ANOVA) is a statistical technique used to compare the means of two or more groups to determine if there are significant differences among them. It’s like the referee in a sports tournament, checking if there’s enough evidence to conclude that the teams’ performances are different.
ANOVA calculates a test statistic and a p-value, which indicates whether the observed differences in means are statistically significant or likely occurred by chance.
This method is widely used in research and experimental studies, allowing researchers to assess the impact of different factors or treatments on a dependent variable and draw meaningful conclusions about group differences. ANOVA is a powerful tool for hypothesis testing and plays a vital role in various fields, from medicine and psychology to economics and engineering.
9. Time Series analysis:
Time series analysis is a specialized field of statistics and data science that focuses on studying data points collected, recorded, or measured over time. It’s like examining the historical trajectory of a variable to understand its patterns and trends.
Time series analysis involves techniques for data visualization, smoothing, forecasting, and modeling to uncover insights and make predictions about future values.
This discipline finds applications in various domains, from finance and economics to climate science and stock market predictions, helping analysts and researchers understand and harness the temporal patterns within their data.
10. Bayesian statistics:
Bayesian statistics is a branch of statistics that takes a unique approach to probability and inference. Unlike classical statistics, which use fixed parameters, Bayesian statistics treat probability as a measure of uncertainty, updating beliefs based on prior information and new evidence.
It’s like continually refining your knowledge as you gather more data. Bayesian methods are particularly useful when dealing with complex, uncertain, or small-sample data, and they have applications in fields like machine learning, Bayesian networks, and decision analysis