Data Science Dojo is offering RStudio for FREE on Azure Marketplace packaged with a pre-installed running version of R alongside other language backends to simplify Data Science.
What is data science?
Data Science is one of the quickest-growing areas of work in the industry. According to Harvard Business Review, it’s regarded as the “sexiest job of the 21st century”.
Data science joins math and measurements, programming, refined analyses, machine learning and AI to reveal significant knowledge concealed in an association’s dataset. These understandings can be utilized to direct businesses in planning and decision making. The lifecycle of Data Science involves data collection (ingestion), data pre-processing and wrangling, predictive data analysis via machine learning and finally communication of outcomes for future strategies.
Pro Tip: Join our 6-months instructor-led Data Science Bootcamp to master data science.
Challenges faced by developers
Individuals who were learning or pursuing Data Science and Machine Learning through R found it difficult to code and develop models using only a terminal or command line interface. Developers who wanted to perform extensive high powered ML operations but didn’t have enough computation power to do it locally was also another challenge.
In these circumstances an interactive environment configured with R can help the users in gaining hands-on experience with machine learning, data analysis and other statistical operations.
Working with RStudio
RStudio is an open-source tool that gives you an effortless coding IDE in the cloud with a pre-installed R programming language to start your data mining and analytics work. It is integrated with a set of modules that make code development, scientific computing, and graphical jobs to be more productive and easier. This tool allows developers to perform a variety of technical tasks such as predictive modeling, clustering, multivariate querying, stock market rate, spam filtering, recommendation systems, malware, and anomaly detection, image recognition, and medical diagnosis.
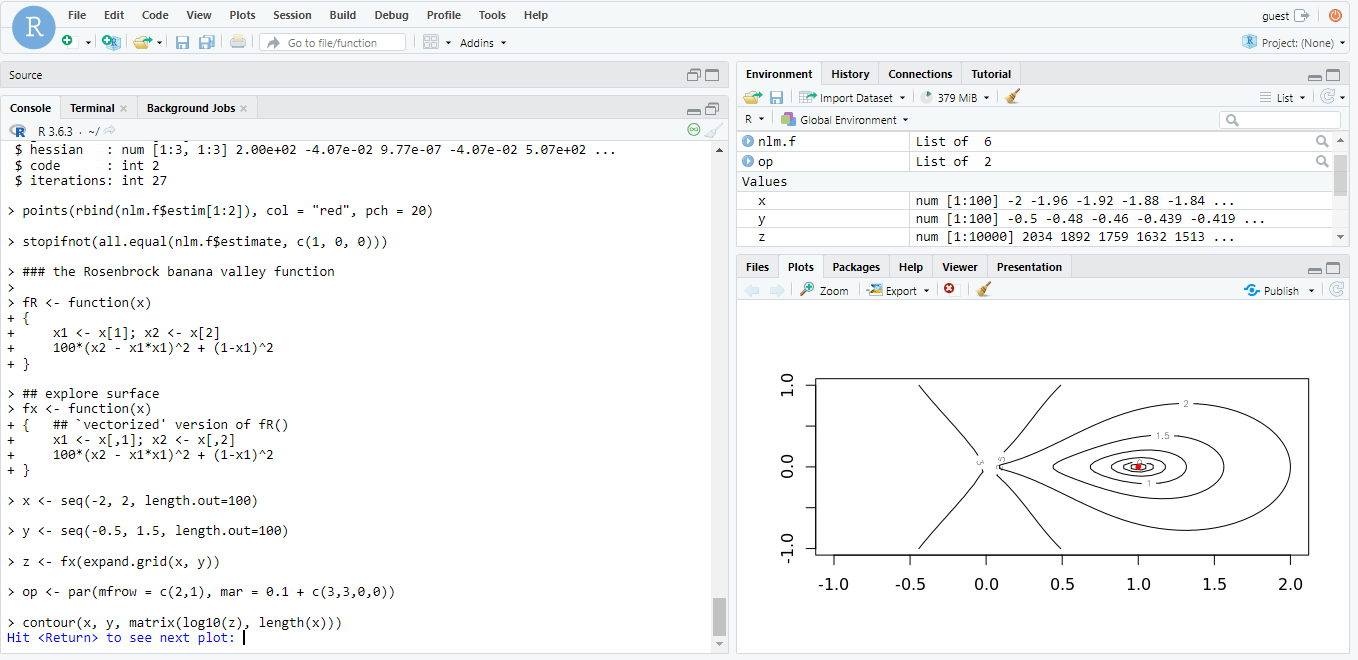
Web interface of RStudio Server executing a demo R function
Key attributes
Provides an in-browser coding environment with syntax suggestions, autocomplete code feature and smart indentation
Provides the user with an easy-to-use free coding platform accessible at the local web server, powered by Azure machines
Apart from the primary built of R, RStudio has support for other famous interpreters as well such as Python, SQL, HTML, CSS, JS, C, Quarto and a few others
In-built debugging functionality by toggling breakpoints to detect and eradicate the issues or fix them quickly
As the computations are carried on Microsoft’s cloud servers, there is no memory or performance pressure on the company’s storage devices
In order to optimize the workload, the RAM and compute power can be scaled accordingly, thanks to Azure services
What Data Science Dojo has for you
The RStudio instance packaged by Data Science Dojo provides an in-browser coding environment with a running version of R pre-deployed in it, reducing the burden of installation. With an interactive user-friendly GUI-based application, developers can perform Machine Learning tasks with comfort and flexibility.
A browser based RStudio environment up and running with R pre-deployed
Convenient accessibility and navigation
Ability to work with different language scripts simultaneously
Rich graphics and interactive environment
Support for git and version control
Code consoles to run code interactively, with full support for rich output
Integrated R documentation and user help
Readily available cheat sheets to get started
Our instance supports the following backends:
R
Python
HTML
CSS
JavaScript
Quarto
C
SQL
Shell
Markdown and Header files
Conclusion
RStudio provides customers with an easy-to-use environment to gain hands-on experience with Machine Learning and Data Science. The responsiveness and processing speed are much better than the traditional desktop environment as it uses Microsoft cloud services. It comes with built-in support for git and version control.
Several variants of the R script can be executed in RStudio. It allows users to work on a variety of language backends at the same time with smart observability of variables and values side by side. The documentation and user support are incorporated into the tool to make it easy for developers to code.
At Data Science Dojo, we deliver data science education, consulting, and technical services to increase the power of data. We are therefore adding a free RStudio instance dedicated specifically to Machine Learning and Data Science on Azure Marketplace. Now hurry up and avail this offer by Data Science Dojo, your ideal companion in your journey to learn data science!
Click on the button below to head over to the Azure Marketplace and deploy Rstudio for FREE by clicking on “Get it now”.
Note: You’ll have to sign up to Azure, for free, if you do not have an existing account.
Programming has an extremely vast package ecosystem. It provides robust tools to master all the core skill sets of data science.
For someone like me, who has only some programming experience in Python, the syntax of R programming felt alienating, initially. However, I believe it’s just a matter of time before you adapt to the unique logicality of a new language. The grammar of R flows more naturally to me after having to practice for a while. I began to grasp its kind of remarkable beauty, a beauty that has captivated the heart of countless statisticians throughout the years.
If you don’t know what R programming is, it’s essentially a programming language created for statisticians by statisticians. Hence, it easily becomes one of the most fluid and powerful tools in the field of data science.
Here I’d like to walk through my study notes with the most explicit step-by-step directions to introduce you to the world of R.
Why learn R for data science?
Before diving in, you might want to know why should you learn R for Data Science. There are two major reasons:
1. Powerful analytic packages for data science
Firstly, R programming has an extremely vast package ecosystem. It provides robust tools to master all the core skill sets of Data Science, from data manipulation, and data visualization, to machine learning. The vivid community keeps the R language’s functionalities growing and improving.
2. High industry popularity and demand
With its great analytical power, R programming is becoming the lingua franca for data science. It is widely used in the industry and is in heavy use at several of the best companies that are hiring Data Scientists including Google and Facebook. It is one of the highly sought-after skills for a Data Science job.
To start programming with R on your computer, you need two things: R and RStudio.
Install R language
You have to first install the R language itself on your computer (It doesn’t come by default). To download R, go to CRAN, https://cloud.r-project.org/ (the comprehensive R archive network). Choose your system and select the latest version to install.
Install RStudio
You also need a hefty tool to write and compile R code. RStudio is the most robust and popular IDE (integrated development environment) for R. It is available on http://www.rstudio.com/download (open source and for free!).
Overview of RStudio
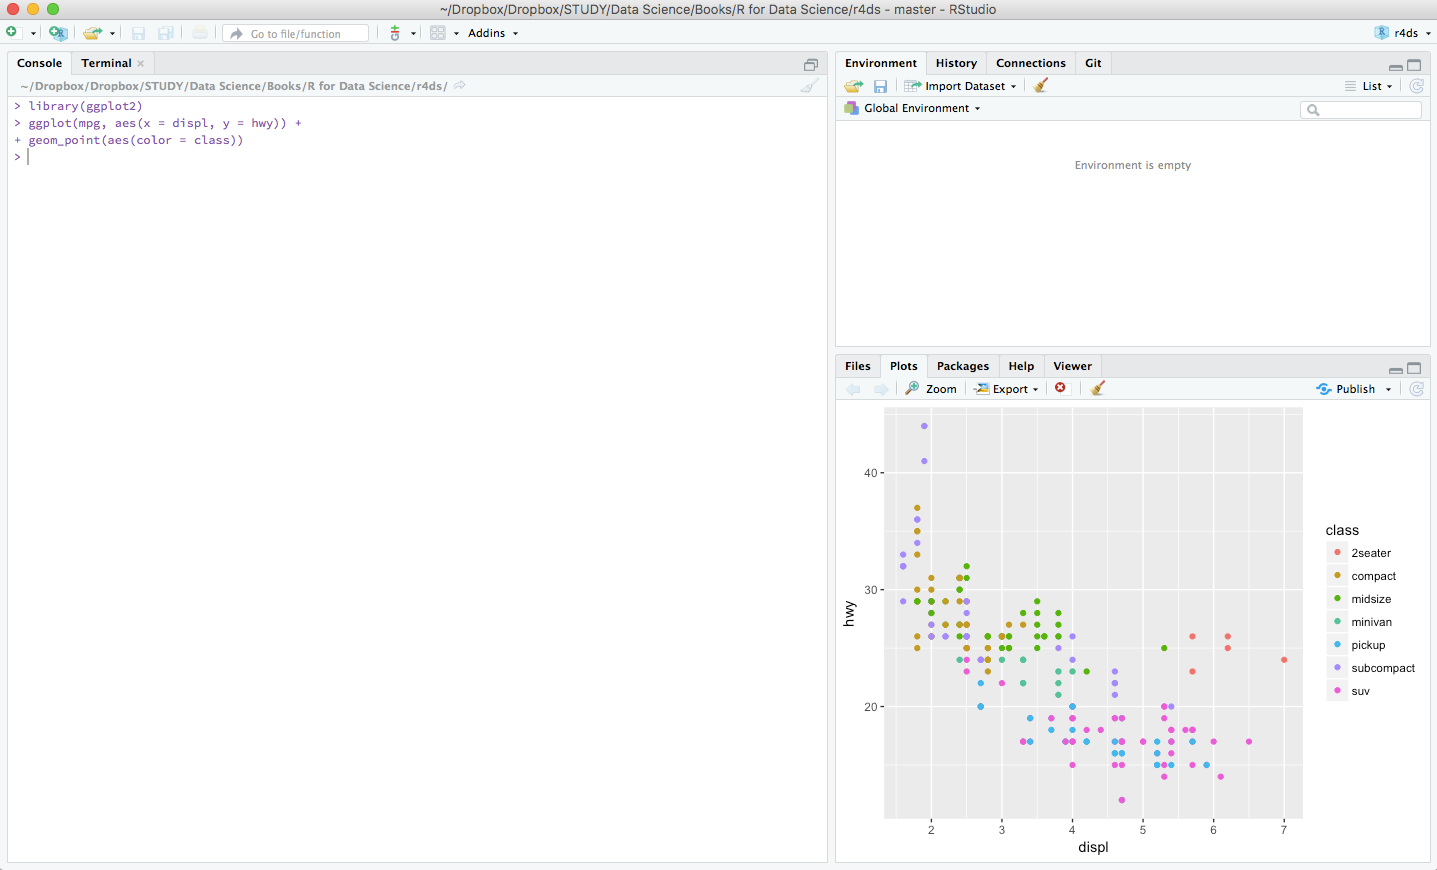
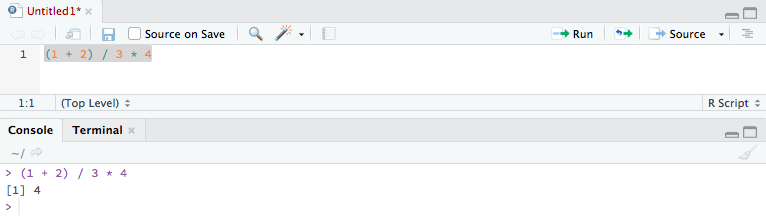
Now you have everything ready. Let’s have a brief overview at RStudio. Fire up RStudio, the interface looks as such:
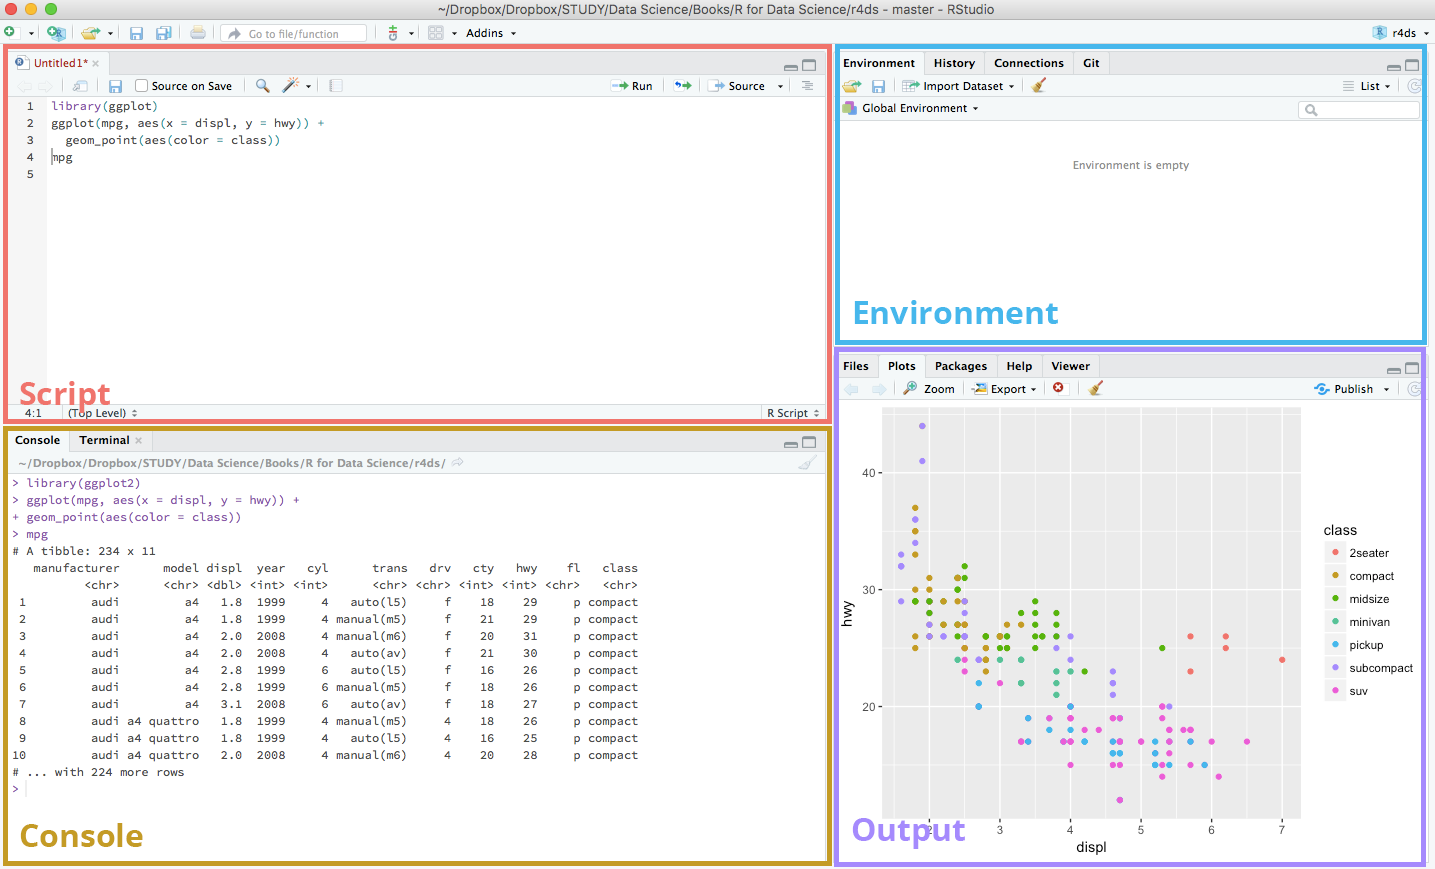
Go to File > New File > R Script to open a new script file. You’ll see a new section appear at the top left side of your interface. A typical RStudio workspace composes of the 4 panels you’re seeing right now:
RStudio interface
Here’s a brief explanation of the use of the 4 panels in the RStudio interface:
Script
This is where your main R script located.
Console
This area shows the output of code you run from script. You can also directly write codes in the console.
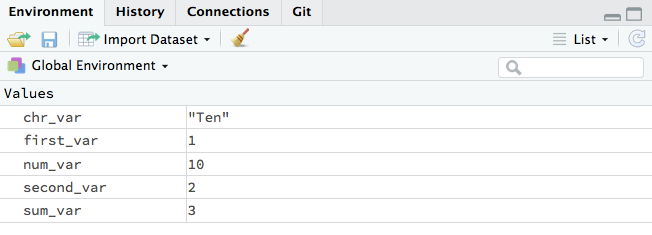
Environment
This space displays the set of external elements added, including dataset, variables, vectors, functions etc.
Output
This space displays the graphs created during exploratory data analysis. You can also seek help with embedded R’s documentation here.
Running R codes
After knowing your IDE, the first thing you want to do is to write some codes.
Using the console panel
You can use the console panel directly to write your codes. Hit Enter and the output of your codes will be returned and displayed immediately after. However, codes entered in the console cannot be traced later. (i.e. you can’t save your codes) This is where the script comes to use. But the console is good for the quick experiment before formatting your codes in the script.
Using the script panel
To write proper R programming codes,
you start with a new script by going to File > New File > R Script, or hit Shift + Ctrl + N. You can then write your codes in the script panel. Select the line(s) to run and press Ctrl + Enter. The output will be shown in the console section beneath. You can also click on little Run button located at the top right corner of this panel. Codes written in script can be saved for later review (File > Save or Ctrl + S).
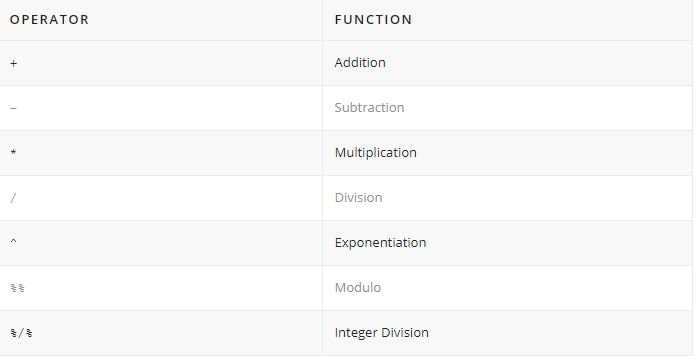
The exponentiation operator ^ raises the number to its left to the power of the number to its right: for example 3 ^ 2 is 9.
# Exponentiation
2 ^ 4
#[1] 16
The modulo operator %% returns the remainder of the division of the number to the left by the number on its right, for example 5 modulo 3 or 5 %% 3 is 2.
# Modulo
5 %% 2
#[1] 1
Lastly, the integer division operator %/% returns the maximum times the number on the left can be divided by the number on its right, the fractional part is discarded, for example, 9 %/% 4 is 2.
# Integer division
5 %/% 2
#[1] 2
You can also add brackets () to change the order of operation. Order of operations is the same as in mathematics (from highest to lowest precedence):
Brackets
Exponentiation
Division
Multiplication
Addition
Subtraction
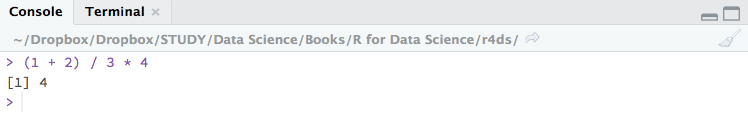
  # Brackets
  (3 + 5) * 2
  #[1] 16
Variable assignment
A basic concept in (statistical) programming is called a variable.
A variable allows you to store a value (e.g. 4) or an object (e.g. a function description) in R. You can then later use this variable’s name to easily access the value or the object that is stored within this variable.
Create new variables
Create a new object with the assignment operator<-. All R statements where you create objects and assignment statements have the same form: object_name <- value.
num_var <- 10

chr_var <- "Ten"
To access the value of the variable, simply type the name of the variable in the console.
  num_var
  #[1] 10

chr_var
#[1] "Ten"
You can access the value of the variable anywhere you call it in the R script, and perform further operations on them.
Not all kinds of names are accepted in R programming. Variable names must start with a letter, and can only contain letters, numbers, . and _. Also, bear in mind that R is case-sensitive, i.e. Cat would not be identical to cat.
Your object names should be descriptive, so you’ll need a convention for multiple words. It is recommended to snake case where you separate lowercase words with _.
If you’ve been programming in other languages before, you’ll notice that the assignment operator in R programming is quite strange. It uses <- instead of the commonly used equal sign = to assign objects.
Indeed, using = will still work in R, but it will cause confusion later. So you should always follow the convention and use <- for assignment.
<- is a pain to type as you’ll have to make lots of assignments. To make life easier, you should remember RStudio’s awesome keyboard shortcut Alt + – (the minus sign) and incorporate it into your regular workflow.
Environments
Look at the environment panel in the upper right corner, you’ll find all of the objects that you’ve created.
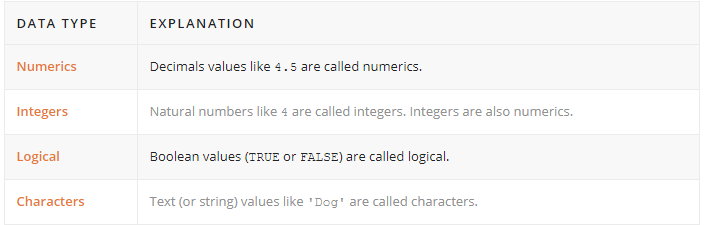
Basic data types
You’ll work with numerous data types in R. Here are some of the most basic ones:
Knowing the data type of an object is important, as different data types work with different functions, and you perform different operations on them. For example, adding a numeric and a character together will throw an error.
To check an object’s data type, you can use the class() function.
# usage class(x)
 # description   Prints the vector of names of classes an object inherits from. # arguments  : An R object.   x
Functions are the fundamental building blocks of R. In programming, a named section of a program that performs a specific task is a function. In this sense, a function is a type of procedure or routine.
R comes with a prewritten set of functions that are kept in a library. (class() as demonstrated in the previous section is a built-in function.) You can use additional functions in other libraries by installing packages.You can also write your own functions to perform specialized tasks.
Here is the typical form of an R function:
function_name(arg1 = val1, arg2 = val2, ...)
function_name is the name of the function. arg1 and arg2 are arguments. They’re variables to be passed into the function. The type and number of arguments depend on the definition of the function. val1 and val2 are values of the arguments correspondingly.
Passing arguments
R can match arguments both by position > and by name. So you don’t necessarily have to supply the names of the arguments if you have the positions of the arguments placed correctly.
Functions are always accompanied with loads of arguments for configurations. However, you don’t have to supply all of the arguments for a function to work.
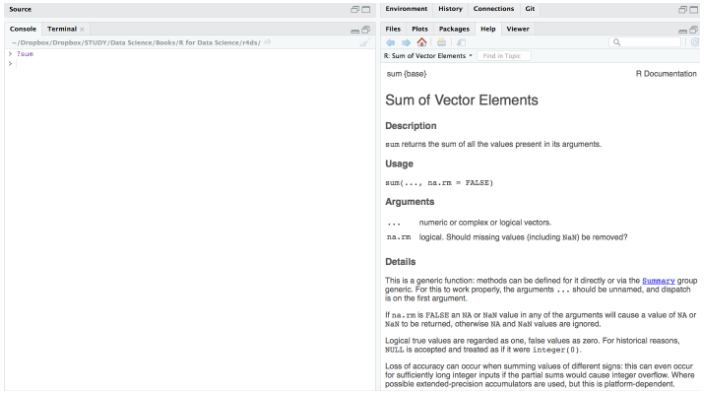
Here is documentation of the sum() function.
# usage
sum(..., na.rm = FALSE)

# description     Returns the sum of all the values present in its arguments. # arguments     ... : Numeric or complex or logical vectors.     na.rm : Logical. Should missing values (including NaN) be removed?
From the documentation, we learned that there are two arguments for the sum() function: ... and na.rm Notice that na.rm contains a default value FALSE. This makes it an optional argument. If you don’t supply any values to the optional arguments, the function will automatically fill in the default value to proceed.
Look how magical it is to show the R documentation directly at the output panel for quick reference.
Last but not least, if you get stuck, Google it! For beginners like us, our confusions must have gone through numerous R learners before and there will always be something helpful and insightful on the web.
Contributors: Cecilia Lee
Cecilia Lee is a junior data scientist based in Hong Kong