fbpx
Learn to build large language model applications: vector databases, langchain, fine tuning and prompt engineering. Learn more

prediction

Data Science Dojo

This blog discusses the applications of AI in healthcare. We will learn about some businesses and startups that are using AI to revolutionize the healthcare industry. This advancement in AI has helped in fighting against Covid19.

Introduction:

COVID-19 was first recognized on December 30, 2019, by BlueDot. It did so nine days before the World Health Organization released its alert for coronavirus. How did BlueDot do it? BlueDot used the power of AI and data science to predict and track infectious diseases. It identified an emerging risk of unusual pneumonia happening around a market in Wuhan.

The role of data science and AI in the Healthcare industry is not limited to that. Now, it has become possible to learn the causes of whatever symptoms you are experiencing, such as cough, fever, and body pain, without visiting a doctor and self-treating it at home. Platforms like Ada Health and Sensely can diagnose the symptoms you report.

The Healthcare industry generates 30% of 1.145 trillion MB of data generated every day. This enormous amount of data is the driving force for revolutionizing the industry and bringing convenience to people’s lives.

Applications of Data Science in Healthcare:

1. Prediction and spread of diseases

Predictive analytics process

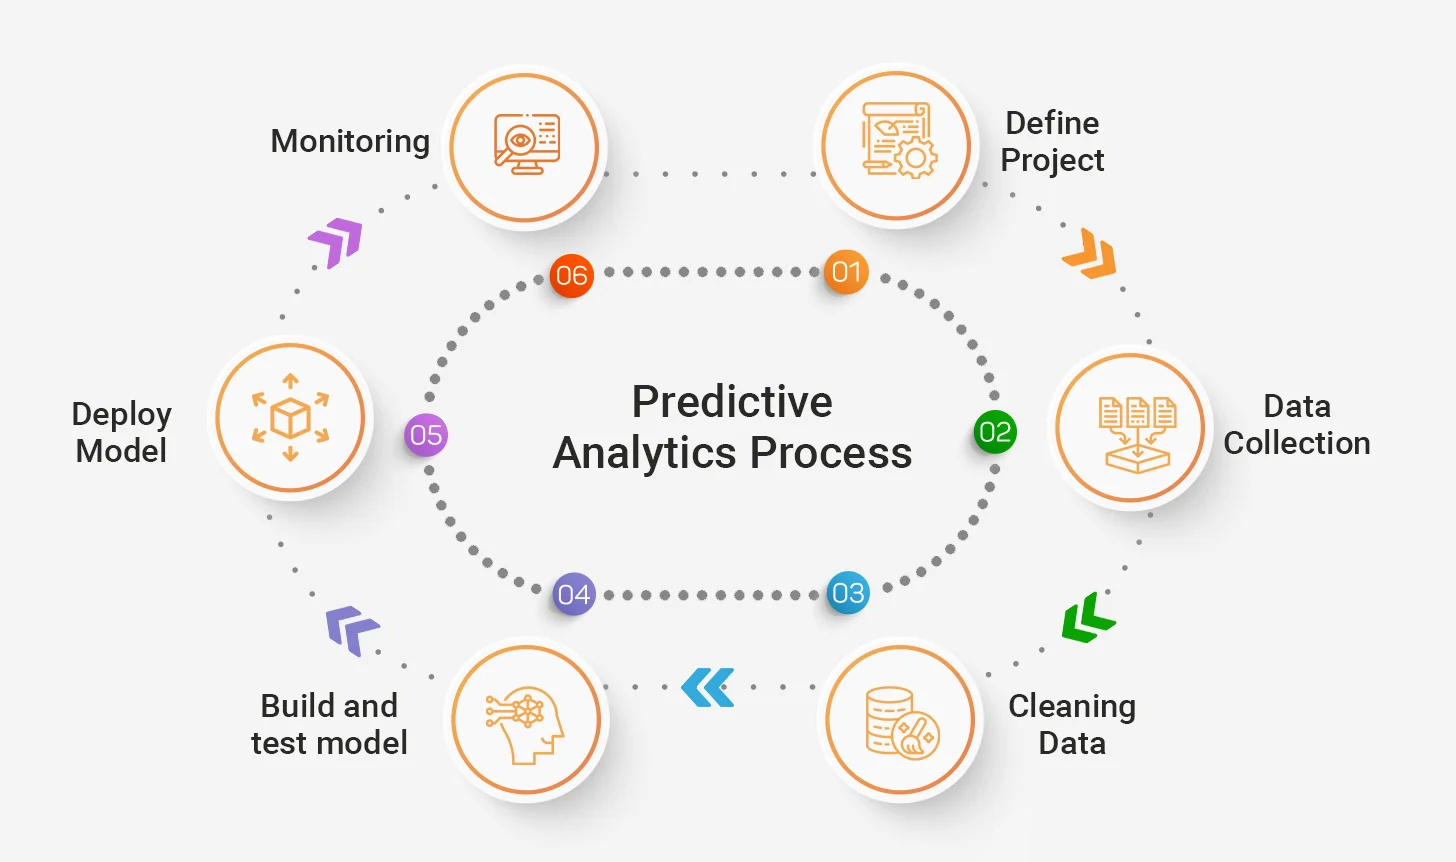
Predictive analysis, using historical data to find patterns and predict future outcomes, can find the correlation between symptoms, patients’ habits, and diseases to derive meaningful predictions from the data. Here are some examples of how predictive analytics plays a role in improving the quality of life and medical condition of the patients:

  • Magic Box, built by the UNICEF office of innovation, uses real-time data from public sources and private sector partners to generate actionable insights. It provides health workers with disease spread predictions and countermeasures. During the early stage of COVID-19, Magic Box correctly predicted which African states were most likely to see imported cases using airline data. This prediction proved beneficial in planning and strategizing quarantine, travel restrictions, and enforcing social distancing.
  • Another use of analytics in healthcare is AIME. It is an AI platform that helps health professionals in tackling mosquito-borne diseases like dengue. AIME uses data like health center notification of dengue, population density, and water accumulation spots to predict outbreaks in advance with an accuracy of 80%. It aids health professionals in Malaysia, Brazil, and the Philippines. The Penang district of Malaysia saw a cost reduction of USD 500,000 by using AIME.
  • BlueDot is an intelligent platform that warns about the spread of infectious diseases. In 2014, it identified the Ebola outbreak risk in West Africa accurately. It also predicted the spread of the Zika virus in Florida six months before the official reports.
  • Sensely uses data from trusted sources like the Mayo Clinic and the NHS to diagnose the disease. The patient enters symptoms through a chatbot used for diagnosis. Sensely launched a series of customized COVID-19 screening and education tools with enterprises around the world, which played a role in supplying trusted advice urgently.

Want to learn more about predictive analytics? Join our Data Science Bootcamp today.

2. Optimizing clinic performance

According to a survey carried out in January 2020, 85 percent of the respondents working in smart hospitals reported being satisfied with their work, compared to 80 percent of the respondents from digital hospitals. Similarly, 74 percent of the respondents from smart hospitals would recommend the medical profession to others, while only 66 percent of the respondents from digital hospitals would recommend it.

Staff retention has been a challenge but is now becoming an enormous challenge, especially post-pandemic. For instance, after six months of the COVID-19 outbreak, almost a quarter of care staff quit their jobs in Flanders & Belgium. The care staff felt exhausted, experienced sleep deprivation, and could not relax properly. A smart healthcare system can solve these issues.

Smart healthcare systems can help optimize operations and provide prompt service to patients. It forecasts the patient load at a particular time and plans resources to improve patient care. It can optimize clinic staff scheduling and supply, which reduces the waiting time and overall experience.

Getting data from partners and other third-party sources can be beneficial too. Data from various sources can help in process management, real-time monitoring, and operational efficiency. It leads to overall clinic performance optimization. We can perform deep analytics of this data to make predictions for the next 24 hours, which helps the staff focus on delivering care.

3. Data science for medical imaging

According to the World Health Organization (WHO), radiology services are not accessible to two-thirds of the world population. Patients must wait for weeks and travel distances for simple ultrasound scans. One of the foremost uses of data science in the healthcare industry is medical imaging. Data Science is now used to inspect images from X-rays, MRIs, and CT scan to find irregularities. Traditionally, radiologists did this task manually, but it was difficult for them to find microscopic deformities. The patient’s treatment depends highly on insights gained from these images.

Data science can help radiologists with image segmentation to identify different anatomical regions. Applying some image processing techniques like noise reduction & removal, edge detection, image recognition, image enhancement, and reconstruction can also help with inspecting images and gaining insights.

One example of a platform that uses data science for medical imaging is Medo. It provides a fully automated platform that enables quick and accurate imaging evaluations. Medo transforms scans taken from different angles into a 3D model. They compare this 3D model against a database of millions of other scans using machine learning to produce a recommended diagnosis in real-time. Platforms like Medo make radiology services more accessible to the population worldwide.

4. Drug discovery with data science

Traditionally, it took decades to discover a new drug, but the time has now been reduced to less than a year using data science. Drug discovery is a complex task. Pharmaceutical industries rely heavily on data science to develop better drugs. Researchers need to identify the causative agent and understand its characteristics, which may require millions of test cases to understand. This is a huge problem for pharmaceutical companies because it can take decades to perform these tests. Data science has solved this problem and can perform this task in a month or even a few weeks.

For example, the causative agent for COVID-19 is the SARS-CoV-2 virus. For discovering an effective drug for COVID-19, deep learning is used to identify and design a molecule that binds to SARS-CoV-2 to inhibit its function by using extracted data from scientific literature through NLP (Natural Language Processing).

5. Monitoring patients’ health

The human body generates two terabytes of data daily. Humans are trying to collect most of this data using smart home devices and wearables. The data these devices collect includes heart rate, blood sugar, and even brain activity. Data can revolutionize the healthcare industry if known how to use it.

Every 36 seconds, a person dies from cardiovascular disease in the United States. Data science can identify common conditions and predict disorders by identifying the slightest change in health indicators. A timely alert of changes in health indicators can save thousands of lives. Personal health coaches are designed to help to gain deep insights into the patient’s health and alert if the health indicator reaches a dangerous level.

Companies like Corti can detect cardiac arrest in 48 seconds through phone calls. This solution uses real-time natural language processing to listen to emergency calls and look out for several verbal and non-verbal patterns of communication. It is trained on a dataset of emergency calls and acts as a personal assistant of the call responder. It helps the responder ask relevant questions, provide insights, and predict if the caller is suffering from cardiac arrest. Corti finds cardiac arrest more accurately and faster than humans.

6. Virtual assistants in healthcare

The WHO estimated that by 2030, the world will need an extra 18 million health workers worldwide. Using virtual assistant platforms can fulfill this need. According to a survey by Nuance, 92% of clinicians believe virtual assistant capabilities would reduce the burden on the care team and patient experience.

Patients can enter their symptoms as input to the platform and ask questions. The platform would tell you about your medical condition using the data of symptoms and causes. It is possible because of the predictive modeling of disease. These platforms can also assist patients in many other ways, like reminding them to take medication on time.

An example of such a platform is Ada Health, an AI-enabled symptom checker. A person enters symptoms through a chatbot, and Ada uses all available data from patients, past medical history, EHR implementation, and other sources to predict a potential health issue. Over 11 million people (about twice the population of Arizona) use this platform.

Other examples of health chatbots are Babylon Health, Sensely, and Florence.

Conclusion:

In this blog, we discussed the applications of AI in healthcare. We learned about some businesses and startups that are using AI to revolutionize the healthcare industry. This advancement in AI has helped in fighting against Covid19. To learn more about data science enroll in our Data Science Bootcamp, a remote instructor-led Bootcamp where you will learn data science through a series of lectures and hands-on exercises. Next, we will be creating a prognosis prediction system in python. You can follow along with my next blog post here.

Want to create data science applications with python? checkout our Python for Data Science training. 

Data Science Dojo

Recommender systems are one of the most popular algorithms in data science today. Learn how to build a simple movie recommender system.

Recommender systems possess immense capability in various sectors ranging from entertainment to e-commerce. Recommender Systems have proven to be instrumental in pushing up company revenues and customer satisfaction with their implementation. Therefore, machine learning enthusiasts need to get a grasp on it and get familiar with related concepts.

As the amount of available information increases, new problems arise as people are finding it hard to select the items they actually want to see or use. This is where the recommender system comes in. They help us make decisions by learning our preferences or by learning the preferences of similar users.

They are used by almost every major company in some form or the other. Netflix uses it to suggest movies to customers, YouTube uses it to decide which video to play next on autoplay, and Facebook uses it to recommend pages to like and people to follow.

This way recommender systems have helped organizations retain customers by providing tailored suggestions specific to the customer’s needs. According to a study by McKinsey, 35 percent of what consumers purchase on Amazon and 75 percent of what they watch on Netflix come from product recommendations based on such algorithms.

Netflix - Product recommender systems
Audiences watch Netflix and YouTube on recommendations – Recommender systems

Recommender systems can be classified under 2 major categories: Collaborative Systems and Conent-Based Systems.

Collaborative systems

Collaborative systems provide suggestions based on what other similar users liked in the past. By recording the preferences of users, a collaborative system would cluster similar users and provide recommendations based on the activity of users within the same group.

Content-based systems

Content-based systems provide recommendations based on what the user liked in the past. This can be in the form of movie ratings, likes, and clicks. All the recorded activity allows these algorithms to provide suggestions on products if they possess similar features to the products liked by the user in the past.

Content based system
 Content-based systems provide recommendations based on user’s liked content in the past
A hands-on practice, in R, on recommender systems will boost your skills in data science to a great extent. We’ll first practice using the MovieLens 100K Dataset which contains 100,000 movie ratings from around 1000 users on 1700 movies. This exercise will allow you to recommend movies to a particular user based on the movies the user has already rated. We’ll be using the recommender lab package which contains several popular recommendation algorithms.

After completing the first exercise, you’ll have to use the recommenderlab to recommend music to the customers. We use the last.fm dataset that has 92,800 artist listening records from 1892 users. We are going to recommend artists to a user that the user is highly likely to listen.

Install and import required libraries

library(recommenderlab)
library(reshape2)

Import data

The recommenderlab frees us from the hassle of importing the MovieLens 100K dataset. It provides a simple function below that fetches the MovieLens dataset for us in a format that will be compatible with the recommender model. The format of MovieLense is an object of the class “realRatingMatrix” which is a special type of matrix containing ratings. The data will be in the form of a sparse matrix with the movie names in the columns and User IDs in the rows. The interaction of a User ID and a particular movie will provide us with the rating given by that particular user on a scale of 1-5.

As you will see in the output after running the code below, the MovieLense matrix will consist of 943 users (rows) and 1664 movies (columns) with overall 99392 ratings given.

data("MovieLense")
MovieLense
Rating matrix

Data summary

By running the code below, we will visualize a small part of the dataset for our understanding. The code will only display the first 10 rows and 10 columns of our dataset. You can notice that the scores given by the users are integers ranging from 1-5. You’ll also note that most of the values are missing (marked as ‘NA’) indicating that the user hasn’t watched or rated that movie.

ml10 <- MovieLense[c(1:10),]
ml10 <- ml10[,c(1:10)]
as(ml10, "matrix")
MovieLense data matrix
MovieLense data matrix of 100 rows and 100 columns

With the code below, we’ll visualize the MovieLens data matrix of the first 100 rows and 100 columns in the form of a heatmap. Run this code to visualize the movie ratings with respect to a combination of respective rows and columns.

image(MovieLense[1:100,1:100])
heatmap
Visualize movie ratings in the form of a heatmap

Train

We will now train our model using recommenderlab‘s Recommender function is below. The function learns a recommender model from the given data. In this case, our data is the MovieLens data. In the parameters, we are going to specify one of the several algorithms offered by recommenderlab for learning. Here we’ll choose UBCF – User-based Collaborative-Filtering. Collaborative filtering uses given rating data by many users for many items as the basis for predicting missing ratings and/or for creating a top-N recommendation list for a given user, called the active user.

train <- MovieLense
our_model <- Recommender(train, method = "UBCF")
our_model #storing our model in our_model variable

Collaborative filtering

Predict

We will now move ahead and create predictions. From our interaction matrix which is in our dataset MovieLens, we will predict the score for the movies the user hasn’t rated using our recommender model and list the top-scoring movies that our model scored. We will use recommenderlab’s predict function that creates recommendations using a recommender model, our_model in this case, and data about new users.

We will be predicting for a specified user. Below, we have specified a user with ID 115. We have also set n = 10 as our parameter to limit the response to the top 10 ratings given by our model. These will be the movies our model will recommend to the specified user based on his previous ratings.

User = 115
pre <- predict(our_model, MovieLense[User], n = 10)
pre

predicting model to specified user- recommending

List already liked

In the code below we will list the movies the user has already rated and display the score he gave.

user_ratings <- train[User]
as(user_ratings, "list")
List of movies user liked - for recommender system
Movies list rated by users

View result

In the code below, we will display the predictions created in our pre-variable. We will display it in the form of a list.

as(pre,"list")

predictions of pre variable

Conclusion

Using the recommenderlab library we just created a movie recommender system based on the collaborative filtering algorithm. We have successfully recommended 10 movies that the user is likely to prefer. The recommenderlab library could be used to create recommendations using other datasets apart from the MovieLens dataset. The purpose of the exercise above was to provide you with a glimpse of how these models function.

Practice with lastFM dataset

For more practice with recommender systems, we will now recommend artists to our users. We will use the LastFM dataset. This dataset contains social networking, tagging, and music artist listening information from a set of 2K users from Last.fm online music system. It contains almost 92,800 artist listening records from 1892 users.

We will again use the recommenderlab library to create our recommendation model. Since this dataset cannot be fetched using any recommenderlab function as we did for the MovieLens dataset, we will manually fetch the dataset and practice converting it to the realRatingMatrix which is the format that our model will input for modeling.

Below we’ll import 2 files, the user_artists.dat file and artists.dat into the user_artist_data and artist_data variables respectively. The user_artists.dat file is a tab-separated file that contains the artists listened to by each user. It also provides a listening count for each [user, artist] pair marked as attribute weight. The artists.dat file contains information about music artists listened to and tagged by the users. It is a tab-separated file that contains the artist ID, its name, URL, and picture URL.

Let’s import our dataset below:

user_artist_data <- read.csv(file = PATH + "user_artists.dat", header = TRUE, sep="\t")
artist_data <- read.csv(file = PATH + "artists.dat", header = TRUE, sep="\t")

Following the steps we did with our Movie Recommender system, we’ll view the first few rows of our dataset by using the head method.

head(user_artist_data)
Head method
Movie recommender system – head method
We’ll use the head method to view the first 10 rows of the artist dataset below. Think about which columns will be useful for our purpose as we’ll be using a collaborative filtering method for designing our model.
head(artist_data)

head method of 10 rows of artists below

In the code below, we will use the acast method to convert our user_artist dataset into an interaction matrix. This will be later converted to a matrix and then to realRatingMatrix. The realRatingMatrix is the format that will be taken by recommenderlab‘s Recommender function. It is a matrix containing ratings, typically 1-5 stars, etc. We will store in it our rrm_data variable. After running the code, you’ll notice that the output provides us with the dimensions and class of our variable rrm_data.

m_data <- acast(user_artist_data, userID~artistID)
m_data <- as.matrix(m_data)
rrm_data <- as(m_data,"realRatingMatrix")
rrm_data

acast method

Let’s visualize the user_artist data matrix of the first 100 rows and 100 columns in the form of a heatmap. Write a single line code with rrm_data variable to visualize the movie ratings with respect to a combination of respective rows and columns using the image function.

Hint: image(rrm_data[1:100,1:100])
heatmap
Visualize the movie ratings with respect to a combination of respective rows and columns

Using a similar procedure as we used to build our model for the movie recommender system, write a code that builds our Recommender method of the recommenderlab library using the “UBCF” algorithm. Store the model in a variable named artist_model.

We’ll use the predict function to create a prediction for UserID 114 and store the prediction in the variable artist_pre. Also, note that we need the top 12 predictions for listed. The function below will list our prediction using the as method.

train <- rrm_data
artist_model <- Recommender(train, method = "UBCF")
User = 114
artist_pre <- predict(artist_model, rrm_data[User], n = 10)
artist_pre

Recommendations of 1 user

as(artist_pre,"list")

UserID 114

To work with more interesting datasets for recommender systems using recommenderlab or any other relevant library, refer to the article 9 Must-Have Datasets for Investigating Recommender Systems published on kdnuggets.com.


Want to dive deeper into recommender systems? Check out Data Science Dojo’s online data science certificate program.

Related Topics

Statistics
Resources
Programming
Machine Learning
LLM
Generative AI
Data Visualization
Data Security
Data Science
Data Engineering
Data Analytics
Computer Vision
Career
Artificial Intelligence