
Recommender systems are one of the most popular algorithms in data science today. Learn how to build a simple movie recommender system.
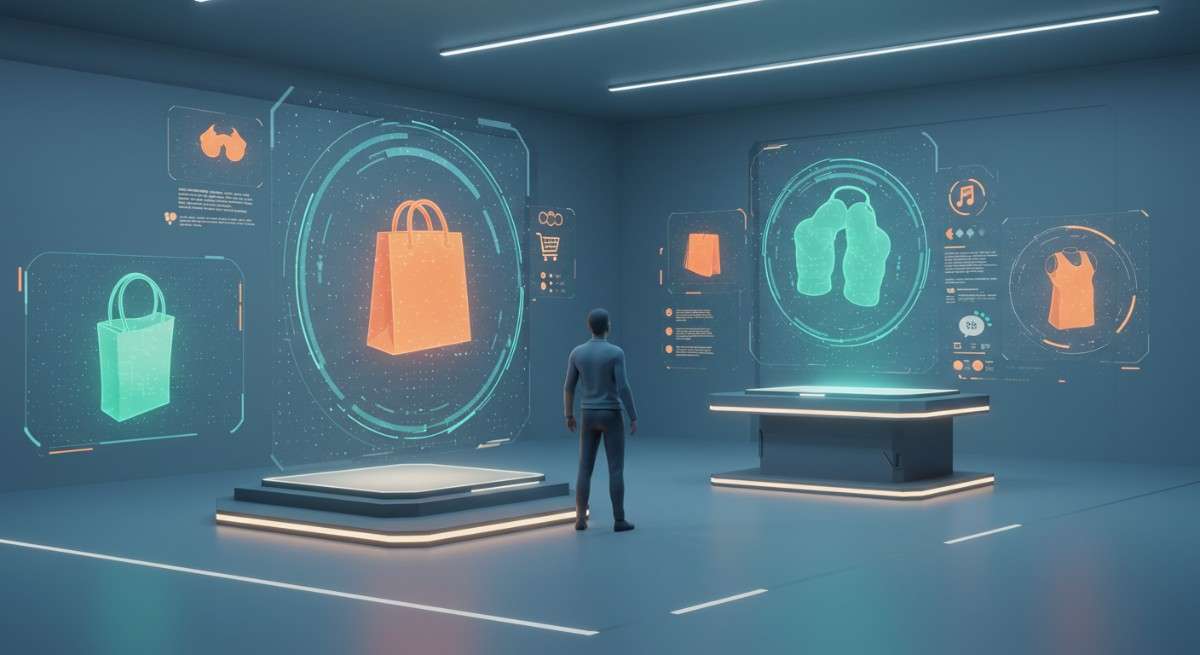
Recommender systems possess immense capability in various sectors ranging from entertainment to e-commerce. Recommender Systems have proven to be instrumental in pushing up company revenues and customer satisfaction with their implementation. Therefore, machine learning enthusiasts need to get a grasp on it and get familiar with related concepts.
As the amount of available information increases, new problems arise as people are finding it hard to select the items they actually want to see or use. This is where the recommender system comes in. They help us make decisions by learning our preferences or by learning the preferences of similar users.
They are used by almost every major company in some form or the other. Netflix uses it to suggest movies to customers, YouTube uses it to decide which video to play next on autoplay, and Facebook uses it to recommend pages to like and people to follow.
This way recommender systems have helped organizations retain customers by providing tailored suggestions specific to the customer’s needs. According to a study by McKinsey, 35 percent of what consumers purchase on Amazon and 75 percent of what they watch on Netflix come from product recommendations based on such algorithms.

Recommender systems can be classified under 2 major categories: Collaborative Systems and Conent-Based Systems.
Collaborative systems
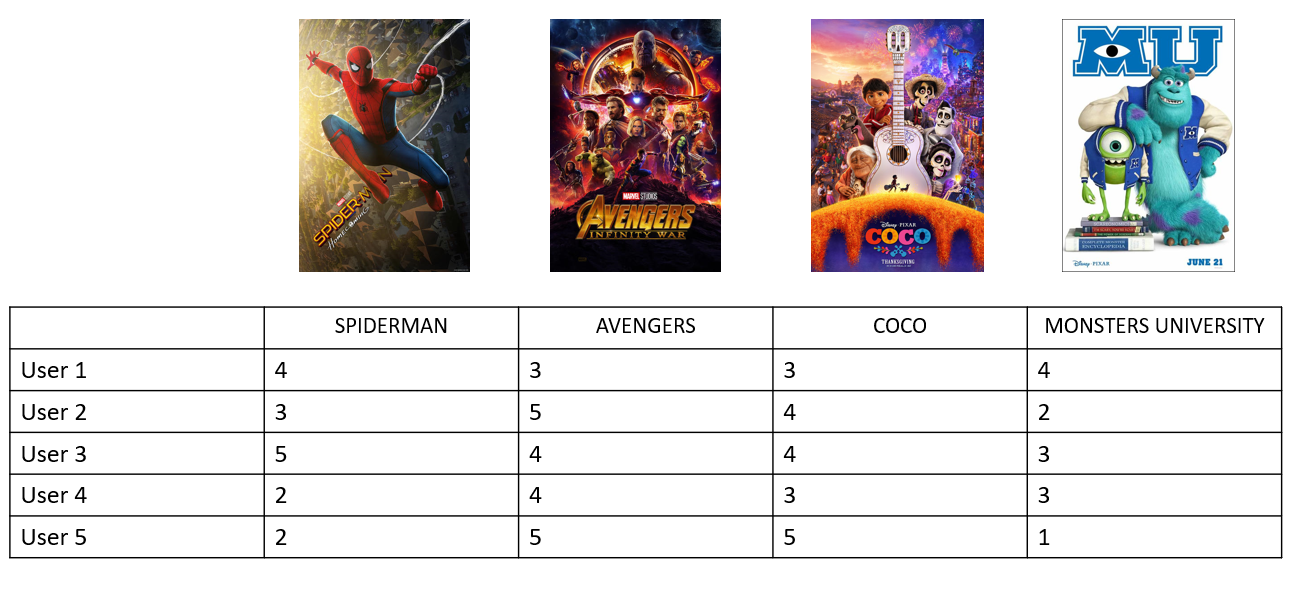
Collaborative systems provide suggestions based on what other similar users liked in the past. By recording the preferences of users, a collaborative system would cluster similar users and provide recommendations based on the activity of users within the same group.
Content-based systems
Content-based systems provide recommendations based on what the user liked in the past. This can be in the form of movie ratings, likes, and clicks. All the recorded activity allows these algorithms to provide suggestions on products if they possess similar features to the products liked by the user in the past.
After completing the first exercise, you’ll have to use the recommenderlab to recommend music to the customers. We use the last.fm dataset that has 92,800 artist listening records from 1892 users. We are going to recommend artists to a user that the user is highly likely to listen.
Install and import required libraries
library(recommenderlab)
library(reshape2)
Import data
The recommenderlab frees us from the hassle of importing the MovieLens 100K dataset. It provides a simple function below that fetches the MovieLens dataset for us in a format that will be compatible with the recommender model. The format of MovieLense is an object of the class “realRatingMatrix” which is a special type of matrix containing ratings. The data will be in the form of a sparse matrix with the movie names in the columns and User IDs in the rows. The interaction of a User ID and a particular movie will provide us with the rating given by that particular user on a scale of 1-5.
As you will see in the output after running the code below, the MovieLense matrix will consist of 943 users (rows) and 1664 movies (columns) with overall 99392 ratings given.
data("MovieLense")
MovieLense

Data summary
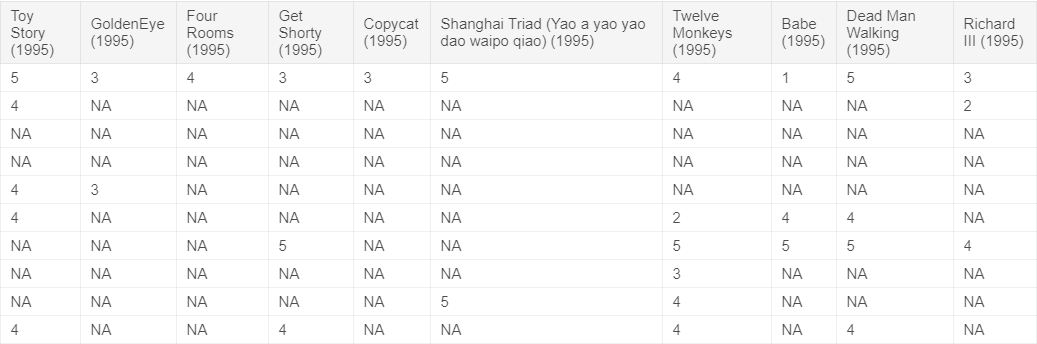
By running the code below, we will visualize a small part of the dataset for our understanding. The code will only display the first 10 rows and 10 columns of our dataset. You can notice that the scores given by the users are integers ranging from 1-5. You’ll also note that most of the values are missing (marked as ‘NA’) indicating that the user hasn’t watched or rated that movie.
ml10 <- MovieLense[c(1:10),]
ml10 <- ml10[,c(1:10)]
as(ml10, "matrix")
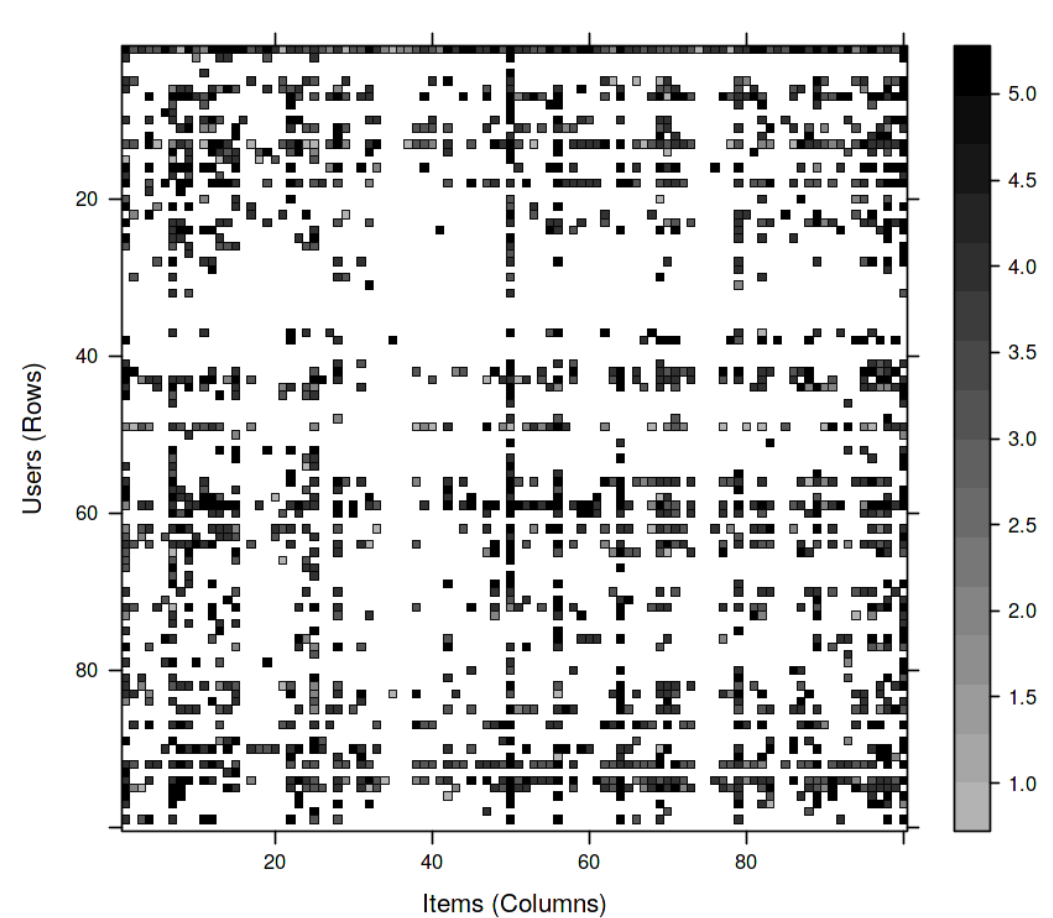
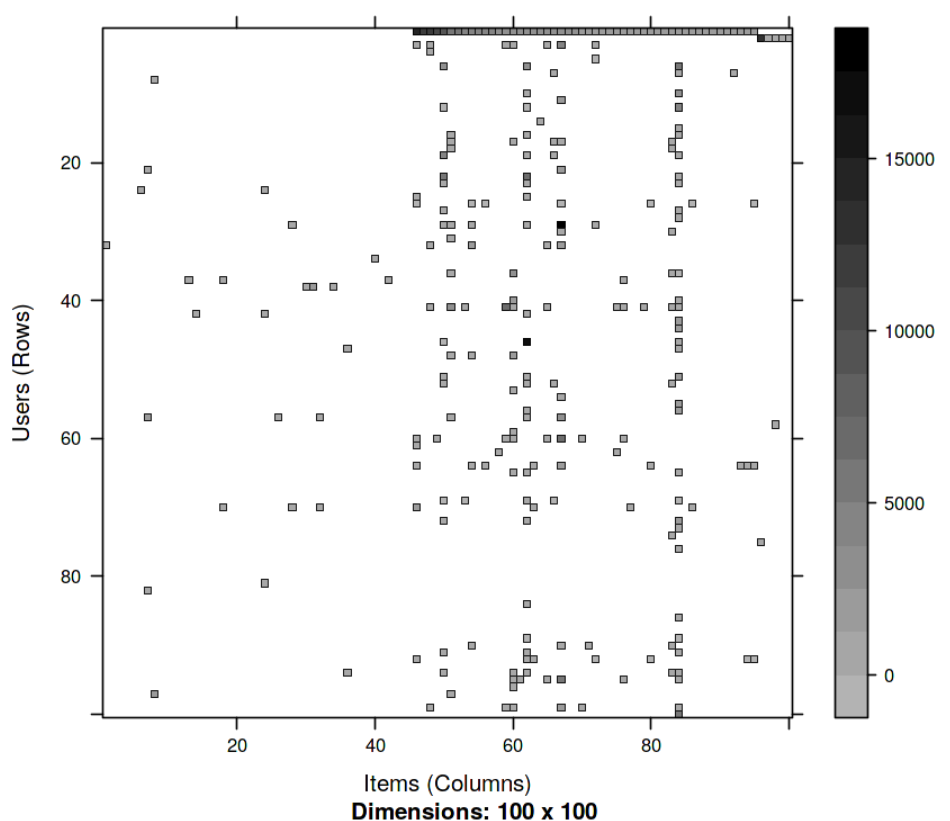
With the code below, we’ll visualize the MovieLens data matrix of the first 100 rows and 100 columns in the form of a heatmap. Run this code to visualize the movie ratings with respect to a combination of respective rows and columns.
image(MovieLense[1:100,1:100])
Train
We will now train our model using recommenderlab‘s Recommender function is below. The function learns a recommender model from the given data. In this case, our data is the MovieLens data. In the parameters, we are going to specify one of the several algorithms offered by recommenderlab for learning. Here we’ll choose UBCF – User-based Collaborative-Filtering. Collaborative filtering uses given rating data by many users for many items as the basis for predicting missing ratings and/or for creating a top-N recommendation list for a given user, called the active user.
train <- MovieLense
our_model <- Recommender(train, method = "UBCF")
our_model #storing our model in our_model variable

Predict
We will now move ahead and create predictions. From our interaction matrix which is in our dataset MovieLens, we will predict the score for the movies the user hasn’t rated using our recommender model and list the top-scoring movies that our model scored. We will use recommenderlab’s predict function that creates recommendations using a recommender model, our_model in this case, and data about new users.
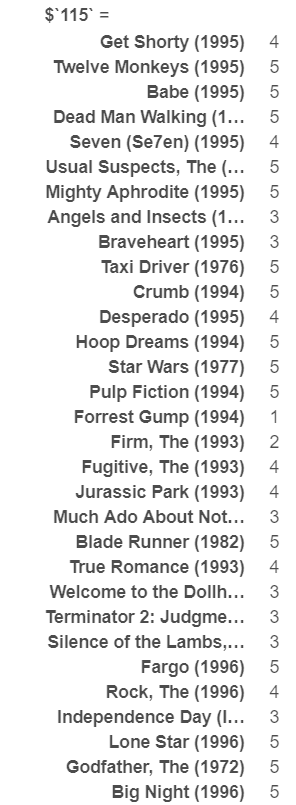
We will be predicting for a specified user. Below, we have specified a user with ID 115. We have also set n = 10 as our parameter to limit the response to the top 10 ratings given by our model. These will be the movies our model will recommend to the specified user based on his previous ratings.
User = 115
pre <- predict(our_model, MovieLense[User], n = 10)
pre

List already liked
In the code below we will list the movies the user has already rated and display the score he gave.
user_ratings <- train[User]
as(user_ratings, "list")
View result
In the code below, we will display the predictions created in our pre-variable. We will display it in the form of a list.
as(pre,"list")
![]()
Conclusion
Using the recommenderlab library we just created a movie recommender system based on the collaborative filtering algorithm. We have successfully recommended 10 movies that the user is likely to prefer. The recommenderlab library could be used to create recommendations using other datasets apart from the MovieLens dataset. The purpose of the exercise above was to provide you with a glimpse of how these models function.
Practice with lastFM dataset
For more practice with recommender systems, we will now recommend artists to our users. We will use the LastFM dataset. This dataset contains social networking, tagging, and music artist listening information from a set of 2K users from Last.fm online music system. It contains almost 92,800 artist listening records from 1892 users.
We will again use the recommenderlab library to create our recommendation model. Since this dataset cannot be fetched using any recommenderlab function as we did for the MovieLens dataset, we will manually fetch the dataset and practice converting it to the realRatingMatrix which is the format that our model will input for modeling.
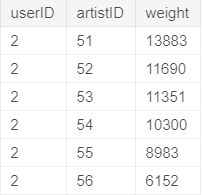
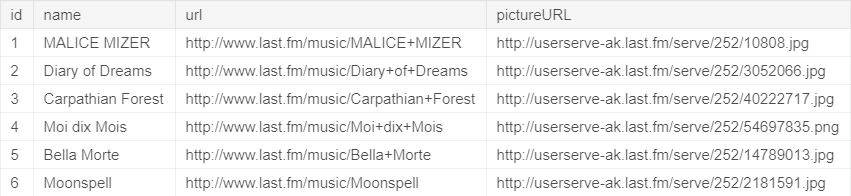
Below we’ll import 2 files, the user_artists.dat file and artists.dat into the user_artist_data and artist_data variables respectively. The user_artists.dat file is a tab-separated file that contains the artists listened to by each user. It also provides a listening count for each [user, artist] pair marked as attribute weight. The artists.dat file contains information about music artists listened to and tagged by the users. It is a tab-separated file that contains the artist ID, its name, URL, and picture URL.
Let’s import our dataset below:
user_artist_data <- read.csv(file = PATH + "user_artists.dat", header = TRUE, sep="\t")
artist_data <- read.csv(file = PATH + "artists.dat", header = TRUE, sep="\t")
Following the steps we did with our Movie Recommender system, we’ll view the first few rows of our dataset by using the head method.
head(user_artist_data)
head(artist_data)
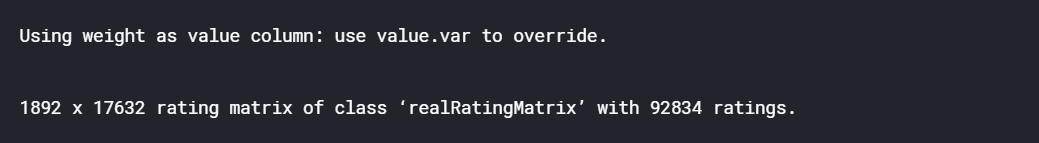
In the code below, we will use the acast method to convert our user_artist dataset into an interaction matrix. This will be later converted to a matrix and then to realRatingMatrix. The realRatingMatrix is the format that will be taken by recommenderlab‘s Recommender function. It is a matrix containing ratings, typically 1-5 stars, etc. We will store in it our rrm_data variable. After running the code, you’ll notice that the output provides us with the dimensions and class of our variable rrm_data.
m_data <- acast(user_artist_data, userID~artistID)
m_data <- as.matrix(m_data)
rrm_data <- as(m_data,"realRatingMatrix")
rrm_data
Let’s visualize the user_artist data matrix of the first 100 rows and 100 columns in the form of a heatmap. Write a single line code with rrm_data variable to visualize the movie ratings with respect to a combination of respective rows and columns using the image function.
Hint: image(rrm_data[1:100,1:100])
Using a similar procedure as we used to build our model for the movie recommender system, write a code that builds our Recommender method of the recommenderlab library using the “UBCF” algorithm. Store the model in a variable named artist_model.
We’ll use the predict function to create a prediction for UserID 114 and store the prediction in the variable artist_pre. Also, note that we need the top 12 predictions for listed. The function below will list our prediction using the as method.
train <- rrm_data
artist_model <- Recommender(train, method = "UBCF")
User = 114
artist_pre <- predict(artist_model, rrm_data[User], n = 10)
artist_pre

as(artist_pre,"list")To work with more interesting datasets for recommender systems using recommenderlab or any other relevant library, refer to the article 9 Must-Have Datasets for Investigating Recommender Systems published on kdnuggets.com.
Want to dive deeper into recommender systems? Check out Data Science Dojo’s online data science certificate program.