
In this blog, we are going to learn the differences and similarities between linear regression and logistic regression.
Regression is a statistical technique used in the fields of finance, investing, and other disciplines that aim to establish the nature and strength of the relationship between a single dependent variable (often represented by Y) and a number of independent variables (known as independent variables).
Forecasting and prediction both require regression analysis. There is a lot of overlap between this and machine learning. This statistical approach is employed in a variety of industries, including
Financial: Understanding stock price trends, making price predictions, and assessing insurance risk.
Marketing: Analyze the success of marketing initiatives and project product pricing and sales.
Manufacturing: Assess the relationships between the variables that define a better engine and its performance.
Medicine: To produce generic medications for ailments, forecast the various medication combinations.
The most popular variation of this method is linear regression, which is also known as simple regression or ordinary least squares (OLS). Based on a line of best fit, linear regression determines the linear relationship between two variables.
The slope of a straight line used to represent linear regression thus indicates how changing one variable effect changing another. In a linear regression connection, the value of one variable when the value of the other is zero is represented by the y-intercept. There are also non-linear regression models, although they are far more complicated.
Terminologies used in regression analysis
Outliers
The term “outlier” refers to an observation in a dataset that has an extremely high or very low value in comparison to the other observations, i.e., it does not belong to the population.
Multicollinearity
The independent variables are said to be multicollinear when there is a strong correlation between them.
Heteroscedasticity
Heteroscedasticity refers to the non-constant fluctuation between the target variable and the independent variable.
Both under- and over-fit
Overfitting may result from the usage of extraneous explanatory variables. Overfitting occurs when our algorithm performs admirably on the training set but falls short on the test sets.
Linear regression
In simple terms, linear regression is used to find a relationship between two variables: a Dependent variable (y) and an independent variable (X) with the help of a straight line. It also makes predictions for continuous or numeric variables such as sales, salary, age, and product price and shows us how the value of the dependent variable changes with the change in the value of an independent variable.
Watch more videos on machine learning at Data Science Dojo
Let’s say we have a dataset available consisting of house areas in square meters and their respective prices.
As the change in area results in a change in price change of a house, we will put the area on the X-axis as an independent variable and the Price on the Y-axis as a dependent variable.
On the chart, these data points would appear as a scatter plot, a set of points that may or may not appear to be organized along any line.
Now using this data, we are required to predict the price of houses having the following areas: 500, 2000, and 3500.
After plotting these points, if a linear pattern is visible, sketch a straight line as the line of best fit.
The best-fit line we draw minimizes the distance between it and the observed data. Estimating this line is a key component of regression analysis that helps to infer the relationships between a dependent variable and an independent variable.
Measures for linear regression
To understand the amount of error that exists between different models in linear regression, we use metrics. Let’s discuss some of the evaluation measures for regression:
-
Mean Absolute Error
Mean absolute error measures the absolute difference between the predicted and actual values of the model. This metric is the average prediction error. Lower MAE values indicate a better fit.
-
Root Mean Squared Error
Root Mean Squared Error indicates how different the residuals are from zero. Residuals represent the difference between the observed and predicted value of the dependent variable.
-
R-Squared Measure
R squared Measure is the standard deviation of the residuals. The plot of the residuals shows the distance of the data points from the regression line. The root mean squared error squares the residuals, averages the residuals, and takes the square root. RMSE measures the difference between the actual target from the predicted values.
Lower RMSE values indicate shorter distances from the actual data point to the line and therefore a better fit. RMSE uses the same units as the dependent value.
Logistic regression
Additionally, logistic models can modify raw data streams to produce characteristics for various AI and machine learning methods. In reality, one of the often employed machine learning techniques for binary classification issues, or problems with two class values, includes logistic regression. These problems include predictions like “this or that,” “yes or no,” and “A or B.”
Read about logistic regression in R in this blog
The probability of occurrences can also be estimated using logistic regression, which includes establishing a link between feature likelihood and outcome likelihood. In other words, it can be applied to categorization by building a model that links the number of hours of study to the likelihood that a student would pass or fail.
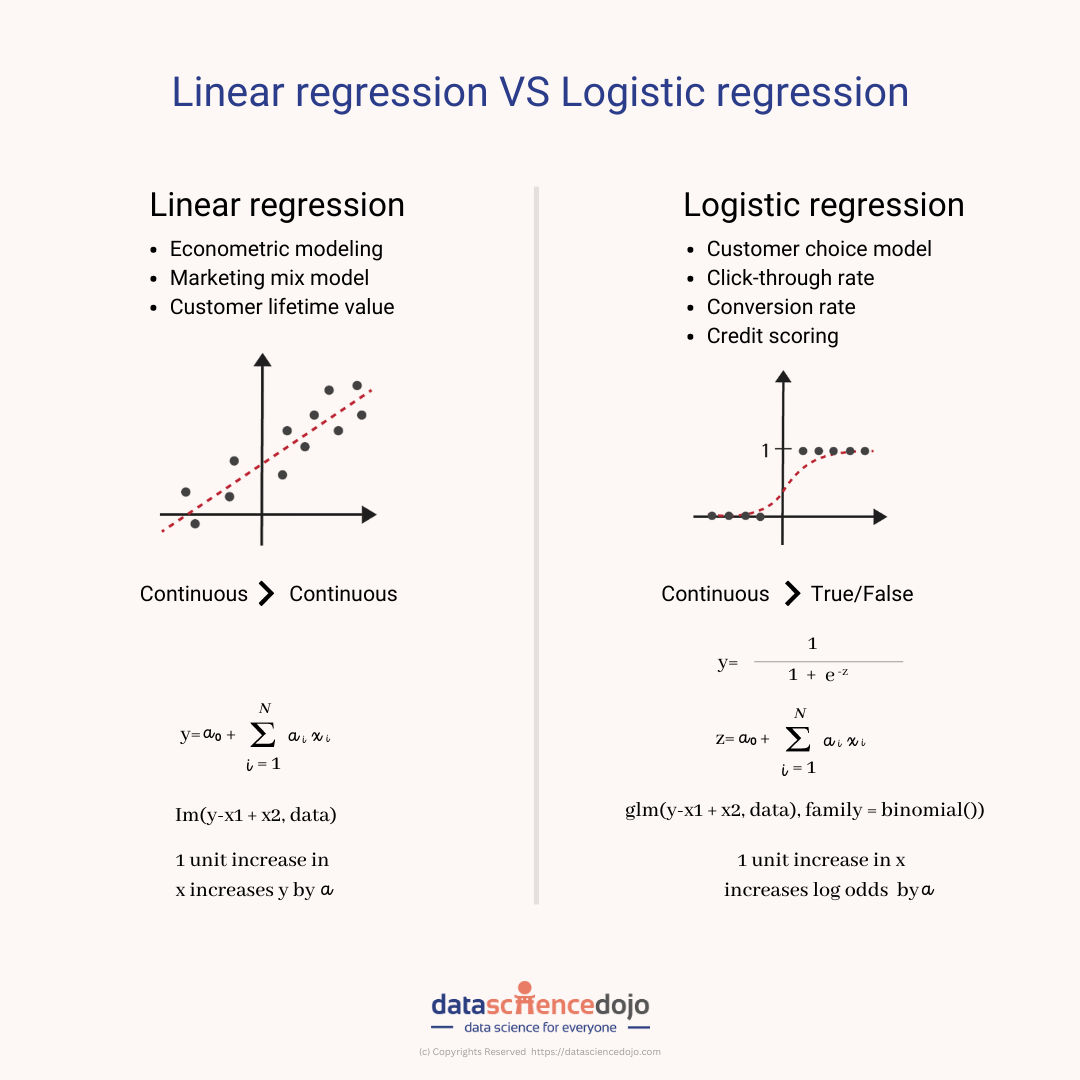
Comparison of linear regression and logistic regression
The primary distinction between logistic and linear regression is that the output of logistic regression is constant whereas the output of linear regression is continuousutilized.
The outcome, or dependent variable, in logistic regression, has just two possible values. However, the output of a linear regression is continuous, which means that there are an endless number of possible values for it.
When the response variable is categorical, such as yes/no, true/false, and pass/fail, logistic regression is utilized. When the response variable is continuous, like hours, height, or weight, linear regression is utilized.
Logistic regression and linear regression, for instance, can predict various outcomes depending on the information about the amount of time a student spends studying and the results of their exams.
Curve, a visual representation of linear and logistic regression
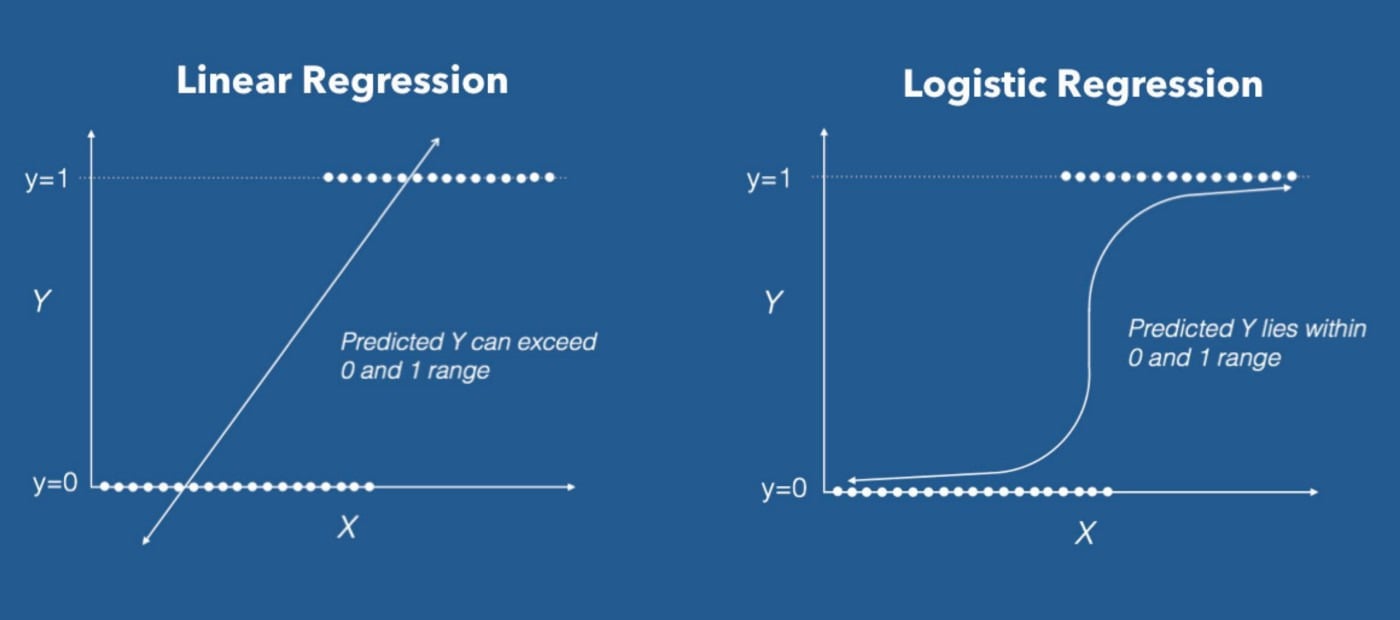
A straight line, often known as a regression line, is used to indicate linear regression. This line displays the expected score on “y” for each value of “x.” Additionally, the distance between the data points on the plot and the regression line reveals model flaws.
In contrast, an S-shaped curve is revealed using logistic regression. Here, the orientation and steepness of the curve are affected by changes in the regression coefficients. So, it follows that a positive slope yields an S-shaped curve, but a negative slope yields a Z-shaped curve.
Which one to use – Linear regression or logistic regression?
Regression analysis requires careful attention to the problem statement, which must be understood before proceeding. It seems sensible to apply linear regression if the problem description mentions forecasts. If binary classification is included in the issue statement, logistic regression should be used. Similarly, we must assess each of our regression models in light of the problem statement.
Enroll in Data Science Bootcamp to learn more about these ideas and advance your career today.
