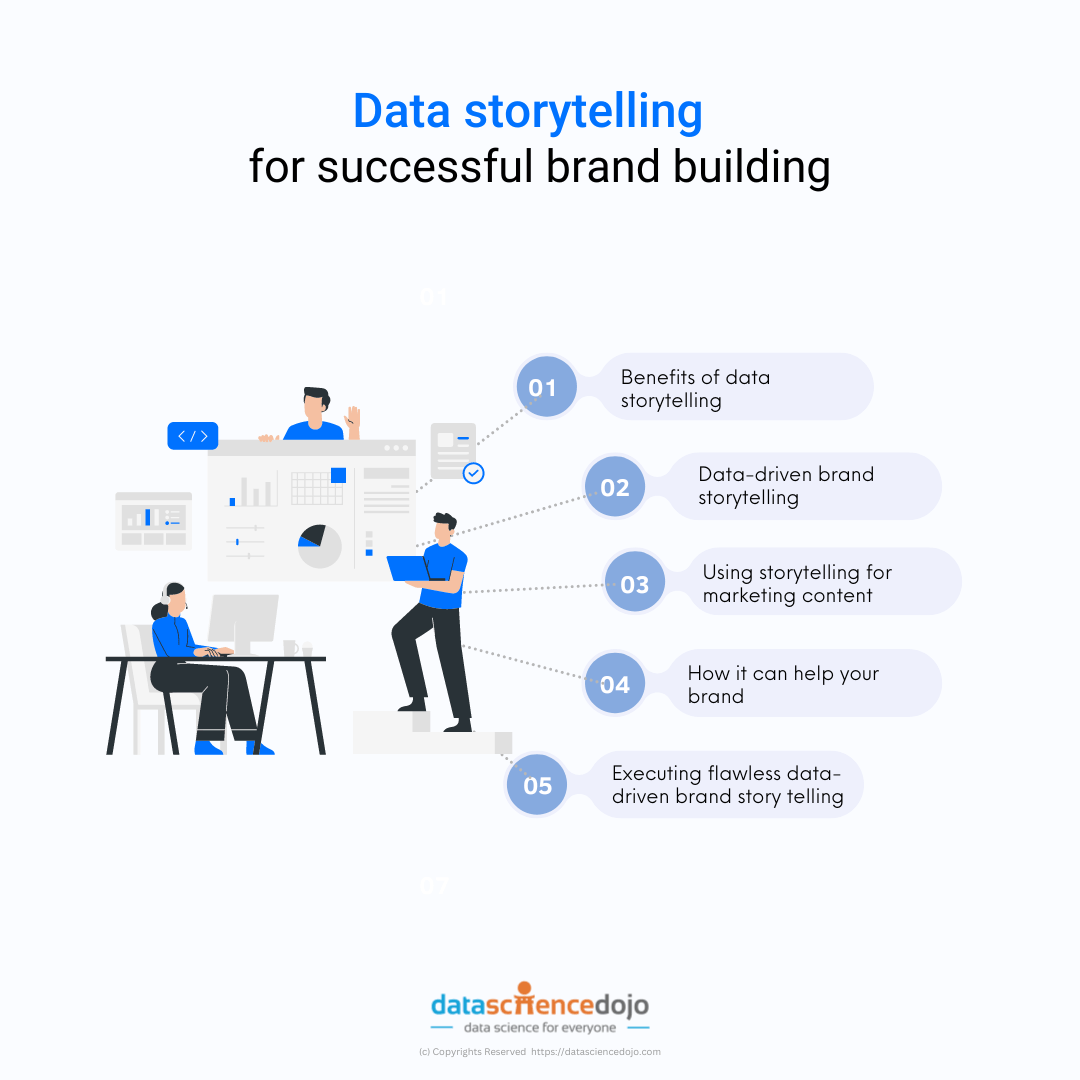
In this blog, we are going to discuss about data storytelling for successful brand building, its components and brand storytelling
What is data storytelling?
Data storytelling is a process of driving insights from a dataset using analysis and making it presentable through visualization. It not only helps capture insights but makes content visually presentable so that stakeholders can make data-driven decisions.
With data storytelling, you can influence and inform your audience based on your analysis.
There are 3 important components of data storytelling.
- Data: You analyze to build a foundation of your data story. This could be descriptive, diagnostic, predictive, or prescriptive analysis to help get a full picture.
- Narrative: Also known as a storyline, a narrative is used to communicate insights gained from your analysis.
- Visualization: Visualization helps communicate that story clearly and effectively. Making use of graphs, charts, diagrams, and audio-visuals for the purpose.
The benefits of data storytelling
So, the question arises why do we even need storytelling for data? The simple answer is it helps with decision-making. But let’s take a look at some of the benefits of data storytelling.
- Adding value to your data and insights.
- Interpreting complex information and highlighting essential key points for the audience.
- Providing a human touch to your data.
- Offering value to your audience and industry.
- Building credibility as an industry and topic thought leader.
For example, Airbnb uses data storytelling to help consumers find the right hotel at the right price and also for hosts to set up Airbnb at the most lucrative place.
Data storytelling helps AirBnB deliver personalized experience and recommendations. Their price tip feature is constantly updated to help guide hosts on how likely are they to get a booking at a chosen price. Other features include host/guest interactions, current events, and local market history in real-time available through its app.
Data-driven brand storytelling
Now that we have an understanding of data storytelling, let’s talk about how brand storytelling works. Data-driven brand storytelling is when a company uses research, studies, and analytics to share information about a brand and tell a story to consumers.
It turns complex datasets into an insightful easy to understand visually comprehensible story. It is different than creative storytelling where the brand only focuses on creating a perception. Here the story is based on factual data.
Storytelling is a great way to build brand association and connect with your consumers. Data-driven storytelling uses visualization that captures attention.
Learn how to create and execute data visualization and tell a story with your data by enrolling in our 5-day live Power BI training.
Studies show that our brains process images 60,000 times faster than words, 90% of information transmitted to the brain is visual in nature and we’re 65% more likely to retain information that is visual.
That’s why infographics, charts, and images are so useful.
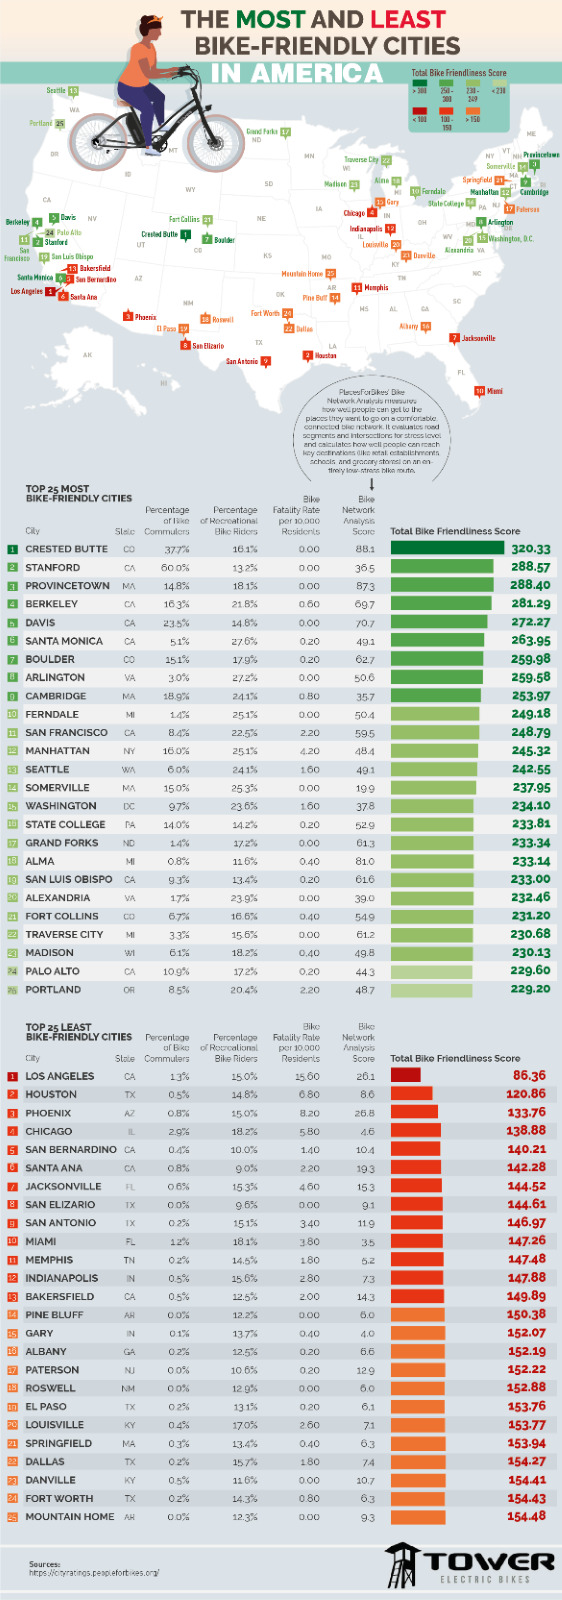
For example, Tower Electric Bikes, a direct-to-consumer e-bike brand used a infographic to rank the most and the least bike-friendly cities across the US. This way they turned an enormous amount of data into visually friendly info-graphic that bike consumers can interpret with just a glance.
Using the power of storytelling for marketing content
Even though all content is interpreted as data by consumer but visual content provides the most value in terms of memorability, impact, and capturing their attention. The job of any successful brand is to build a positive association in consumers’ minds.
Storytelling helps create those positive associations by providing high-value engaging content, capturing attention, and giving meaning to not-so-visually appealing datasets.
We live in a world that is highly cluttered by advertising and paid promotional content. To make your content stand out from competitors you need to have good visualization and a story behind it. Storytelling helps assign meaning and context to data that would otherwise look unappealing and dry.
Consumers gain clarity, and better understanding, and share more if it makes sense to them. Data storytelling helps extract and communicate insight that in turn helps your consumer’s buying journey.
It could be content relevant to any stage of their buyer journey or even outside of the sales cycle. Storytelling helps create engaging and memorable marketing content that would help grow your brand.
Learn how to use data visualization, narratives, and real-life examples to bring your story to life with our free community event Storytelling Data.
Executing flawless data-driven brand storytelling
Now that we have a better understanding of brand storytelling, let’s have a look at how to go about crafting a story and important steps involved.
Craft a compelling narrative
The most important element in building a story is the narrative. You need a compelling narrative for your story. There are 4 key elements to any story.
Characters: These are your key players or stakeholders in your story. They can be customers, suppliers, competitors, environmental groups, government, or any other group that has to do with your brand.
Setting: This is where you use your data to reinforce the narrative. Whether it’s an improved feature in your product that increases safety or a manufacturing process that takes into account environmental impact. This is the stage where you define environment that concerns your stakeholders.
Conflict: Here you describe the root issue or problem you’re trying to solve with data. This could be marketing content that generated sales revenue, you want your team to have a better understanding of it to create helpful content for the sales team. Conflict plays a crucial role in making your story relevant and engaging. There needs to be a problem for a data solution.
Resolution: Finally, you want to propose a solution to the identified problem. You can present a short-term fix along with a long-term pivot depending on the type of problem you are solving. At this stage, your marketing outreach should be consistent with a very visible message across all channels.
You don’t want to create confusion, whatever resolution/result you’ve achieved through analysis should be clearly indicated with supporting evidence and compelling visualization to make your story come to life.
Your storytelling needs to have all these steps to be able to communicate your message effectively to the desired audience. With these steps, your audience will walk through a compelling, engaging and impactful story.
Start learning data storytelling today
Our brains are hard-wired to love stories and visuals. Storytelling is not something new it dates back to 1700 BCE, from cave paintings to symbol language. That is the reason it resonates so well in today’s fast-paced cluttered consumer environment.
Brands can use storytelling based on factual data to engage, create positive associations and finally encourage action. The best way to come up with a story narrative is to use internal data, success stories, and insights driven by your research and analysis. Then translate those insights into a story and visuals for better retention and brand building.
Here’s a chance for you to learn all about data and how to generate data-driven insights that are useful for your business!

Written by Bilal Awan