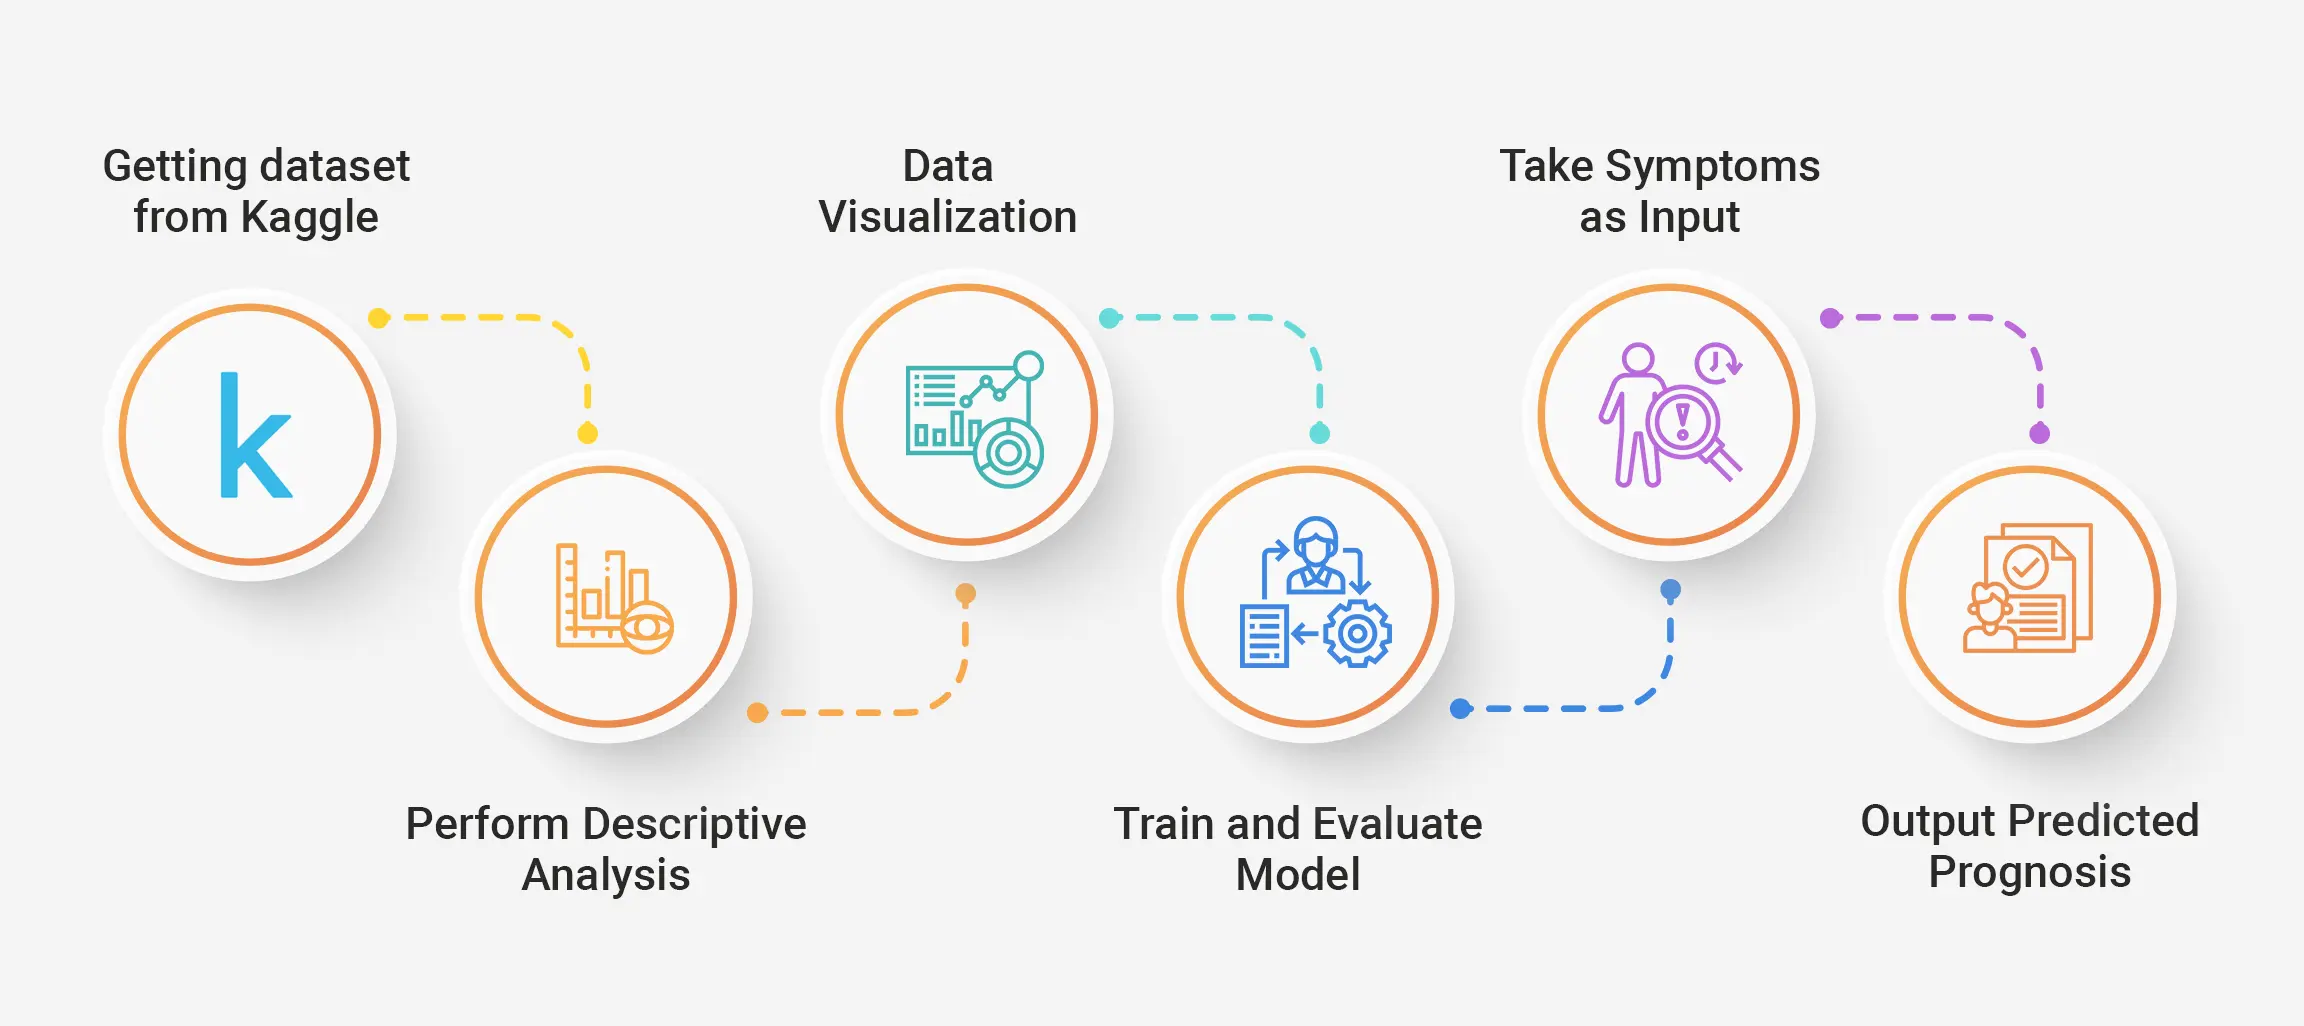
In this blog, we discussed the applications of AI in healthcare. We took a deep dive into an application of AI, and prognosis prediction using an exercise. We made a simple prognosis detector with an explanation of each step. Our predictor takes symptoms as inputs and predicts the prognosis using a classification model.
Introduction to prognosis prediction
The role of data science and AI (Artificial Intelligence) in the Healthcare industry is not limited to predicting and tracking disease spread. Now, it has become possible to learn the causes of whatever symptoms you are experiencing, such as cough, fever, and body pain, without visiting a doctor and self-treating it at home. Platforms like Ada Health and Sensely can diagnose the symptoms you report.
If you have not already, please go back and read AI & Healthcare. If you have already read it, you will remember I wrote, “Predictive analysis, using historical data to find patterns and predict future outcomes can find the correlation between symptoms, patients’ habits, and diseases to derive meaningful predictions from the data.”
This tutorial will do just that: Predict the prognosis with symptoms as our input.
Exercise: Predict prognosis using symptoms as input
Import required modules
Let us start by importing all the libraries needed in the exercise. We import pandas as we will be reading CSV files as Data Frame. We are importing Label Encoder from sklearn.preprocessing package. Label Encoder is a utility class to convert non-numerical labels to numerical labels. In this exercise, we predict prognosis using symptoms, so it is a classification task.
We are using RandomForestClassifier, which consists of many individual decision trees that work as an ensemble. Learn more about RandomForestClassifier by enrolling in our Data Science Bootcamp, a remote instructor-led Bootcamp. We also require classification reports and accuracy score metrics to measure the model’s performance.
import numpy as np
import pandas as pd
from sklearn.preprocessing import LabelEncoder
from sklearn.ensemble import RandomForestClassifier
from sklearn.metrics import classification_report, accuracy_score
Read CSV files
We are using this Kaggle dataset for our exercise.
It has two files, Training.csv and Testing.csv, containing training and testing data, respectively. You can download these files by going to the data section of the above link.
Read CSV files into Data Frame using pandas read_csv() function. It reads comma-separated files at supplied file path into DataFrame. It takes a file path as a parameter, so provide the right file path where you have downloaded the files.
train = pd.read_csv("File path of Training.csv")
test = pd.read_csv("File path of Testing.csv")
Check samples of the training dataset
To check what the data looks like, let us grab the first five rows of the DataFrame using the head() function.
We have 133 features. We want to predict prognosis so that it would be our target variable. The rest of the 132 features are symptoms that a person experience. The classifier would use these 132 symptoms feature to predict prognosis.
train.head()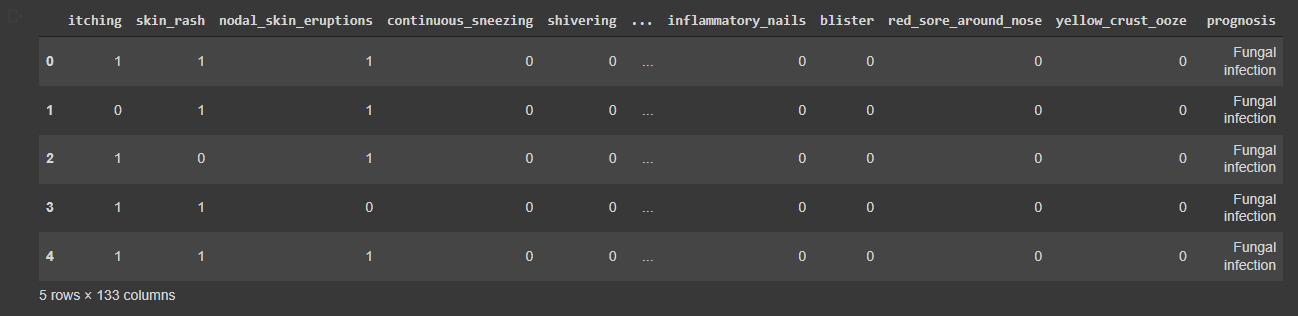
The training set holds 4920 samples and 133 features, as shown by the shape attribute of the DataFrame.
train.shapeOutput
(4920, 133)Descriptive analysis
Description of the data in the DataFrame can be seen by describe() method of the DataFrame. We see no missing values in our DataFrame as the count of all the features is 4920, which is also the number of samples in our DataFrame. We also see that all the numeric features are binary and have a value of either 1 or 0.
train.describe()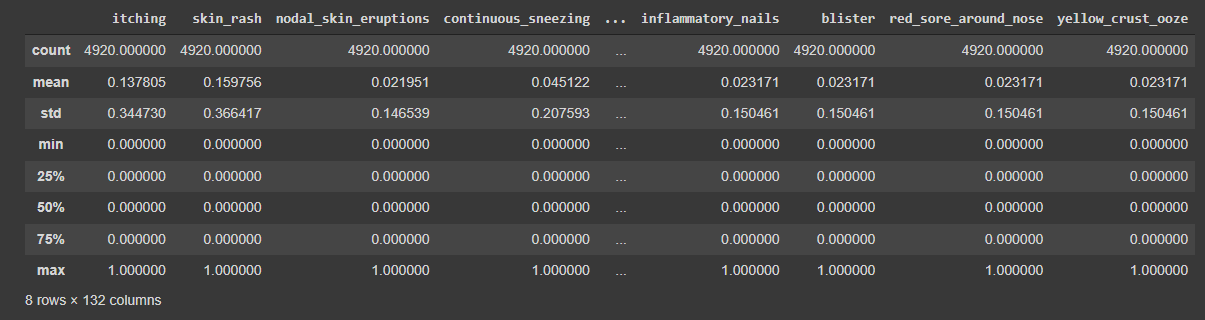
train.describe(include=['object'])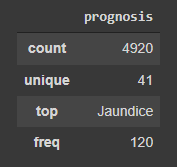
Our target variable prognosis has 41 unique values, so there are 41 diseases in which the model will classify input. There are 120 samples for each unique prognoses in our dataset.
train['prognosis'].value_counts()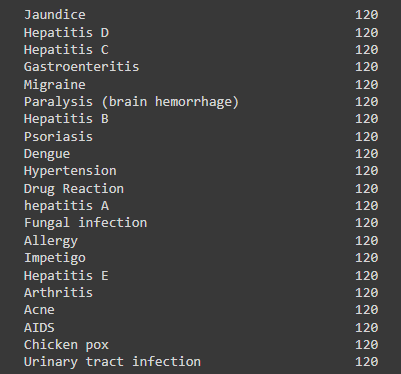
There are 132 symptoms in our dataset. The names of the symptoms will be listed if we use this code block.
possible_symptoms = train[train.columns.difference(['prognosis'])].columnsprint(list(possible_symptoms))
Output
['abdominal_pain', 'abnormal_menstruation', 'acidity', 'acute_liver_failure', 'altered_sensorium', 'anxiety', 'back_pain', 'belly_pain', 'blackheads', 'bladder_discomfort', 'blister', 'blood_in_sputum', 'bloody_stool', 'blurred_and_distorted_vision', 'breathlessness', 'brittle_nails', 'bruising', 'burning_micturition', 'chest_pain', 'chills', 'cold_hands_and_feets', 'coma', 'congestion', 'constipation', 'continuous_feel_of_urine', 'continuous_sneezing', 'cough', 'cramps', 'dark_urine', 'dehydration', 'depression', 'diarrhoea', 'dischromic _patches', 'distention_of_abdomen', 'dizziness', 'drying_and_tingling_lips', 'enlarged_thyroid', 'excessive_hunger', 'extra_marital_contacts', 'family_history', 'fast_heart_rate', 'fatigue', 'fluid_overload', 'fluid_overload.1', 'foul_smell_of urine', 'headache', 'high_fever', 'hip_joint_pain', 'history_of_alcohol_consumption', 'increased_appetite', 'indigestion', 'inflammatory_nails', 'internal_itching', 'irregular_sugar_level', 'irritability', 'irritation_in_anus', 'itching', 'joint_pain', 'knee_pain', 'lack_of_concentration', 'lethargy', 'loss_of_appetite', 'loss_of_balance', 'loss_of_smell', 'malaise', 'mild_fever', 'mood_swings', 'movement_stiffness', 'mucoid_sputum', 'muscle_pain', 'muscle_wasting', 'muscle_weakness', 'nausea', 'neck_pain', 'nodal_skin_eruptions', 'obesity', 'pain_behind_the_eyes', 'pain_during_bowel_movements', 'pain_in_anal_region', 'painful_walking', 'palpitations', 'passage_of_gases', 'patches_in_throat', 'phlegm', 'polyuria', 'prominent_veins_on_calf', 'puffy_face_and_eyes', 'pus_filled_pimples', 'receiving_blood_transfusion', 'receiving_unsterile_injections', 'red_sore_around_nose', 'red_spots_over_body', 'redness_of_eyes', 'restlessness', 'runny_nose', 'rusty_sputum', 'scurring', 'shivering', 'silver_like_dusting', 'sinus_pressure', 'skin_peeling', 'skin_rash', 'slurred_speech', 'small_dents_in_nails', 'spinning_movements', 'spotting_ urination', 'stiff_neck', 'stomach_bleeding', 'stomach_pain', 'sunken_eyes', 'sweating', 'swelled_lymph_nodes', 'swelling_joints', 'swelling_of_stomach', 'swollen_blood_vessels', 'swollen_extremeties', 'swollen_legs', 'throat_irritation', 'toxic_look_(typhos)', 'ulcers_on_tongue', 'unsteadiness', 'visual_disturbances', 'vomiting', 'watering_from_eyes', 'weakness_in_limbs', 'weakness_of_one_body_side', 'weight_gain', 'weight_loss', 'yellow_crust_ooze', 'yellow_urine', 'yellowing_of_eyes', 'yellowish_skin']
There are 41 unique prognoses in our dataset. The name of all prognoses will be listed if we use this code block:
list(train['prognosis'].unique())Output
['Fungal infection','Allergy','GERD','Chronic cholestasis','Drug Reaction','Peptic ulcer diseae','AIDS','Diabetes ','Gastroenteritis','Bronchial Asthma','Hypertension ','Migraine','Cervical spondylosis','Paralysis (brain hemorrhage)','Jaundice','Malaria','Chicken pox','Dengue','Typhoid','hepatitis A','Hepatitis B','Hepatitis C','Hepatitis D','Hepatitis E','Alcoholic hepatitis','Tuberculosis','Common Cold','Pneumonia','Dimorphic hemmorhoids(piles)','Heart attack','Varicose veins','Hypothyroidism','Hyperthyroidism','Hypoglycemia','Osteoarthristis','Arthritis','(vertigo) Paroymsal Positional Vertigo','Acne','Urinary tract infection','Psoriasis','Impetigo']Data visualization
new_df = train[train.columns.difference(['prognosis'])]
#Maximum Symptoms present for a Prognosis are 17
new_df.sum(axis=1).max()
Minimum Symptoms present for a Prognosis are 3
new_df.sum(axis=1).min()
series = new_df.sum(axis=0).nlargest(n=15)
pd.DataFrame(series, columns=["Occurance"]).loc[::-1, :].plot(kind="barh")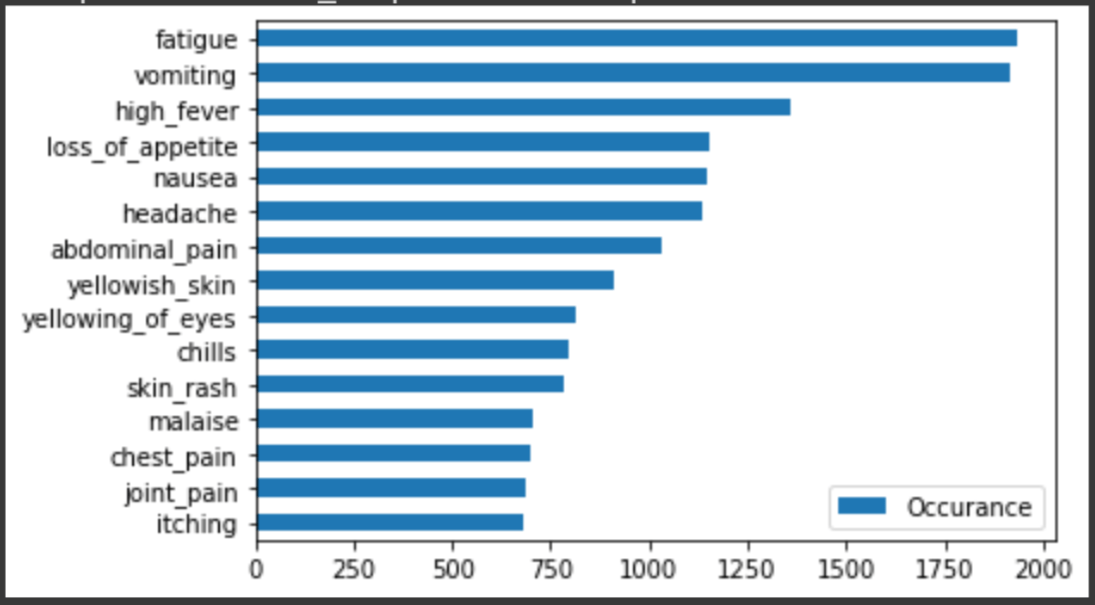
Fatigue and vomiting are the symptoms most often seen.
Encode object prognosis
Our target variable is categorical features. Let us create an instance of Label Encoder and fit it with the prognosis column of train data and test data. It will encode all possible categorical values in numerical values.
label_encoder = LabelEncoder()
label_encoder.fit(pd.concat([train['prognosis'], test['prognosis']]))
It concludes the data preparation step. Now, we can move on to model training with this data.
Training and evaluating model
Let us train a RandomForestClassifier with the prepared data. We initialize RandomForestClassifier, fit the features and label in it then finally make a prediction on our test data.
In the end, we transform label encoded prognosis values back to the original form using the fit_transform() method of the LabelEncoder object.
random_forest = RandomForestClassifier()
random_forest.fit(train[train.columns.difference(['prognosis'])], label_encoder.fit_transform(train['prognosis']))
y_pred = random_forest.predict(test[test.columns.difference(['prognosis'])])
y_true = label_encoder.fit_transform(test['prognosis'])
print("Accuracy:", accuracy_score(y_true, y_pred))
print(classification_report(y_true, y_pred, target_names=test['prognosis']))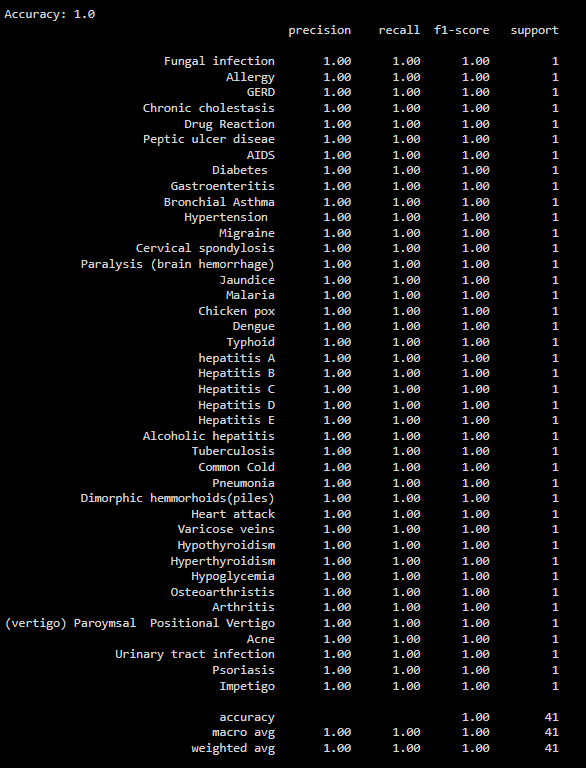
Predict prognosis by taking symptoms as input
We have our model trained and ready to make predictions. We need to create a function that takes symptoms as input and predicts the prognosis as output. The function predict_prognosis() below is just doing that.
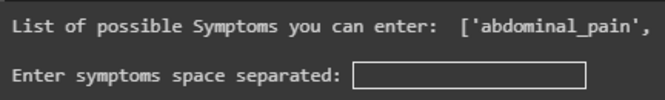
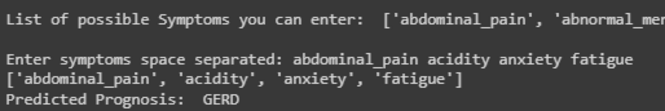
We take input features as a string of symptoms separated by space. We strip the string to remove spaces at the beginning and end of the string. We split this string and created a list of symptoms. We cannot use this list directly in the model for prediction as it contains symptoms’ names, but our model takes a list of 0 and 1 for the absence and presence of symptoms. Finally, with the features in the desired form, we predict the prognosis and print the predicted prognosis.
def predict_prognosis():
  print("List of possible Symptoms you can enter: ", list(train[train.columns.difference(['prognosis'])].columns))
  input_symptoms = list(input("\nEnter symptoms space separated: ").strip().split())
  print(input_symptoms)
  test_value = []
  for symptom in train[train.columns.difference(['prognosis'])].columns:
    if symptom in input_symptoms:
      test_value.append(1)
    else:
      test_value.append(0)
    np_test = np.array(test_value).reshape(1, -1)
    encoded_label = random_forest.predict(np_test)
  predicted_label = label_encoder.inverse_transform(encoded_label)[0]
  print("Predicted Prognosis: ", predicted_label)
predict_prognosis()
Give input symptoms:
Predicted prognoses
Conclusion
To sum up, we discussed the applications of AI in healthcare. Took a deep dive into an application of AI, and prognosis prediction using an exercise. Created a prognosis predictor with an explanation of each step. Finally, we tested our predictor by giving it input symptoms and got the prognosis as output.