Looking at the right event metrics not only helps us in gauging the success of the current event but also facilitates understanding the audience’s behavior and preferences for future events.
Creating, managing, and organizing an event seems like a lot of work and surely it is. The job of an event manager is no doubt a hectic one, and the job doesn’t end once the event is complete. After every event, analyzing it is a crucial task to continuously improve and enhance the experience for your audience and presenters.
In a world completely driven by data, if you are not measuring your events, you are surely missing out on a lot. The questions arise about how to get started and what metrics to look for. The post-Covid world has adopted the culture of virtual events which not only allows the organizers to gather audiences globally but also makes it easier for them to measure it.
There are several platforms and tools available for collecting the data, or if you are hosting it through social media then you can easily use the analytics tool of that channel. You can view our Marketing Analytics videos to better understand the analytical tools and features of each platform.
You can take the assistance of tools and platforms to collect the data but utilizing that data to come up with insightful findings and patterns is a critical task. You need to hear the story your data is trying to tell and understand the patterns in your events.
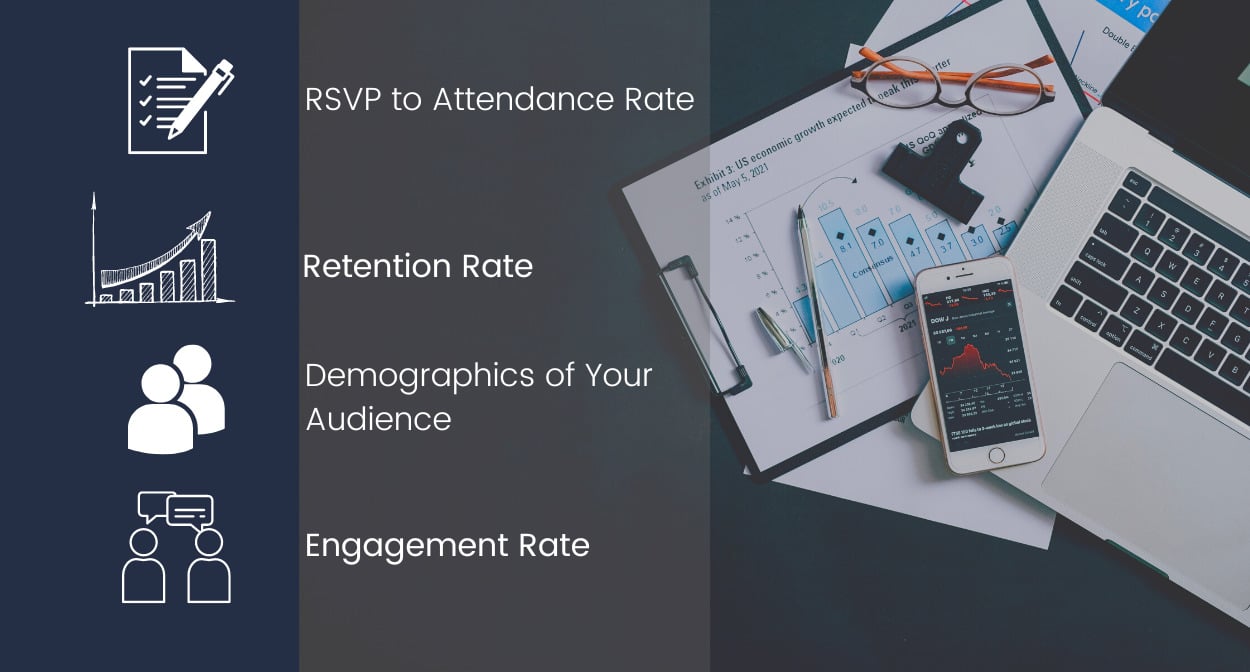
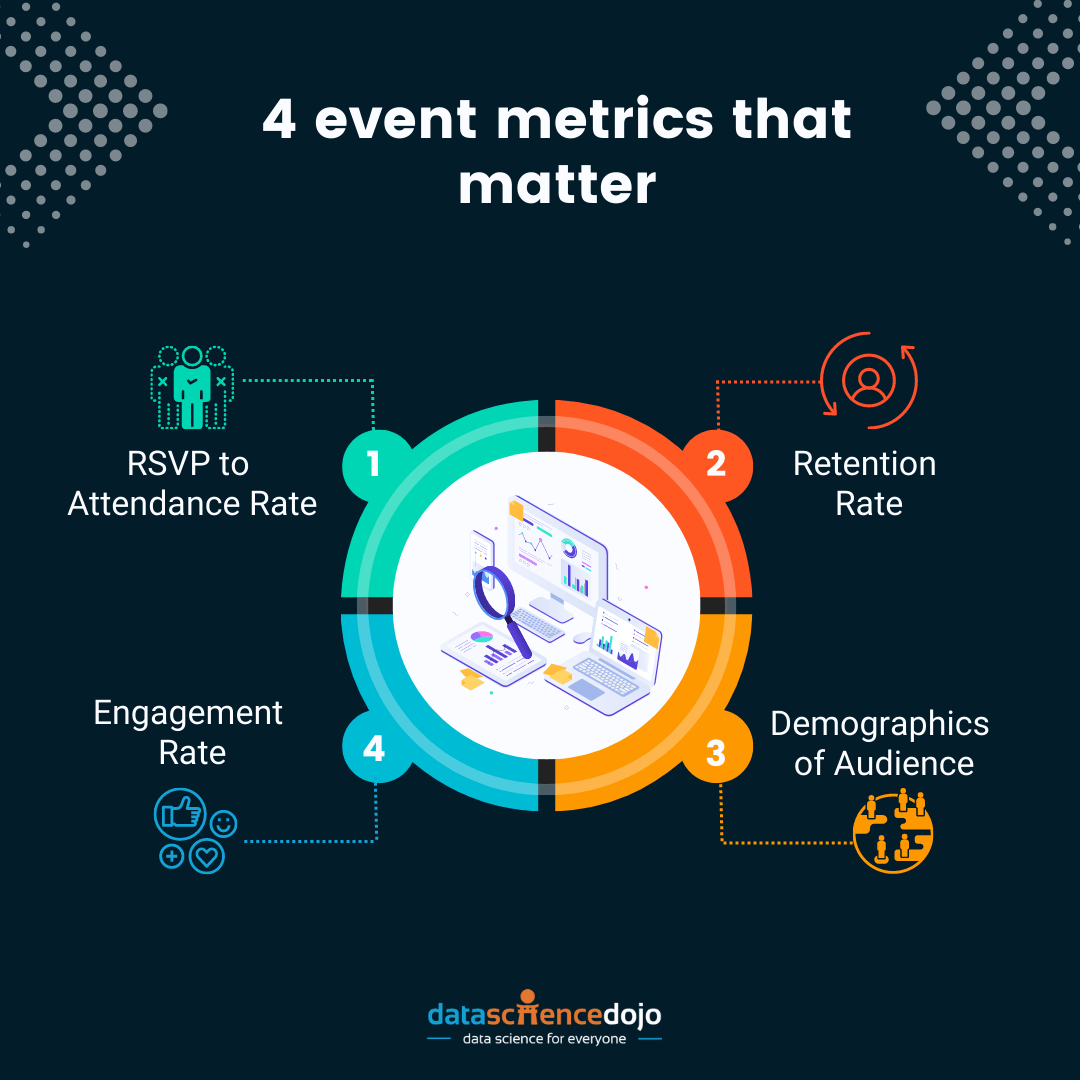
Event metrics that you should look at
1. RSVP to attendance rate
RSVP is the number of people who sign up for your event (through landing pages or social sites) while attendance rate is the number of people who show up.

You should expect at least 30% of your RSVPs to actually attend and if they don’t there is something wrong, the possible reasons could be:
- The procedure for joining the event is not provided or clarified
- They forgot about the event as they signed up long before
- The information provided regarding the event day or date is wrong
Or it many other likely reasons. You need to dig into each channel to find out the reason because if a person signs up, it shows a clear intent to attend from their end.
2. Retention rate
There are a few channels as LinkedIn and YouTube that have inbuilt analytics to gauge retention rate, but you can always integrate third-party tools for other platforms. The retention rate depicts how long your audience stayed in your webinar and the points where they dropped off.
It is usually shown as a line graph with the duration of the webinar on the x-axis and the number of people on the y-axis, in this way you can view the number of people at a certain time in the webinar. Through this chart, you can look at points where you see a drop or rise in your views.
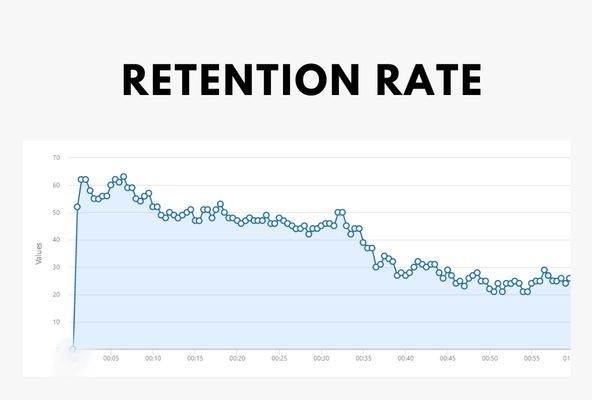
Use-case
For instance, at Data Science Dojo our webinars experienced a huge drop in the audience during the initial 5 mins of the webinar. It was worrisome for the team, so we dug into it and conducted a critical analysis of our webinars. We realized this was happening because we usually spend our first 5 mins waiting for the audience to join in but that is where our existing audience started leaving.
We decided to bring in engaging activities as a poll in those 5 mins and initiated conversations with our audience directly through chats which improved our overall retention as our audience started feeling more connected which made them stay for a long time. You can explore our webinars here.
3. Demographics of audience
It is far-reaching to know where your audience belongs to. To take more targeted decisions in the future, every business must realize the audience demographics and what type of people find your events beneficial.
Once we work on the demographics, it will help us for future events. For example, you can select a time that would be viable in your audience’s time zone, and you can also select a topic that they would be more interested in.
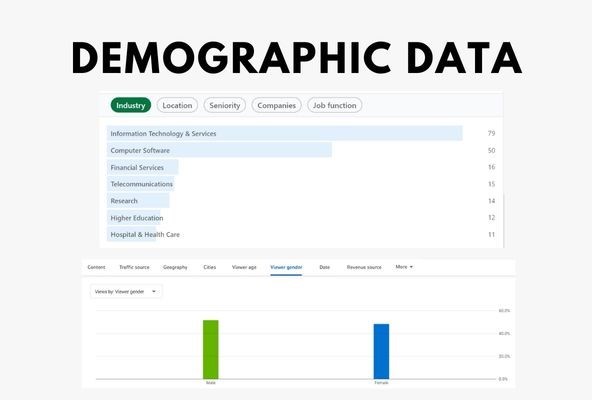
The demographics data opens many new avenues for your business, it introduces you to segments of your audience that you might not be targeting already, and you can expand your business. It shows the industries, locations, seniority, and many other crucial factors about your audience.
By analyzing this data, you can also understand whether your content is attracting the right target audience or not, if not then what kind of audience you are pulling in and whether that’s beneficial for your business or not.
4. Engagement rate
Your event might receive a large number of views but if that audience is not engaging with your content, then it is something you should be concerned about. The engagement rate depicts how involved your audience is. Today’s audience has a lot of distractions especially when it comes to online events, in that situation grasping your audience’s attention and keeping them involved is a major task.
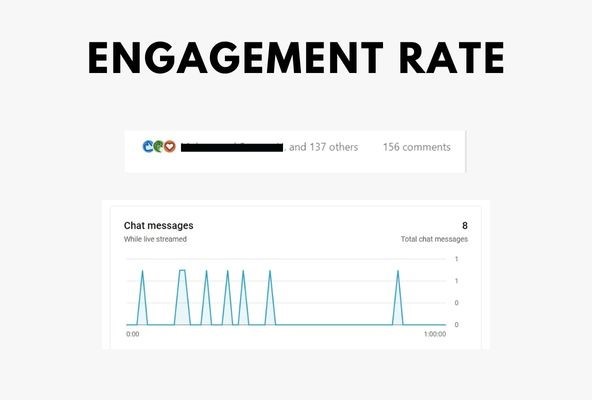
The more engaged the audience is, the higher the chance that they will benefit from it and come back to you for other services. There are several techniques to keep your audience engaged, you can look up a few engagement activities to build connections.
Make your event a success with event metrics
On that note, if you have just hosted an event or have an event on your calendar, you know what you need to look at. These metrics will help you continuously improve your event’s quality to match the audience’s expectations and requirements. Planning your strategies based on data will help you stay relevant to your audience and trends.