Take a look at WRC+, wOBA, and wRAA to determine if the shift is really creating a problem for Major League Baseball.
Argue all you want; nobody was better on the diamond than Ted Williams. The last player to finish a season with a .400 avg, Teddy Ballgame was also one of the first recipients of the defensive archetype that is taking Major League Baseball by storm today: The Shift.
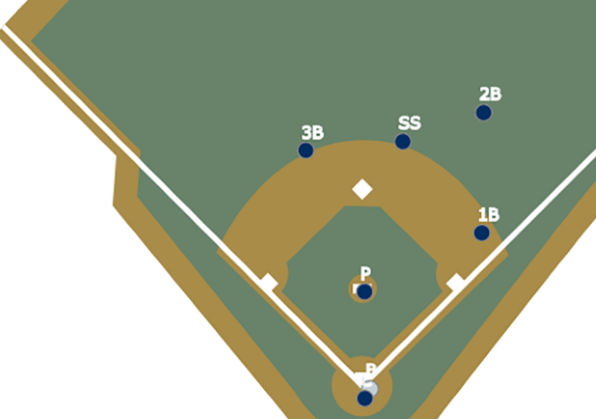
What is the shift in major league baseball?
Typically, it is deployed when a pull-heavy power hitter is at the plate. To oversimplify, the defense moves to one side of the field with the sole purpose of creating a higher chance the batter grounds out, pop out, and gets out.
In order to tell if this defensive style is working, we need to look at some data. We will be looking at data provided by FanGraphs. So before moving on, we need to understand how FanGraphs defines a defensive shift.
- Shift – Traditional: This breaks out all plays where a traditional shift is employed. Generally, this implies there are three infielders to the right of the second base (and it’s how I filtered the data).
- Shift – Non-Traditional: This breaks out all plays which would not be considered traditional.
- Shift – All: This breaks out all of it, traditional or non-traditional.
- No Shift: This breaks out all plays where it was not used.
Video courtesy of the Seattle Mariners
The Oakland Athletics might have been exaggerating a bit against Ichiro, but that’s how some fans feel when the defense shifts. So what is it meant to do?
What it does
In baseball, it is meant to take away the part of the field the batter is most likely to hit the ball toward, theoretically making them more likely to get out. It’s perfectly legal within the written rules of baseball, but baseball’s a game full of religiously followed unwritten rules. To many people who argue against the shift, it’s these unwritten rules that are being broken and why the MLB should ban them.
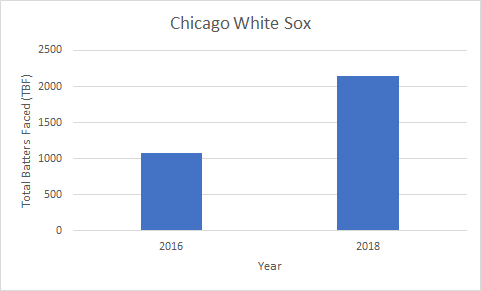
Whether you or I believe that doesn’t matter. What matters is if the data is telling us this works. Sure, you can say the only proof you need is that more teams are deploying this look on defense. The Chicago White Sox performed some variation of the shift against 1,079 batters in 2016, only to be doubled in 2018, shifting against 2,150 batters.
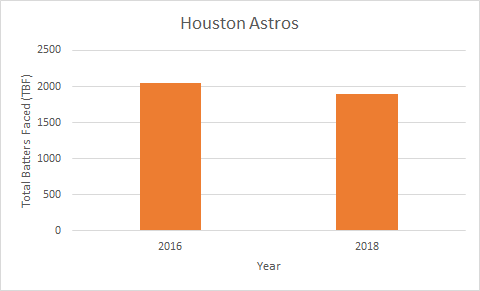
Unfortunately, this doesn’t hold true for all teams. For example, The Houston Astros, who are notorious for using the shift, shifted against 2,052 batters in 2016 but only shifted against 1,892 batters in 2018. Looking at the trend of the number of times a team uses the shift only gives us a surface-level understanding of whether or not it’s working. Let’s dig deeper.
PRO TIP: Join our data science bootcamp today to learn more about data analysis!
Weighted on-base average
Weighted On-Base Average, or wOBA, “is a rate statistic which attempts to credit a hitter for the value of each outcome (single, double, etc) rather than treating all hits or times on base equally”. Essentially, it puts an assigned weight on every outcome to account for the amount of value each outcome is perceived to carry. The League average is always scaled to the league average On Base Percentage, but we’re going to use a wOBA league average of .320 (because that’s what Fangraphs says is typical for an average player).
If we look at that magical .320 in the chart below, we see there were only five teams that had a team wOBA above the league average against it. That’s one less team than in 2016, which had 6 teams above league average at the end of the season.
Now, I don’t know about you, but that doesn’t really tell me anything other than teams really didn’t change that much between years (and the trends would agree).
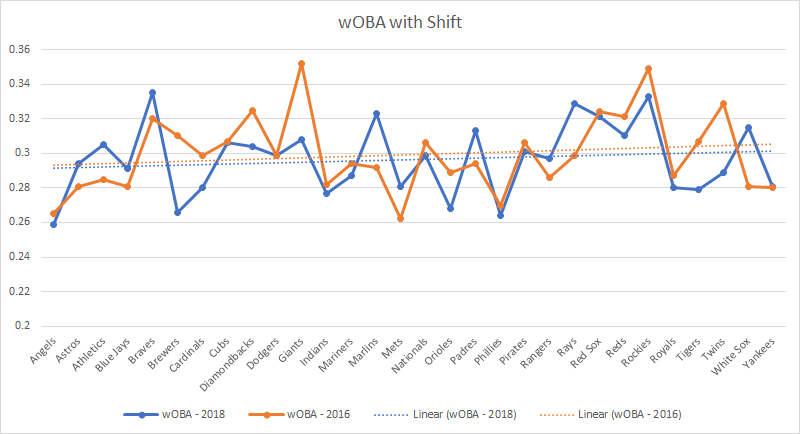
So now let’s look at the data from the 2018 season. The graph below shows us the wOBA of teams when the defense is in a traditional shift versus a normal defense (no shift).
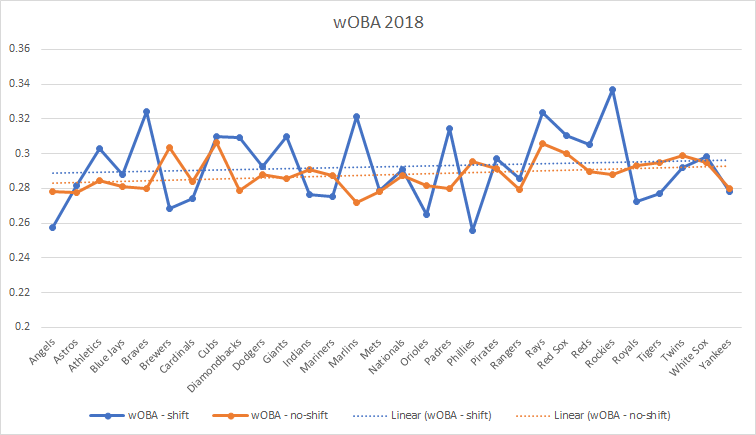
The difference isn’t staggering, but it is noticeable. We can see there are 4 teams with a wOBA above the .320 mark, while none of the teams met the average with no shift. Take this with a grain of salt. Typically big, pull-heavy, power hitters are most often shifted against, and home runs have a higher weight added to them than any other outcome. It could be the shift is showing a higher wOBA because more players are attempting to beat the shift by hitting over it. With stat cast reporting 1.9% of pitches in a shift resulting in a ground ball versus 2.5% with the ball in the air, it looks like hitters are choosing not to sacrifice power for on-base percentage.
Weighted runs above average
Weighted Runs Above Average, or wRAA, lets us measure “the number of offensive runs a player contributes to their team compared to the average player”.Zero is considered the league average, so anything positive is helping the team out.
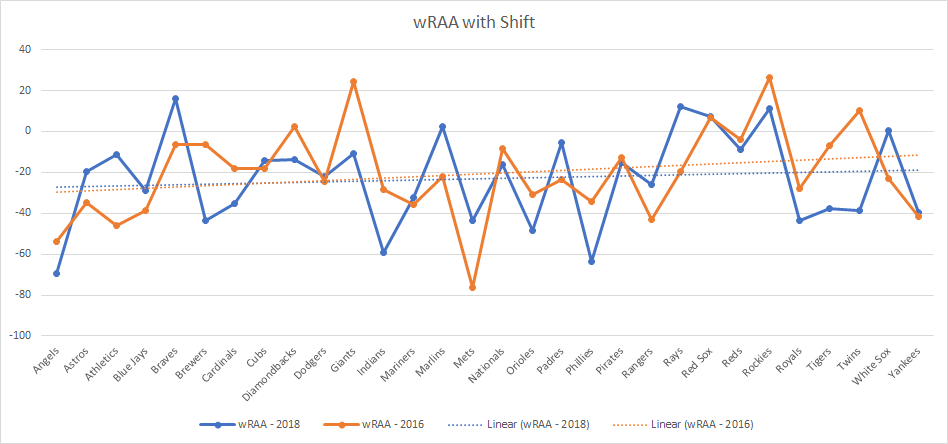
Like wOBA, I created a graph comparing wRAA between 2018 and 2016 when players are batting against a shift. And like wOBA, it doesn’t really tell us much. It looks like some teams made adjustments, while others didn’t.
This is where things get interesting. We see a big difference when comparing the 2018 shift statistics vs. no shift. Teams typically have a higher wRAA with the shift than without.
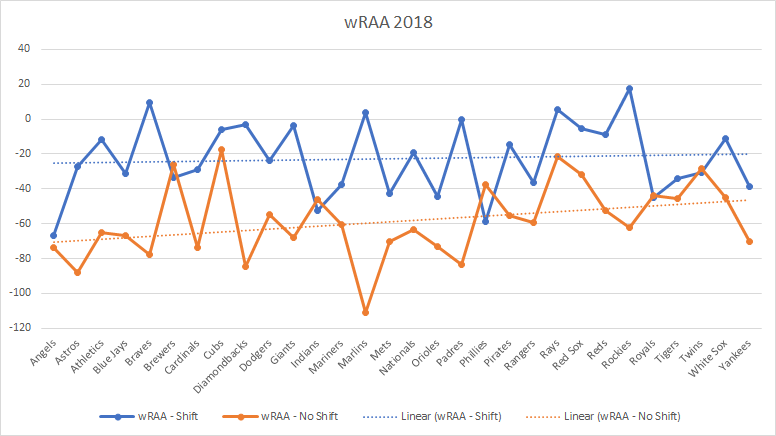
Once again, this should be taken with a grain of salt (that makes two now), but it does look like the shift doesn’t stop people from scoring. In fact, you could argue that the shift is allowing more teams to score.
Weighted runs created plus
Weighted Runs Created Plus, or wRC+, is similar to wOBA in that it assigns weights to outcomes in order to credit a hitter for a higher-valued outcome, but it also takes into account that all ballparks create a different environment for scoring runs. wRC+ quantifies a player’s total offensive value measured by runs. The league average is scaled to 100.
In the graph below, teams didn’t see much of a difference when batting against the shift in 2018 as they did in 2016. The trend lines are almost identical, which leads me to believe the shift really hasn’t changed much about the game when it comes to creating runs.
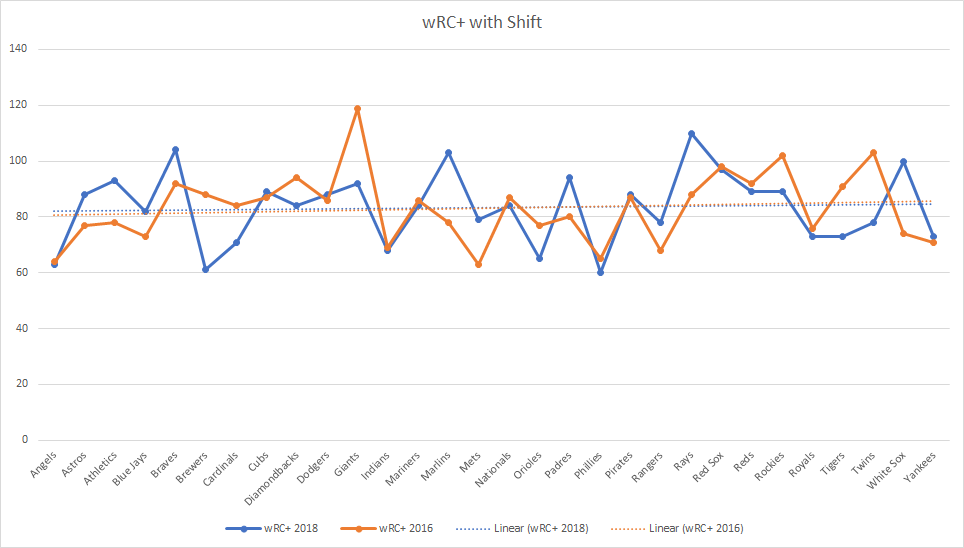
But if we look at the difference in 2018 between batting against a shift and no shift, there is a subtle difference (like 3 percentage points). Not really enough to convince me the shift is creating this major problem in baseball that must be stopped.
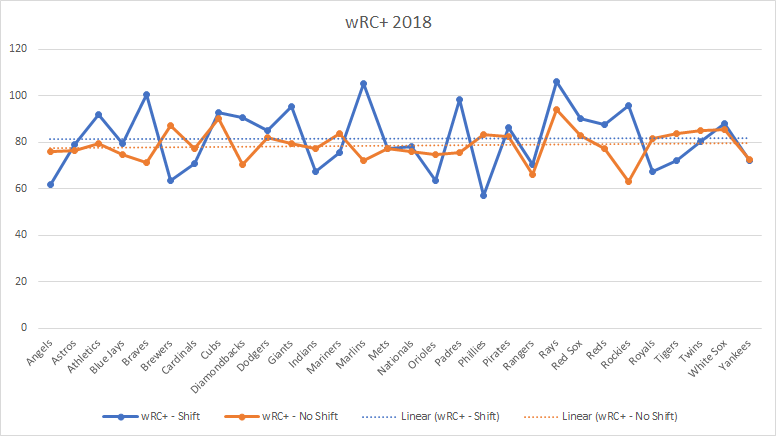
If anything, it’s helping teams like the Rays and Marlins actually score runs. Both teams are named after ocean creatures. Both had a wRC+ against the shift of more than 100 and a positive wRAA against the shift in 2018. Coincidence? I’ll let you decide.
Recap
To recap, wOBA, wRAA, and wRC+ suggest the shift might not be creating the defensive outcome teams are looking for. Personally, I don’t think we have quite enough data to draw insightful conclusions about the shift.
However, from the limited data available, we can see a 2:1 ratio of outs to hits as a percentage of pitches thrown while teams are using the shift during the 2018 season. To break it down, 2.9% of pitches thrown in a shift resulted in an out, while 1.4% resulted in a hit. We also see a 2:1 ratio when teams are in a no-shift defense. 8.6% of pitches resulted in an out versus 4.3% resulting in a hit.
However, from the limited data available, we can see a 2:1 ratio of outs to hits as a percentage of pitches thrown while teams are using the shift during the 2018 season. To break it down, 2.9% of pitches thrown in a shift resulted in an out, while 1.4% resulted in a hit. We also see a 2:1 ratio when teams are in a no-shift defense. 8.6% of pitches resulted in an out versus 4.3% resulting in a hit.
Before you make a decision, please read up about what other people are saying. Here are a few good articles you can read to help you form an opinion about the shift.
- 9 things you need to know about the shift
- Is “The Shift” Bad for Major League Baseball?
- Shifting the Blame
- Don’t Worry, MLB – Hitters Are Killing The Shift On Their Own
- MLB hitters explain why they can’t just beat the shift
Do you want to learn data science and higher-level analytics? Check out Data Science Dojo’s data science bootcamp!