HR Analytics and employee churn rate prediction: classification and regression tree applied to a company’s HR data. This article explains churn rate prediction in overcoming the trend of people resigning from companies.
People are expected to give their all – labor, passion, and time – to their jobs. But if their jobs don’t give back enough, they will leave. As have 4.5 million burned-out American employees who quit their jobs since November 2021 due to low satisfaction. Could their HRs have retained them if churn rate prediction identified those ready to leave?
HR analytics refers to the collection of employee data, its analysis, and reporting of actionable insights. Information from HR analytics can be used to:
- generalize standards for working conditions to avoid burnout
- assign projects that align with employees’ strengths for better performance
- launch initiatives that align with career aspirations for higher satisfaction
- evaluate performance to uncover sources of talent
So, corporations are using data to retain talented employees, increase employee satisfaction, boost company loyalty, churn rate prediction and reduce hiring and retention costs.
Churn rate prediction using machine learning
Classification and regression trees (CART) enable companies to characterize loyalty and identify who is likely to resign. Not only that, but it also reveals the conditions that affect their loyalty and/or make them unsatisfied. So, in this analysis, we will not only be conducting churn rate prediction but also identify possible factors of what pushed them over the edge.
When you perform CART, you can identify two paths: what makes an employee loyal, and what makes an employee leave. Each path has a set of attributes that leads to a greater sense of loyalty, as well as those that lead to higher dissatisfaction.
Then, each of these attributes is ranked in order of importance to know which has a greater influence on the employee’s decision to stay or to leave. There are different solutions available in the market for HR analytics, but we will apply the CART algorithm using the R programming language.
This is a simulated dataset with several measures that can be used to predict which employees are at a risk to leave the company. Here, the CART algorithm unfolds actionable insights in the following steps:
- Business case
- Data exploration and preparation
- Split data into training and validation
- Develop an initial model and interpret two complete paths
- Identify important variables
You can follow the steps from this notebook to perform it on your device by clicking here.
1. Business case
In this case study, we will visualize two paths of attributes that affect loyalty and dissatisfaction among employees. The business case is formed around the question: Can we predict those employees who are likely to churn?
2. Data exploration and preparation
There are eight continuous variables and two categorical variables in the data set that offers information about 14999 employees. Continuous variables are those with numerical values, and categorical variables group things into category headers, like “Departments” that can have values similar to sales, marketing, consumer, operations, and so on.
The variables are explained in the data dictionary below:
- satisfaction_level: Satisfaction ratings of the job of an employee
- last_evaluation: Rating between 0 to 1, received by an employer over their job performance during the last evaluation
- number_projects: Number of projects an employee is involved in
- average_monthly_hours: The average number of hours in a month, spent by an employee at the office
- time spent_company: Number of years spent in the company
- work_accident: 0-no accident during employee stay, 1 accident during employee stay
- promotion_last 5 years: Number of promotions in the employee’s stay period
- resigned: 0 indicates the employee stays in the company, 1 indicates-the employee who resigned from the company
- salary_grade: Salary earned by an employee
- department: the department to which an employee belongs
We will plot the variables to explore:
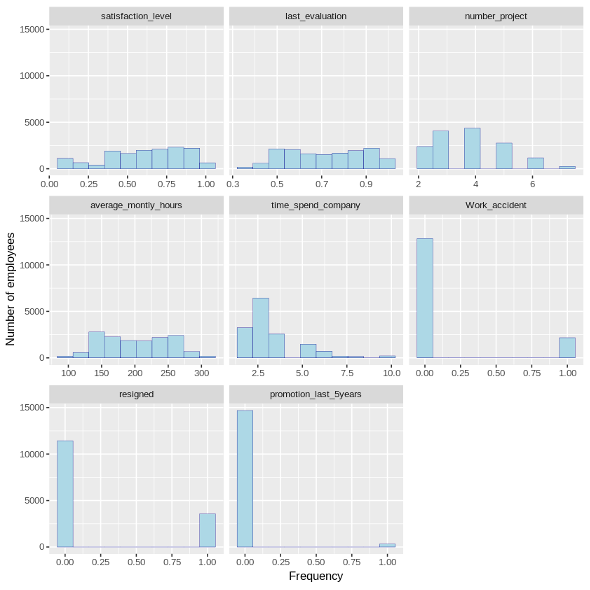
- Satisfaction level: Most employees are highly satisfied.
- Last evaluation: Most employees are good performers with 75% of the data set being evaluated between 56%-87%.
- Number of projects: most employees do a reasonable number of projects.
- Average monthly hours: Most employees spend, fairly, a higher number of hours at work.
- Time spent in the company: Fewer employees stay beyond 4 years.
Let us take a second glance at the binary, continuous variables: work_accident, resigned, and promotion_last_5years.
Frequency of accidents at work
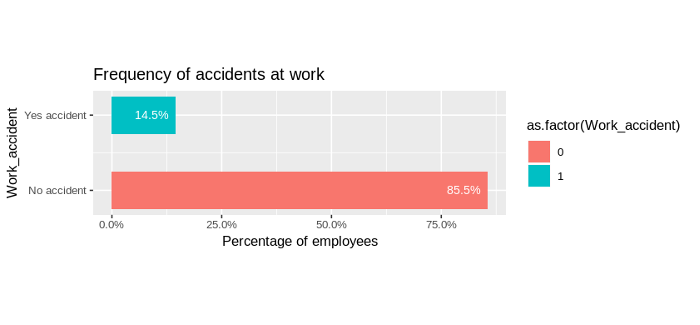
- Most employees (85.5%) did not have an accident
Frequency of resignations
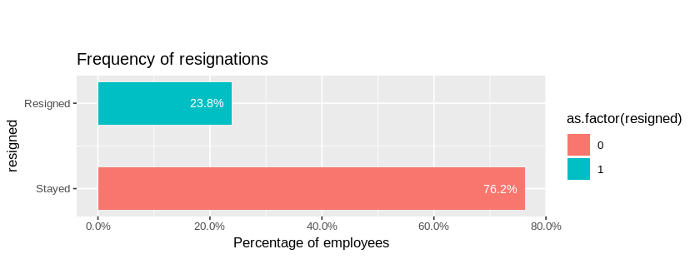
- Most employees (76.2%) stayed with the organization and did not resign.
Frequency of promotions in the last 5 years
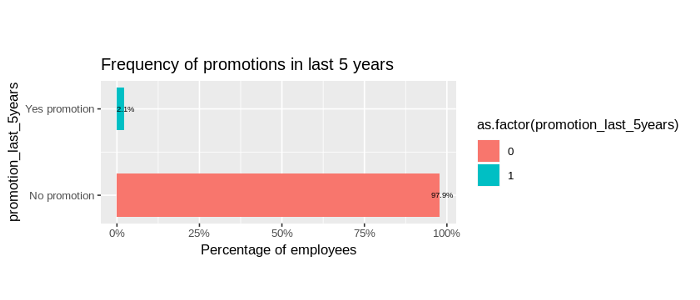
- Most employees (97.9%) did not receive a promotion in the last 5 years.
Exploring categorical variables: salary_grade and department.
Salary grade of employees
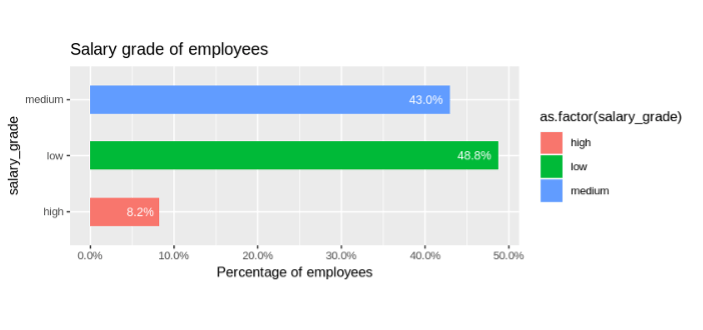
- 8.2% of the organization from the top level with the highest pay, 42.9% of the employees are paid a medium salary and 48.7% of the employees are paid a low salary.
Number of employees in each department
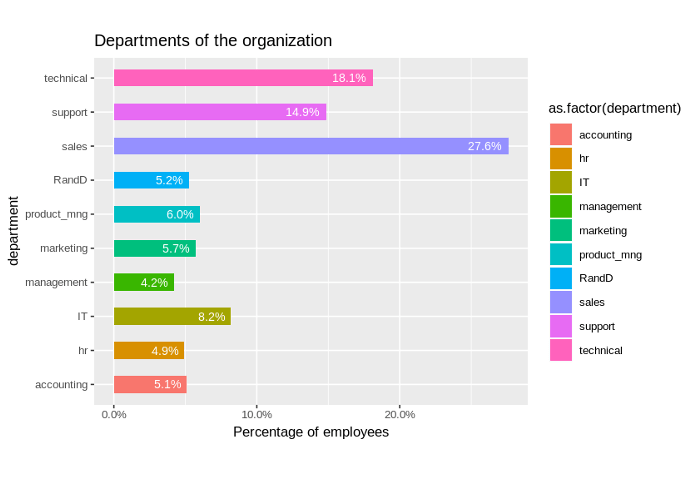
- The department ‘sales’ has the highest number of employees at 27% and management the lowest which forms only 4.2%.
3. Split data into training and validation
The algorithm identifies the pattern in the data and learns the intricacies and nuances of that pattern to build an ability to predict accurately. Therefore, we split our dataset so that we can test the trained model on a representative dataset where we already know the correct predictions. This will let us know how well the model that we trained is performing.
But before we train the model, we will create factors of the following variables:
- Department: Represents the number of employees in each department. There are a total of 10 departments. Department Sales has the highest number of employees at 27% and management the lowest which forms only 4.2%.
- Salary grade: Represents the salary as low medium and high. 8.25% of the organization are top level with the highest pay, 42.9% of the employees are paid a medium salary and 48.7% of the employees are paid a low salary.
- Resigned: In this, 0 denotes who stayed and 1 denotes who resigned from the organization.
We create factors when we wish that each type within a variable be treated as a category. For example, in R’s memory, factorizing the variable ‘department’ will mean treating, ‘low,’ ‘high,’ and ‘medium’ as individual categories. This ensures that the modeling functions treat each type correctly.
4. Develop an initial model
The initial model is developed on the training data set.
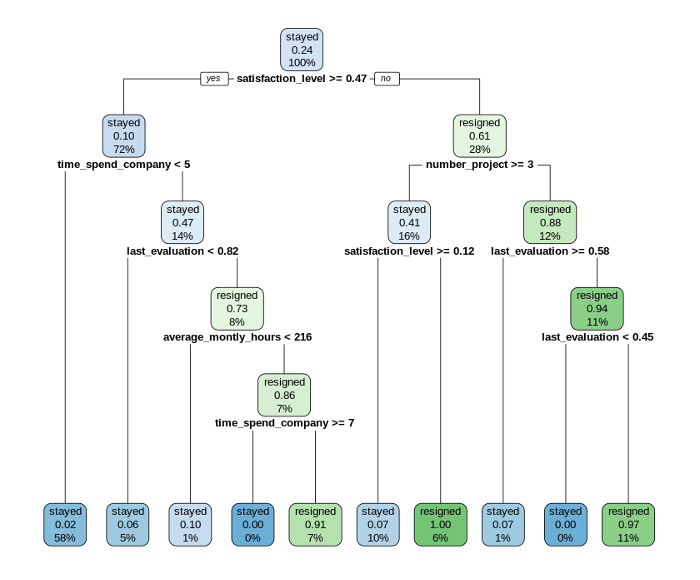
How to read the tree?
- 1 denotes ‘resigned,’ and 0 denotes ‘stayed’
- At the top when no condition is applied to the training data set (train) the best guess is determined as 0 (stayed)
- Of the total observations 76% did not leave and 24% left
Interpreting two complete paths
Path 1: Will not leave (Loyal)
- first condition: satisfaction level >= 47%
- second condition: time_spend_company < 5 years
- third condition: last_evaluation < 81%
Hence, those who did NOT leave are highly satisfied, have spent at least 4 years in the organization, and are good performers with an evaluation of at least 80%.
Path 2: Will leave (Resign)
- first condition: satisfaction_level < 47%
- second condition: number_project >= 3 projects
- third condition: last_evaluation >= 58%
Hence, those who leave are lowly or moderately satisfied and have a workload of 3 or more projects with their performance being evaluated at least 58%.
5. Identify the important variables
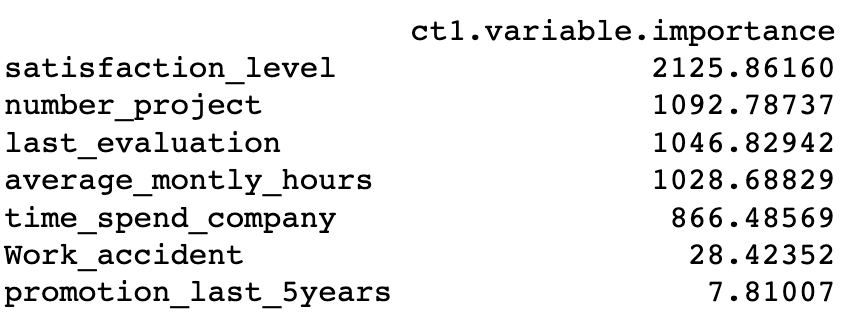
Summary
Characterizing loyalty
11,428 employees, which is, 76% of the data set are loyal. Three conditions that affect loyalty are:
- a high level of satisfaction (satisfaction_level >= 47%)
- have spent at least 4 years in the organization (time_spend_company < 5 years)
- are good performers with an evaluation of at least 80% (last_evaluation < 81%)
Characterizing left
3,571 employees, which is, 24% of the data set left. Three conditions that affect ‘resigned’ are:
- low or moderate satisfaction (satisfaction_level < 47%)
- have a workload of 3 or more projects (number_project >= 3 projects) and
- their performance being evaluated at least 58% (last_evaluation >= 58 %)
HR analytics, the provenance of a few leading companies, a decade ago, is a solution that is being widely applied now by several growing businesses to uncover surprising sources of talent and counterintuitive insights about what drives employees to be loyal to their organization. We hope this encourages you to leverage the power of HR analytics to retain talent and save hiring costs. You can follow the steps from this notebook to perform it on your device by clicking on the button below:
![]()