

In data science and machine learning, decision trees are powerful models for both classification and regression tasks. They follow a top-down greedy approach to select the best feature for each split. Two fundamental metrics determine the best split at each node – Gini Index and Entropy.
This blog will explore what these metrics are, and how they are used with the help of an example.
What is the Gini Index?
It is a measure of impurity (non-homogeneity) widely used in decision trees. It aims to measure the probability of misclassifying a randomly chosen element from the dataset. The greater the value of the Gini Index, the greater the chances of having misclassifications.
Formula and Calculation
The Gini Index is calculated using the formula:
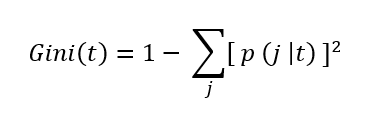
where p( j | t ) is the relative frequency of class j at node t.
- The maximum value is (1 – 1/n) indicating that n classes are equally distributed.
- The minimum value is 0 indicating that all records belong to a single class.
Another interesting read: Data Science Lifecycle
Example
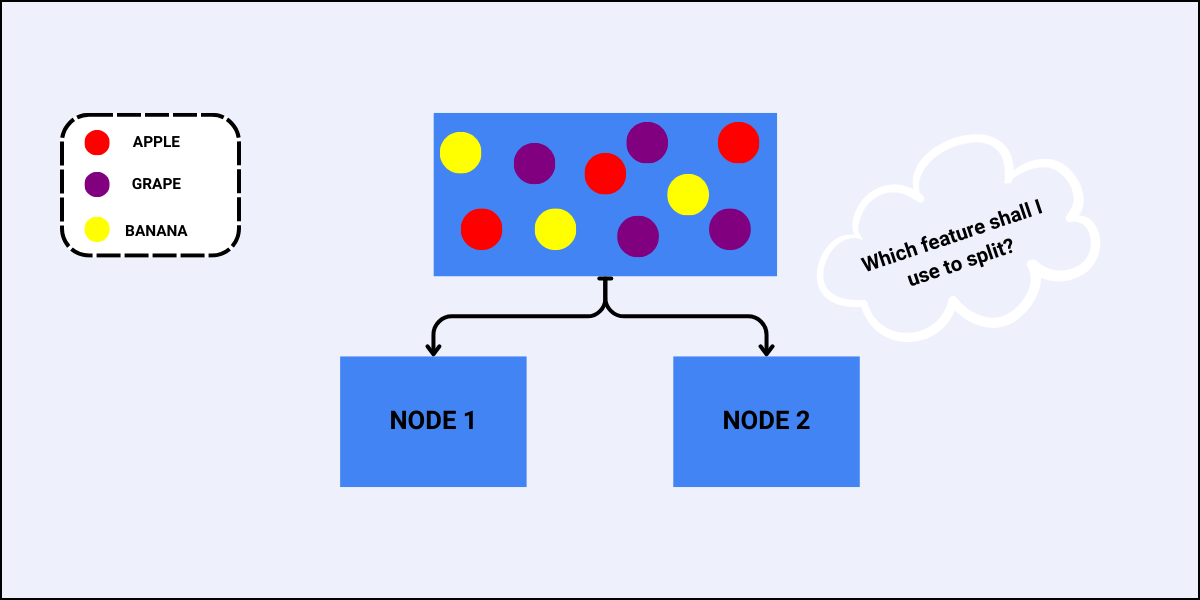
Consider the following dataset.
| ID | Color (Feature 1) | Size (Feature 2) | Target (3 Classes) |
| 1 | Red | Big | Apple |
| 2 | Red | Big | Apple |
| 3 | Red | Small | Grape |
| 4 | Yellow | Big | Banana |
| 5 | Yellow | Small | Grape |
| 6 | Red | Big | Apple |
| 7 | Yellow | Small | Grape |
| 8 | Red | Small | Grape |
| 9 | Yellow | Big | Banana |
| 10 | Yellow | Big | Banana |
This is also the initial root node of the decision tree, with the Gini Index as:
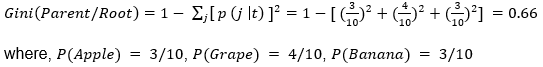
This result shows that the root node has maximum impurity i.e., the records are equally distributed among all output classes.

Gini Split
It determines the best feature to use for splitting at each node. It is calculated by taking a weighted sum of the Gini impurities (index) of the sub-nodes created by the split. The feature with the lowest Gini Split value is selected for splitting of the node.
Formula and Calculation
The Gini Split is calculated using the formula:
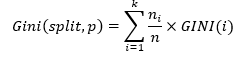
where
- ni represents the number of records at child/sub-node i.
- n represents the number of records at node p (parent-node).
Also explore: Statistical Foundations of Data Science
Example
Using the same dataset, we will determine which feature to use to perform the next split.
- For the feature “Color”, there are two sub-nodes as there are two unique values to split the data with:
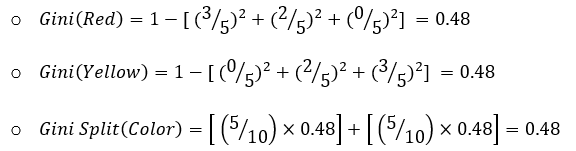

- For the feature “Size”, the case is similar as that of the feature “Color”, i.e., there are also two sub-nodes when we split the data using “Size”:
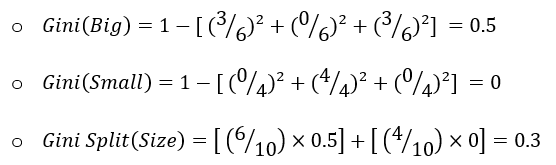
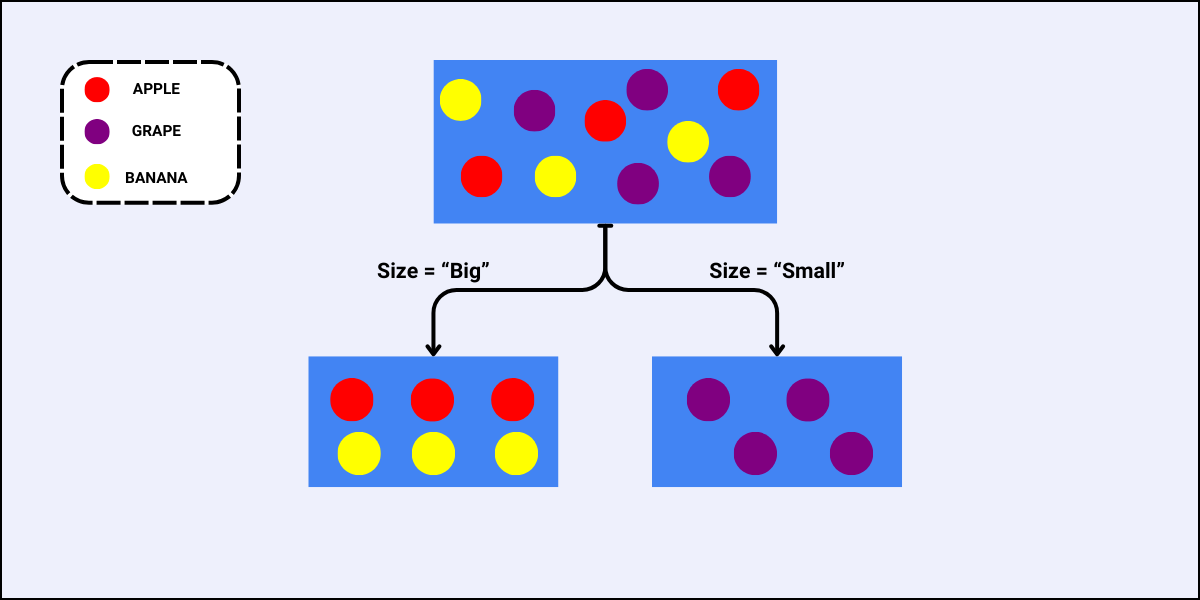
Since the Gini Split for the feature “Size” is less, this is the best feature to select for this split.
What is Entropy?
Entropy is another measure of impurity, and it is used to quantify the state of disorder, randomness, or uncertainty within a set of data. In the context of decision trees, like the Gini Index, it helps in determining how a node should be split to result in sub-nodes that are as pure (homogenous) as possible.
Give it a read too: Random Forest Algorithm
Formula and Calculation
The Entropy of a node is calculated using the formula:
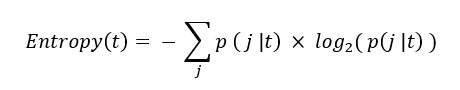
where p( j | t ) is the relative frequency of class j at node t.
- The maximum value is log2(n) which indicates high uncertainty i.e., n classes are equally distributed.
- The minimum value is 0 which indicates low uncertainty i.e., all records belong to a single class.
Explore the Key Boosting Algorithms in ML and Their Applications
Example
Using the same dataset and table as discussed in the example of the Gini Index, we can calculate the Entropy (impurity) of the root node as:
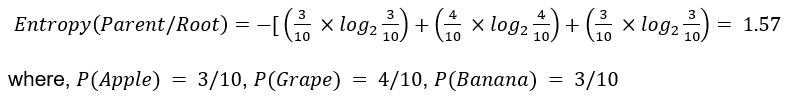
This result is the same as the results obtained in the Gini Index example i.e., the root node has maximum impurity.
Information Gain
Information Gain’s objective is similar to that of the Gini Split – it aims to determine the best feature for splitting the data at each node. It does this by calculating the reduction in entropy after a node is split into sub-nodes using a particular feature. The feature with the highest information gain is chosen for the node.
Formula and Calculation
The Information Gain is calculated using the formula:
Information Gain = Entropy(Parent Node) – Average Entropy(Children)
where
![]()
- ni represents the number of records at child/sub-node i.
- n represents the number of records at the parent node.
Another useful read: 9 Important Plots in Data Science
Example
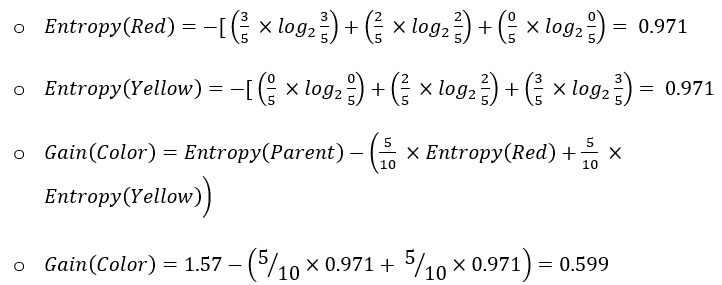
Using the same dataset, we will determine which feature to use to perform the next split:
- For the feature “Color”
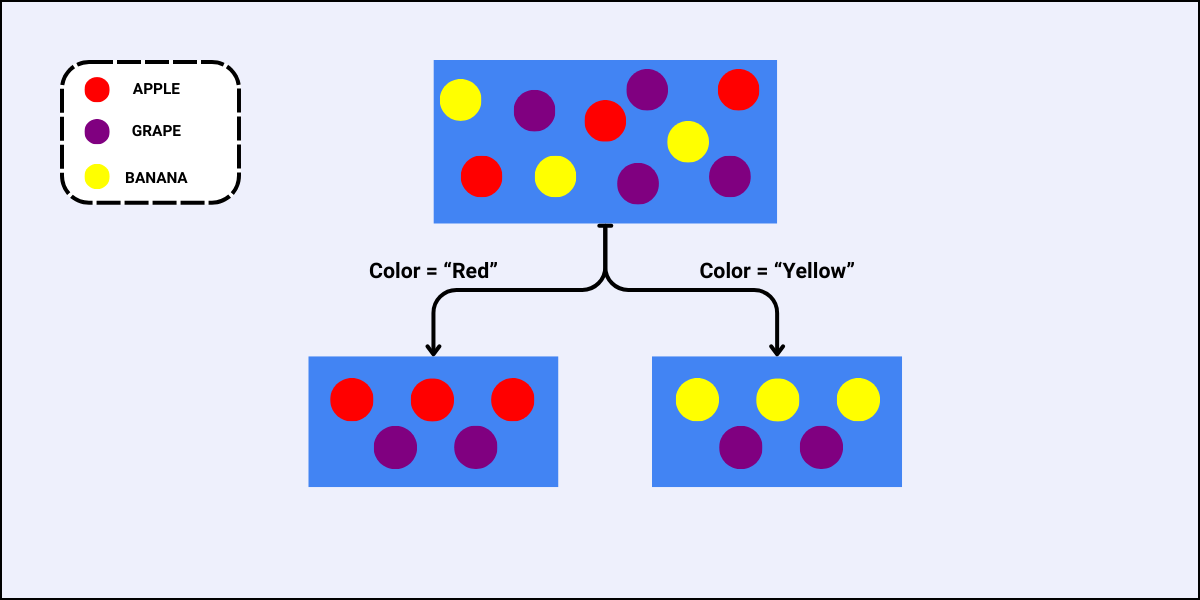
- For feature “Size”:
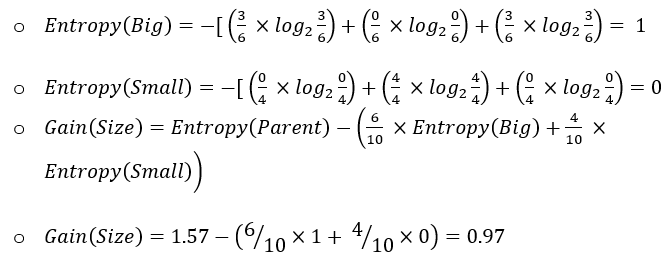

Since the Information Gain of the split using the feature “Size” is high, this feature is the best to select at this node to perform splitting.
Gini Index vs. Entropy
Both metrics are used to determine the best splits in decision trees, but they have some differences:
- The Gini Index is computationally simpler and faster to calculate because it is a linear metric.
- Entropy considers the distribution of data more comprehensively, but it can be more computationally intensive because it is a logarithmic measure.
Use Cases
- The Gini Index is often preferred in practical implementations of decision trees due to its simplicity and speed.
- Entropy is more commonly used in theoretical discussions and algorithms like C4.5 and ID3.

Applications in Machine Learning
Decision Trees
Gini Index and Entropy are used widely in decision tree algorithms to select the best feature for splitting the data at each node/level of the decision tree. This helps improve accuracy by selecting and creating more homogeneous and pure sub-nodes.
Random Forests
Random forest algorithms, which are ensembles of decision trees, also use these metrics to improve accuracy and reduce overfitting by determining optimal splits across different trees.
Feature Selection
Both metrics also help in feature selection as they help identify features that provide the most impurity reduction, or in other words, the most information gain, which leads to more efficient and effective models.
Learn more about the different Ensemble Methods in Machine Learning
Practical Examples
- Spam Detection
- Customer Segmentation
- Medical Diagnosis
- And many more
The Final Word
Understanding the Gini Index and Entropy metrics is crucial for data scientists and anyone working with decision trees and related algorithms in machine learning. These metrics provide aid in creating splits that lead to more accurate and efficient models by selecting the optimal feature for splitting at each node.

While the Gini Index is often preferred in practice due to its simplicity and speed, Entropy provides a more detailed understanding of the data distribution. Choosing the appropriate metric depends on the specific requirements and details of your problem and machine learning task.