

Probability or statistical likelihood is a fundamental concept in data science. It provides a framework for understanding and analyzing uncertainty, which is an essential aspect of many real-world problems. In this blog, we will discuss the importance of probability in data science, its applications, and how it can be used to make data-driven decisions.

What is Probability?
It is a measure of the likelihood of an event occurring. It is expressed as a number between 0 and 1, with 0 indicating that the event is impossible and 1 indicating that the event is certain. For example, the Statistical likelihood of rolling a six on a fair die is 1/6 or approximately 0.17.
In data science, it is used to quantify the uncertainty associated with data. It helps data scientists to make informed decisions by providing a way to model and analyze the variability of data. It is also used to build models that can predict future events or outcomes based on past data.
Applications of Probability in Data Science
There are many applications of probability in data science, some of which are discussed below:
1. Statistical Inference
Statistical inference allows data scientists to make conclusions about a population from a sample. Using probability, it helps quantify uncertainty in estimates and test hypotheses. For example, in market research, probability helps determine how accurately survey results reflect customer preferences, guiding decisions in marketing and policy.
2. Machine Learning
In machine learning, probability helps algorithms make predictions based on past data. Classification models, like Naive Bayes, use probability to predict the likelihood of a new observation belonging to a specific class. It is also used in regression and decision trees to handle uncertainty and identify patterns for predicting future outcomes.
3. Bayesian Analysis
Bayesian analysis uses statistical likelihood to update beliefs based on new data. Unlike traditional methods, it incorporates prior knowledge, refining predictions over time. In healthcare, for example, Bayesian models can adjust the probability of a patient having a condition as more test results come in, making real-time decision-making possible.
4. Risk Assessment
Probability is crucial in assessing risks in industries such as finance and healthcare. By estimating the likelihood of events like loan defaults or disease outbreaks, organizations can make informed decisions to mitigate potential losses. For example, insurance companies use probability to determine the risk of insuring a policyholder based on their health or lifestyle.
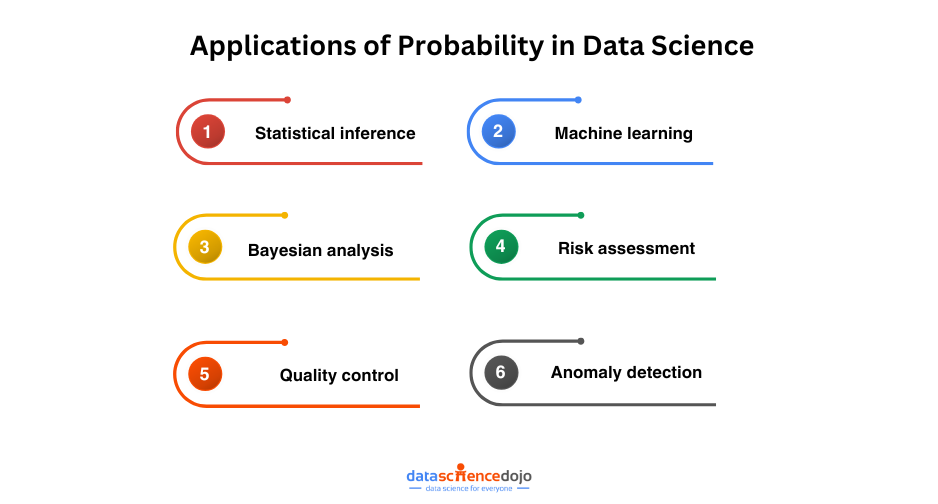
5. Quality Control
In manufacturing, it helps ensure product quality. Statistical process control (SPC) uses probability to monitor production and detect deviations from expected behavior. By modeling defect rates and variability, manufacturers can improve product consistency and reduce waste, ensuring high-quality output.
6. Anomaly Detection
Probability is key in identifying anomalies or outliers in data. By modeling normal behavior, data scientists can flag unusual patterns, such as fraudulent transactions or cybersecurity breaches. Anomaly detection also helps predict equipment failures, allowing organizations to address issues before they escalate.
Key Probability Distributions in Data Science
Distributions are foundational for modeling data and uncertainty in data science. Understanding different types of distributions is essential for selecting the right statistical tools and constructing effective models. Below are some of the most important types of distributions:
-
Normal Distribution: Often referred to as the bell curve, this is one of the most commonly used models in statistical analysis. It is widely applied in hypothesis testing, machine learning, and various statistical procedures. The normal distribution is crucial for modeling continuous data that tends to cluster around a mean.
-
Binomial Distribution: This distribution is valuable for scenarios involving binary outcomes, such as success or failure. For example, it can predict the likelihood of a customer purchasing a product, based on prior behavior or marketing interventions. It is particularly useful when there are a fixed number of trials and each trial has two possible outcomes.
-
Poisson Distribution: Often used to model the frequency of rare events occurring over a specified time or space, the Poisson distribution is ideal for scenarios like predicting the number of customer complaints or system failures. It helps estimate how often events will happen based on their average rate of occurrence.
-
Exponential Distribution: Typically applied in reliability analysis and queueing theory, this distribution models the time between events in a Poisson process. It is commonly used in fields like telecommunications to predict the time between customer arrivals in a service line or the expected lifespan of a machine.
Advanced Probability Concepts in Data Science
1. Conditional Probability
Conditional probability focuses on the likelihood of an event occurring given that another has already taken place. This is essential in data science for building more accurate models and making refined predictions.
For instance, in insurance, understanding the likelihood of an individual being able to pay premiums based on their financial obligations, such as a house loan, can help improve risk assessment models. By considering these interdependencies, data scientists can create more reliable predictions that adjust for existing conditions, resulting in better decision-making and more personalized services.
2. Rare Event Analysis
While rare events occur infrequently, they often hold great significance in large datasets. Identifying and understanding these low-probability occurrences is crucial in fields such as anomaly detection and fraud prevention.
For example, in financial transactions, detecting rare fraudulent activities, though infrequent, can have a major impact on a business. Techniques designed to analyze such events help highlight outliers and abnormal patterns that could indicate risks or opportunities that would otherwise go unnoticed. By focusing on these rare cases, organizations can proactively mitigate potential threats and optimize their processes.
How Probability Helps in Making Data-Driven Decisions
It help data scientists to make data-driven decisions by providing a way to quantify the uncertainty associated with data. By using to model and analyze data, data scientists can:
- Estimate the likelihood of future events or outcomes based on past data.
- Assess the risk associated with a particular decision or action.
- Identify patterns and relationships in data.
- Make predictions about future trends or behavior.
- Evaluate the effectiveness of different strategies or interventions.

Practical Applications of Probability
In data science and various industries, probability helps quantify uncertainty and guide decision-making. Below are two key applications of probability that play a significant role in predictive modeling and risk management.
1. Monte Carlo Simulations
Monte Carlo simulations use random sampling to estimate complex probabilities. By simulating many possible scenarios, these methods predict outcomes in uncertain environments.
They’re widely applied in finance to assess investment risks, in engineering for reliability studies, and in risk management for predicting adverse events. When exact solutions are difficult to calculate, Monte Carlo simulations provide valuable insights through simulation-based estimates.
2. Bayesian Networks
Bayesian networks are graphical models that show how variables are probabilistically related. They help decision-making by illustrating how uncertainty in one factor affects others.
As new data comes in, these networks update the probabilities to refine predictions. They’re commonly used in healthcare to predict disease likelihood or in machine learning to improve model accuracy, making them essential tools for adaptive, data-driven decision-making.
Bayes’ Theorem and its Relevance in Data Science
Bayes’ theorem, also known as Bayes’ rule or Bayes’ law, is a fundamental concept in probability theory that has significant relevance in data science. It is named after Reverend Thomas Bayes, an 18th-century British statistician and theologian, who first formulated the theorem.
At its core, Bayes’ theorem provides a way to calculate the probability of an event based on prior knowledge or information about related events. It is commonly used in statistical inference and decision-making, especially in cases where new data or evidence becomes available.
The theorem is expressed mathematically as follows:
P(A|B) = P(B|A) * P(A) / P(B)
Where:
- P(A|B) is the probability of event A occurring given that event B has occurred.
- P(B|A) is the probability of event B occurring given that event A has occurred.
- P(A) is the prior probability of event A occurring.
- P(B) is the prior probability of event B occurring.
In data science, Bayes’ theorem is used to update the probability of a hypothesis or belief in light of new evidence or data. This is done by multiplying the prior probability of the hypothesis by the likelihood of the new evidence given that hypothesis.
Master Naive Bayes for powerful data analysis. Read this blog to understand valuable insights from your data!
For example, let’s say we have a medical test that can detect a certain disease, and we know that the test has a 95% accuracy rate (i.e., it correctly identifies 95% of people with the disease and 5% of people without it). We also know that the prevalence of the disease in the population is 1%. If we administer the test to a person and they test positive, we can use Bayes’ theorem to calculate the probability that they actually have the disease.
In conclusion, Bayes’ theorem is a powerful tool for probabilistic inference and decision-making in data science. Incorporating prior knowledge and updating it with new evidence, it enables more accurate and informed predictions and decisions.
Common Mistakes to Avoid in Probability Analysis
Probability analysis is an essential aspect of data science, providing a framework for making informed predictions and decisions based on uncertain events. However, even the most experienced data scientists can make mistakes when applying probability analysis to real-world problems. In this article, we’ll explore some common mistakes to avoid:
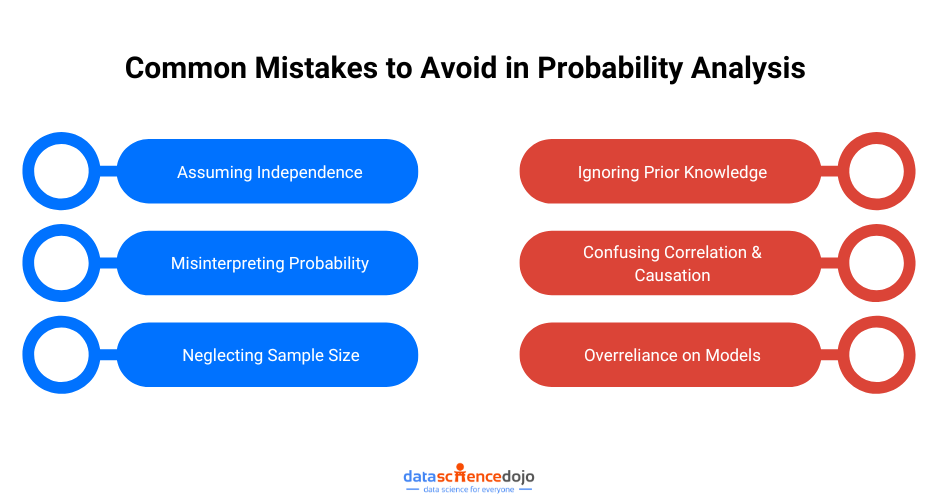
1. Assuming Independence
One of the most common mistakes in probability analysis is assuming that events are independent when they are not. Independence means that the occurrence of one event does not affect the likelihood of the other event. However, in many real-world situations, this assumption is false.
For instance, in a medical study, one might assume that the likelihood of developing a certain condition is independent of factors like age, gender, or family history. In reality, these factors are often highly correlated and can significantly influence the probability of developing the condition.
Neglecting such dependencies can result in misleading conclusions, as the model will underestimate or overestimate the actual risk. To avoid this mistake, data scientists should carefully examine the relationships between variables and consider using methods that account for these dependencies, such as conditional probability or correlation analysis.
2. Misinterpreting Probability
A frequent mistake in probability analysis is the misinterpretation of what a specific probability value means. For example, a probability of 0.5 does not indicate certainty that an event will happen—it only signifies that there is an equal chance of the event happening or not happening. This is often misunderstood in the context of decision-making or risk assessment.
Misunderstanding this concept can lead to flawed decision-making, especially in high-stakes environments like finance or healthcare. Data scientists must ensure that they accurately communicate the true meaning of probability values to stakeholders and be aware of how probability values are used in real-world predictions.
3. Neglecting Sample Size
Sample size plays a crucial role in the accuracy and reliability of probability analysis. Small sample sizes can lead to statistical anomalies and skewed results, while excessively large sample sizes can be inefficient and unnecessarily resource-intensive.
For example, a small sample might not accurately represent the broader population, leading to overconfidence in predictions or misrepresentations of trends. Conversely, a very large sample size may not provide additional insights and can make analysis overly complex without yielding meaningful improvements in accuracy.
Choosing the right sample size is a delicate balance that depends on the context and the desired level of precision. Power analysis and consideration of effect size are tools that can help data scientists determine the optimal sample size for a given problem.
4. Confusing Correlation and Causation
A common pitfall in data analysis is confusing correlation with causation. While two events may appear to be correlated—meaning they occur together—it doesn’t necessarily mean that one causes the other.
For example, there might be a correlation between the number of ice cream sales and the number of drownings in summer, but this doesn’t mean that buying ice cream causes drowning incidents. The correlation is more likely due to a third factor, such as warmer weather.
This misunderstanding can lead to incorrect conclusions and flawed recommendations. Establishing causality requires more rigorous analysis, such as controlled experiments or the use of statistical techniques like regression analysis, instrumental variables, or randomized controlled trials. Causality is more difficult to prove and often requires a deep understanding of the underlying system or domain.
5. Ignoring Prior Knowledge
In Bayesian probability analysis, prior knowledge plays a vital role in shaping the probability of an event. The prior reflects what is already known or assumed about a system before observing the data. Failing to incorporate this prior information—or neglecting to update it with new evidence—can lead to inaccurate predictions and decisions.
For instance, when estimating the likelihood of a disease based on test results, prior knowledge about the prevalence of the disease in the population is essential. If prior knowledge is ignored, the posterior probability of the disease could be biased or misleading. Data scientists must recognize the importance of updating beliefs based on new data and use appropriate methods to integrate prior information effectively, such as Bayesian updating.
6. Overreliance on Models
While probabilistic models can be powerful tools for analysis and prediction, they are not foolproof. An overreliance on models can lead to false confidence in their predictions, especially if the assumptions behind the model are flawed or if the model is applied to an inappropriate context. Every model has limitations, and its accuracy depends on the quality of the data, the assumptions made, and the methods used to build it.
For example, a machine learning model trained on biased or incomplete data may produce biased predictions, or it may overfit to the training data, leading to poor generalization to new data. Data scientists should always be mindful of the assumptions underlying their models, validate their predictions, and consider using multiple models or techniques to cross-check results.
Additionally, it’s important to communicate the limitations of models to stakeholders and avoid presenting them as infallible tools.
Conclusion
Statistical likelihood is a crucial tool for data scientists, providing a framework to quantify uncertainty and make informed decisions. By understanding and applying probabilistic methods, data scientists can build more accurate models, predict outcomes, and deliver reliable insights. As data-driven decision-making continues to grow across industries, the ability to effectively apply probabilities will be essential for success. Mastering this skill empowers data scientists to navigate uncertainty and drive impactful, data-backed results in a variety of fields.
