For a hands-on learning experience to develop LLM applications, join our LLM Bootcamp today.
First 6 seats get an early bird discount of 30%! So hurry up!

In the world of machine learning, evaluating the performance of a model is just as important as building the model itself. One of the most fundamental tools for this purpose is the confusion matrix. This powerful yet simple concept helps data scientists and machine learning practitioners assess the accuracy of classification algorithms, providing insights into how well a model is performing in predicting various classes.

In this blog, we will explore the concept of a confusion matrix using a spam email example. We highlight the 4 key metrics you must understand and work on while working with a confusion matrix.


llm bootcamp banner


What is a Confusion Matrix?

A confusion matrix is a table that is used to describe the performance of a classification model. It compares the actual target values with those predicted by the model. This comparison is done across all classes in the dataset, giving a detailed breakdown of how well the model is performing. 

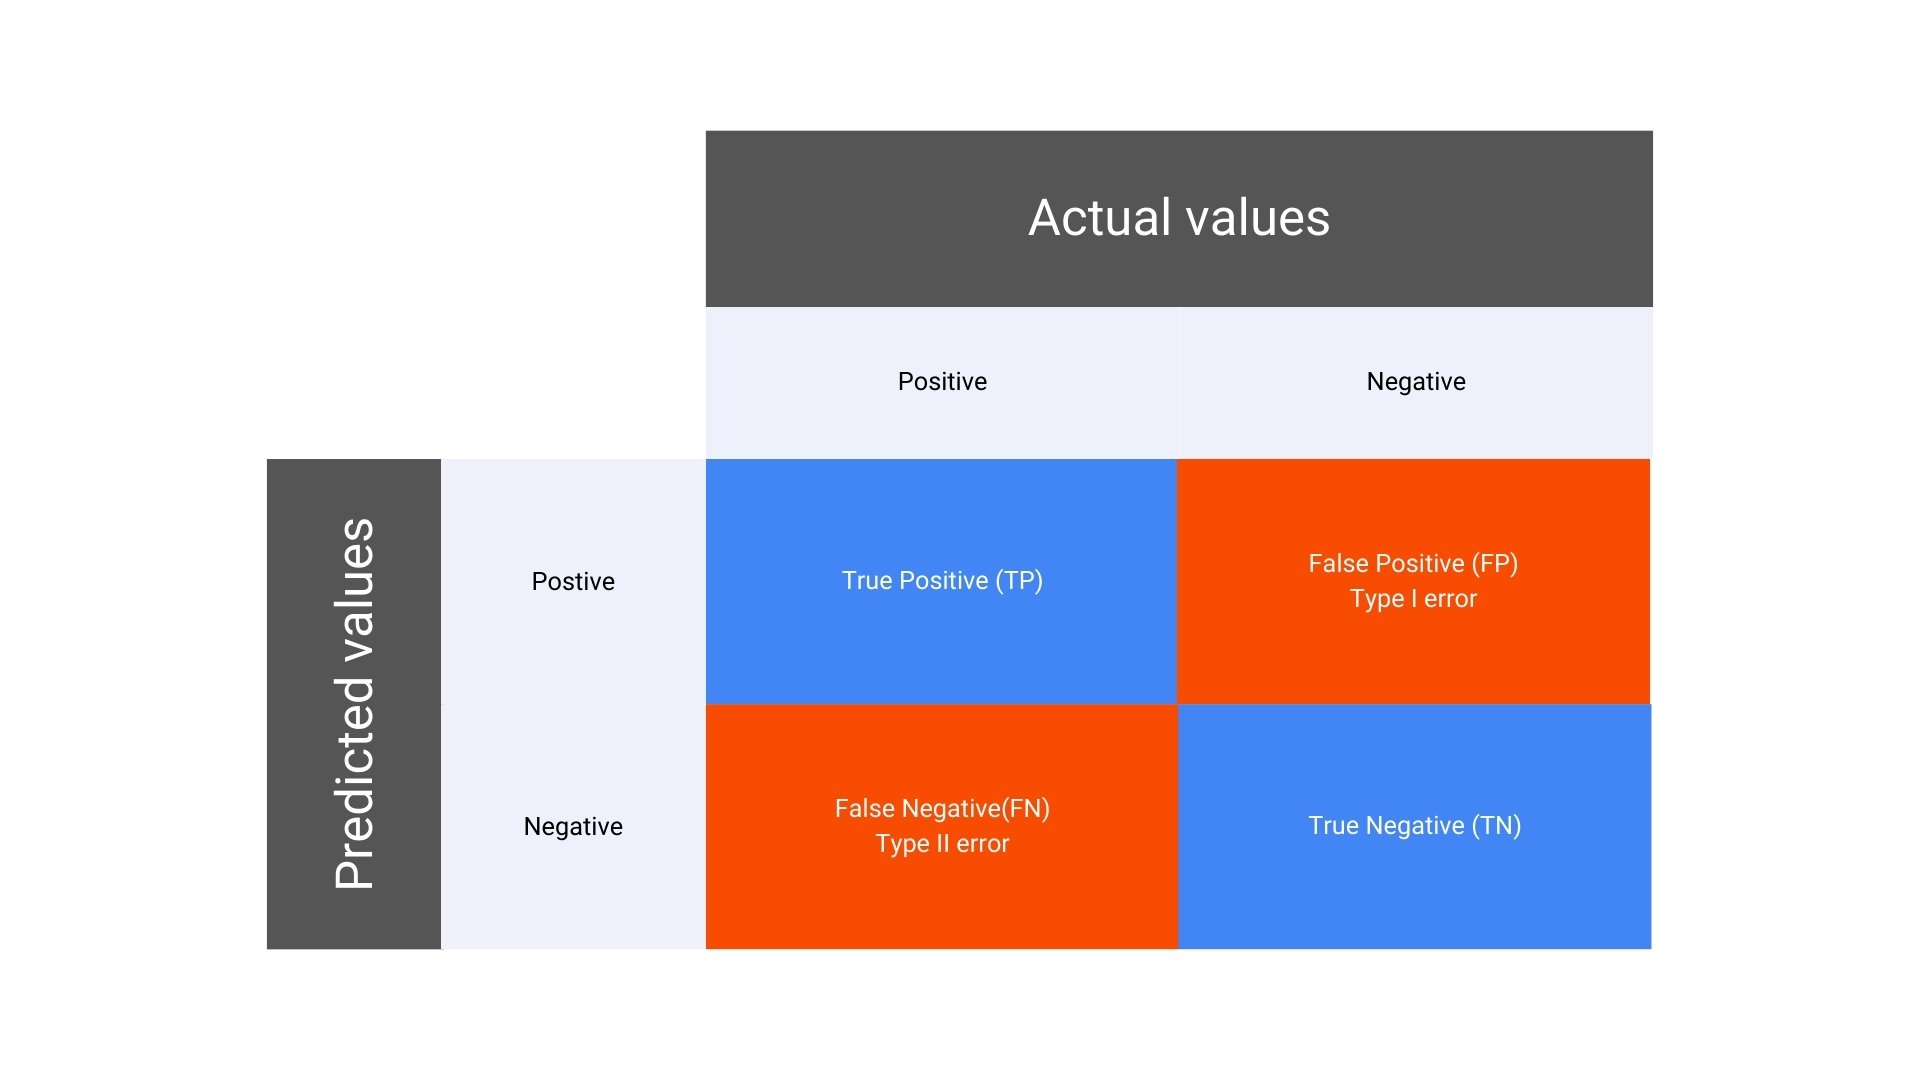
Here’s a simple layout of a confusion matrix for a binary classification problem:
confusion matrix

In a binary classification problem, the confusion matrix consists of four key components: 

  1. True Positive (TP): The number of instances where the model correctly predicted the positive class. 
  2. False Positive (FP): The number of instances where the model incorrectly predicted the positive class when it was actually negative. Also known as Type I error. 
  3. False Negative (FN): The number of instances where the model incorrectly predicted the negative class when it was actually positive. Also known as Type II error. 
  4. True Negative (TN): The number of instances where the model correctly predicted the negative class.

Why is the Confusion Matrix Important?

The confusion matrix provides a more nuanced view of a model’s performance than a single accuracy score. It allows you to see not just how many predictions were correct, but also where the model is making errors, and what kind of errors are occurring. This information is critical for improving model performance, especially in cases where certain types of errors are more costly than others. 

For example, in medical diagnosis, a false negative (where the model fails to identify a disease) could be far more serious than a false positive. In such cases, the confusion matrix helps in understanding these errors and guiding the development of models that minimize the most critical types of errors.


Also learn about the Random Forest Algorithm and its uses in ML


Scenario: Email Spam Classification

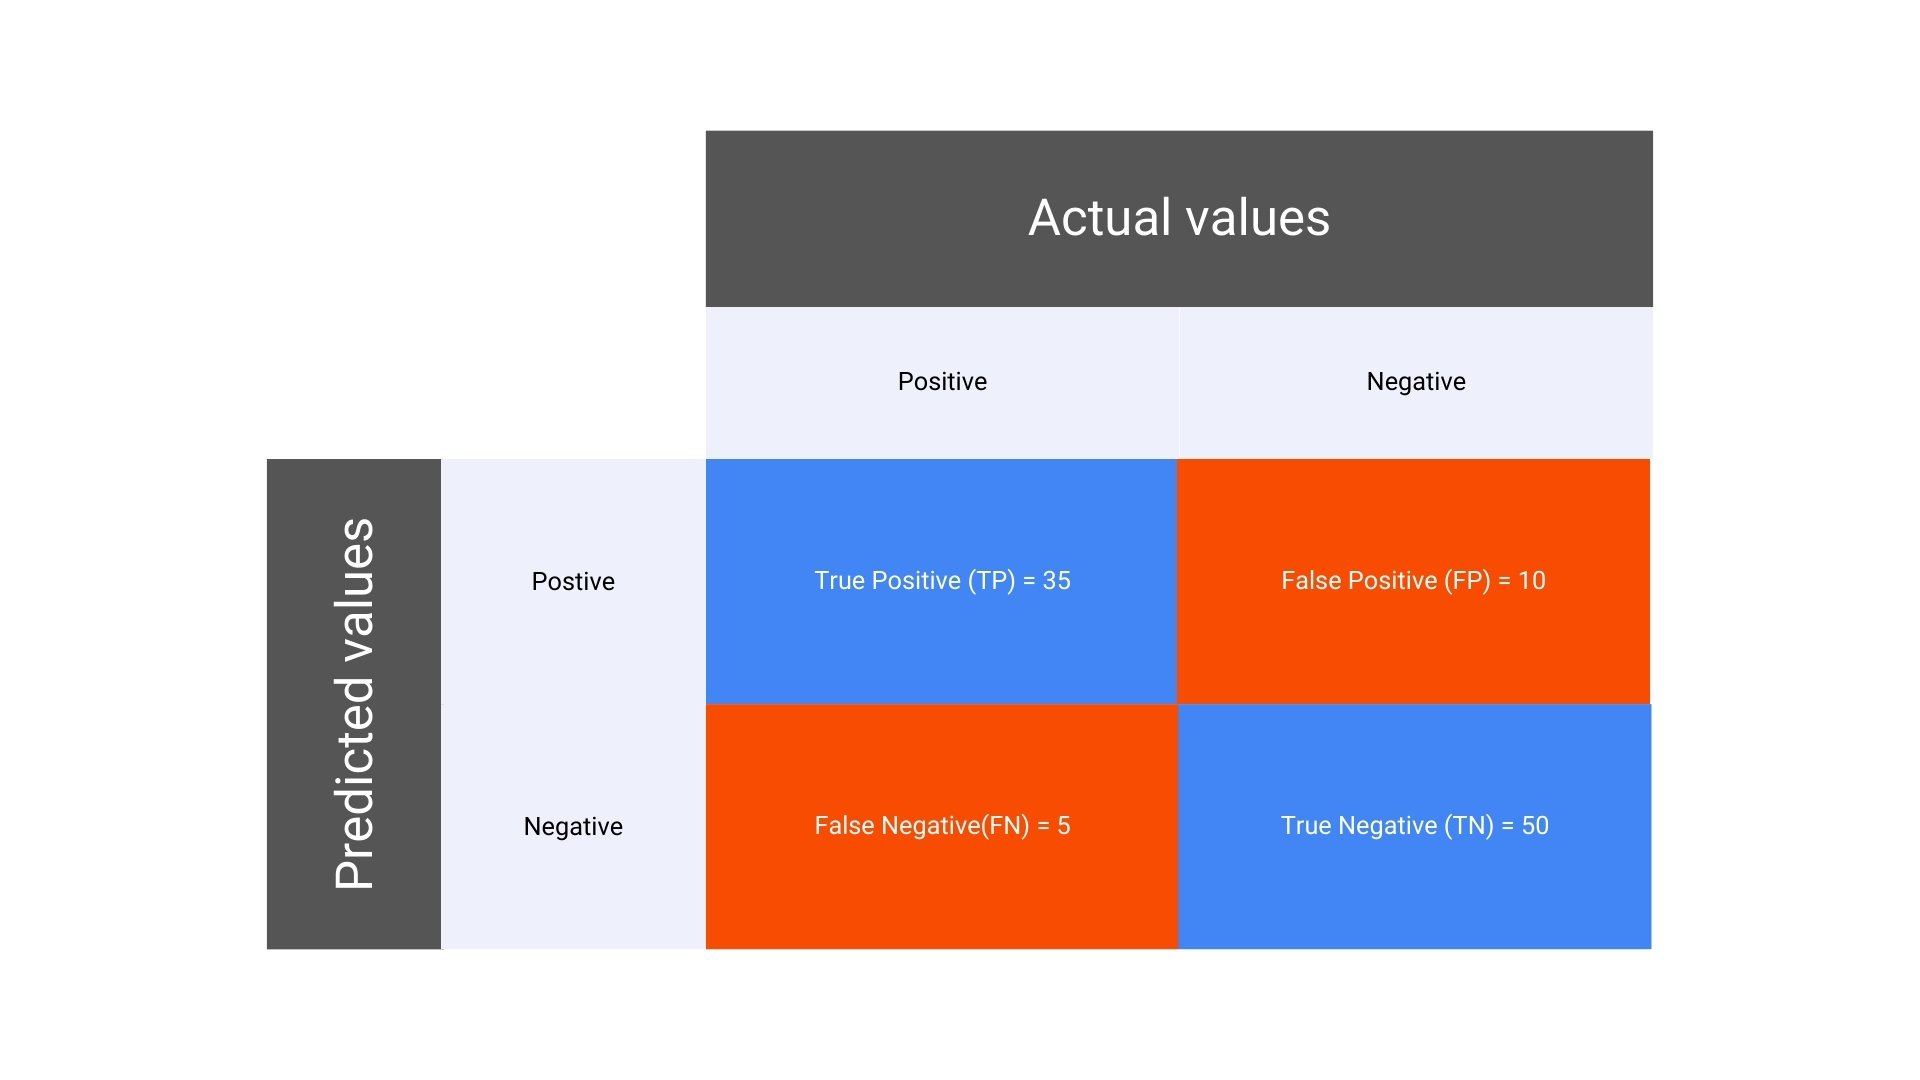
Suppose you have built a machine learning model to classify emails as either “Spam” or “Not Spam.” You test your model on a dataset of 100 emails, and the actual and predicted classifications are compared. Here’s how the results could break down: 

  • Total emails: 100 
  • Actual Spam emails: 40 
  • Actual Not Spam emails: 60

After running your model, the results are as follows: 

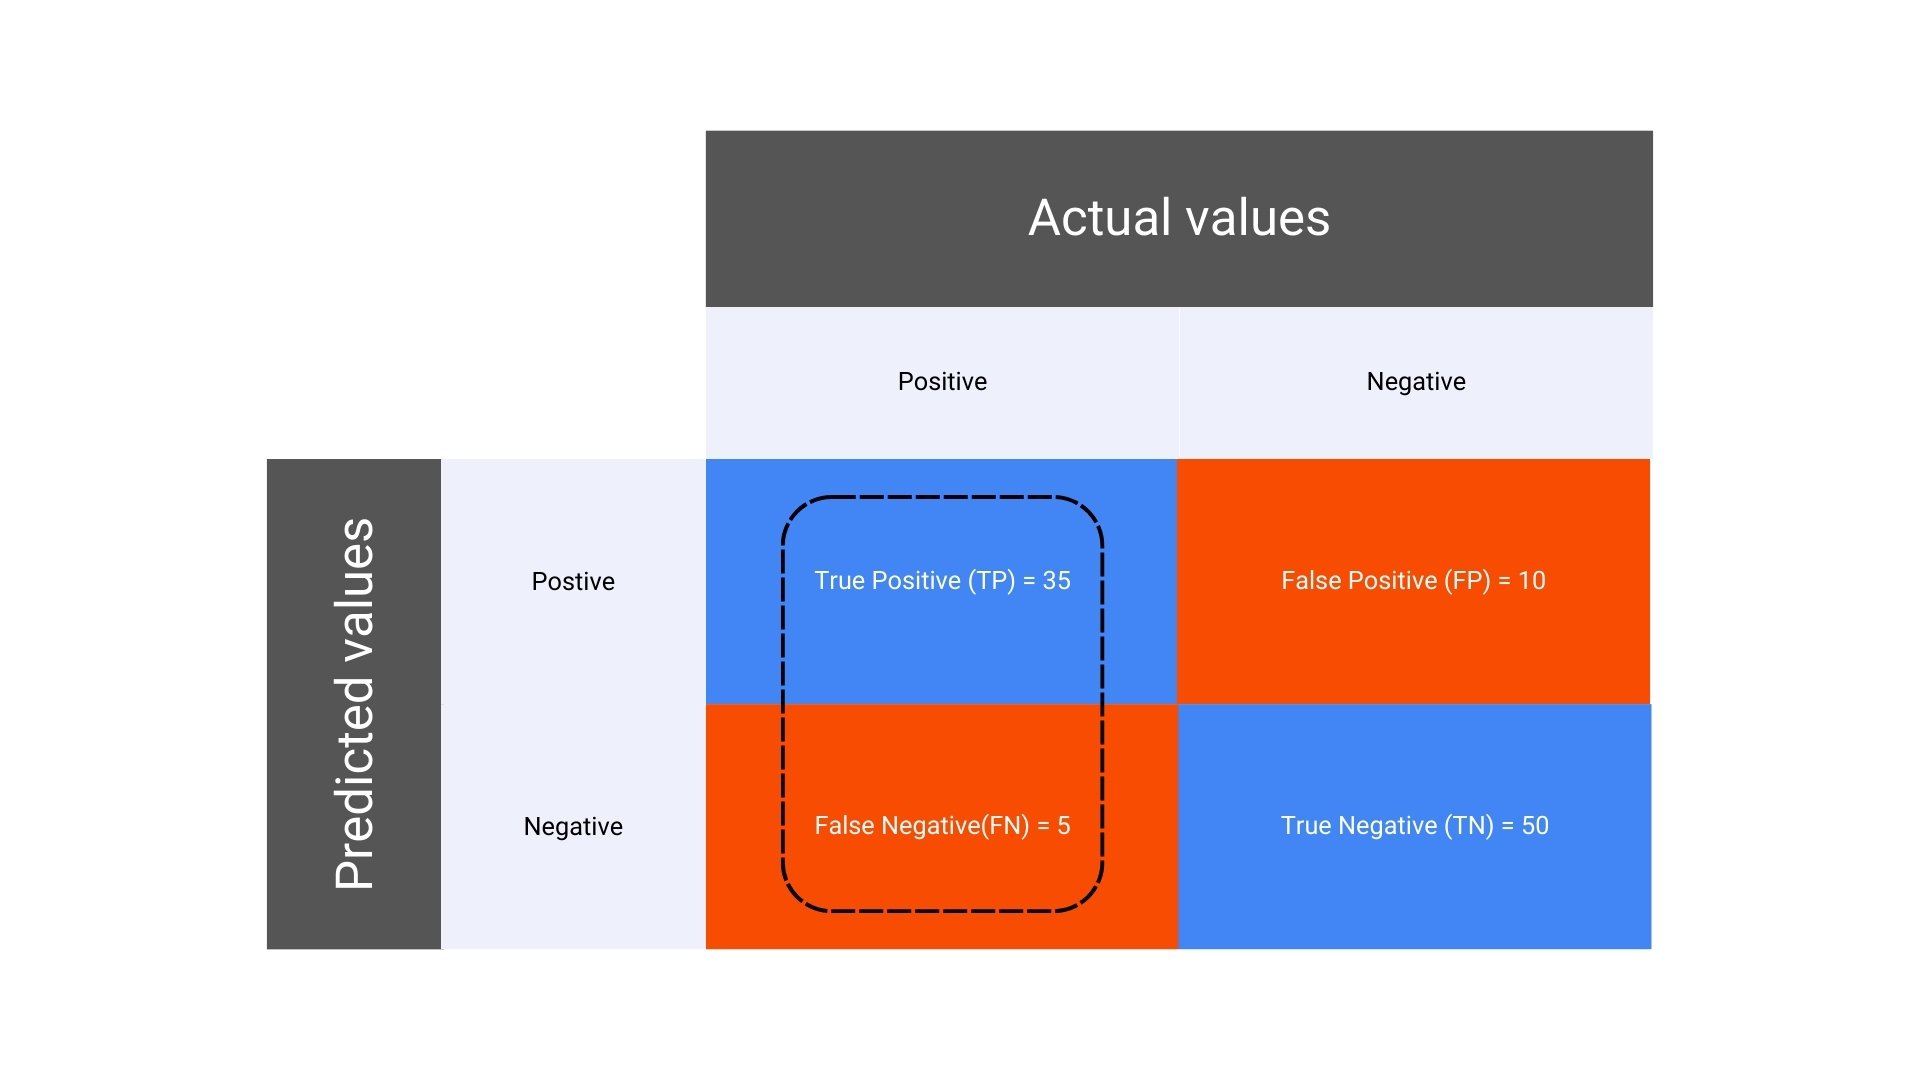
  • Correctly predicted Spam emails (True Positives, TP): 35
  • Incorrectly predicted Spam emails (False Positives, FP): 10
  • Incorrectly predicted Not Spam emails (False Negatives, FN): 5
  • Correctly predicted Not Spam emails (True Negatives, TN): 50
confusion matrix example

Understanding 4 Key Metrics Derived from the Confusion Matrix

The confusion matrix serves as the foundation for several important metrics that are used to evaluate the performance of a classification model. These include:

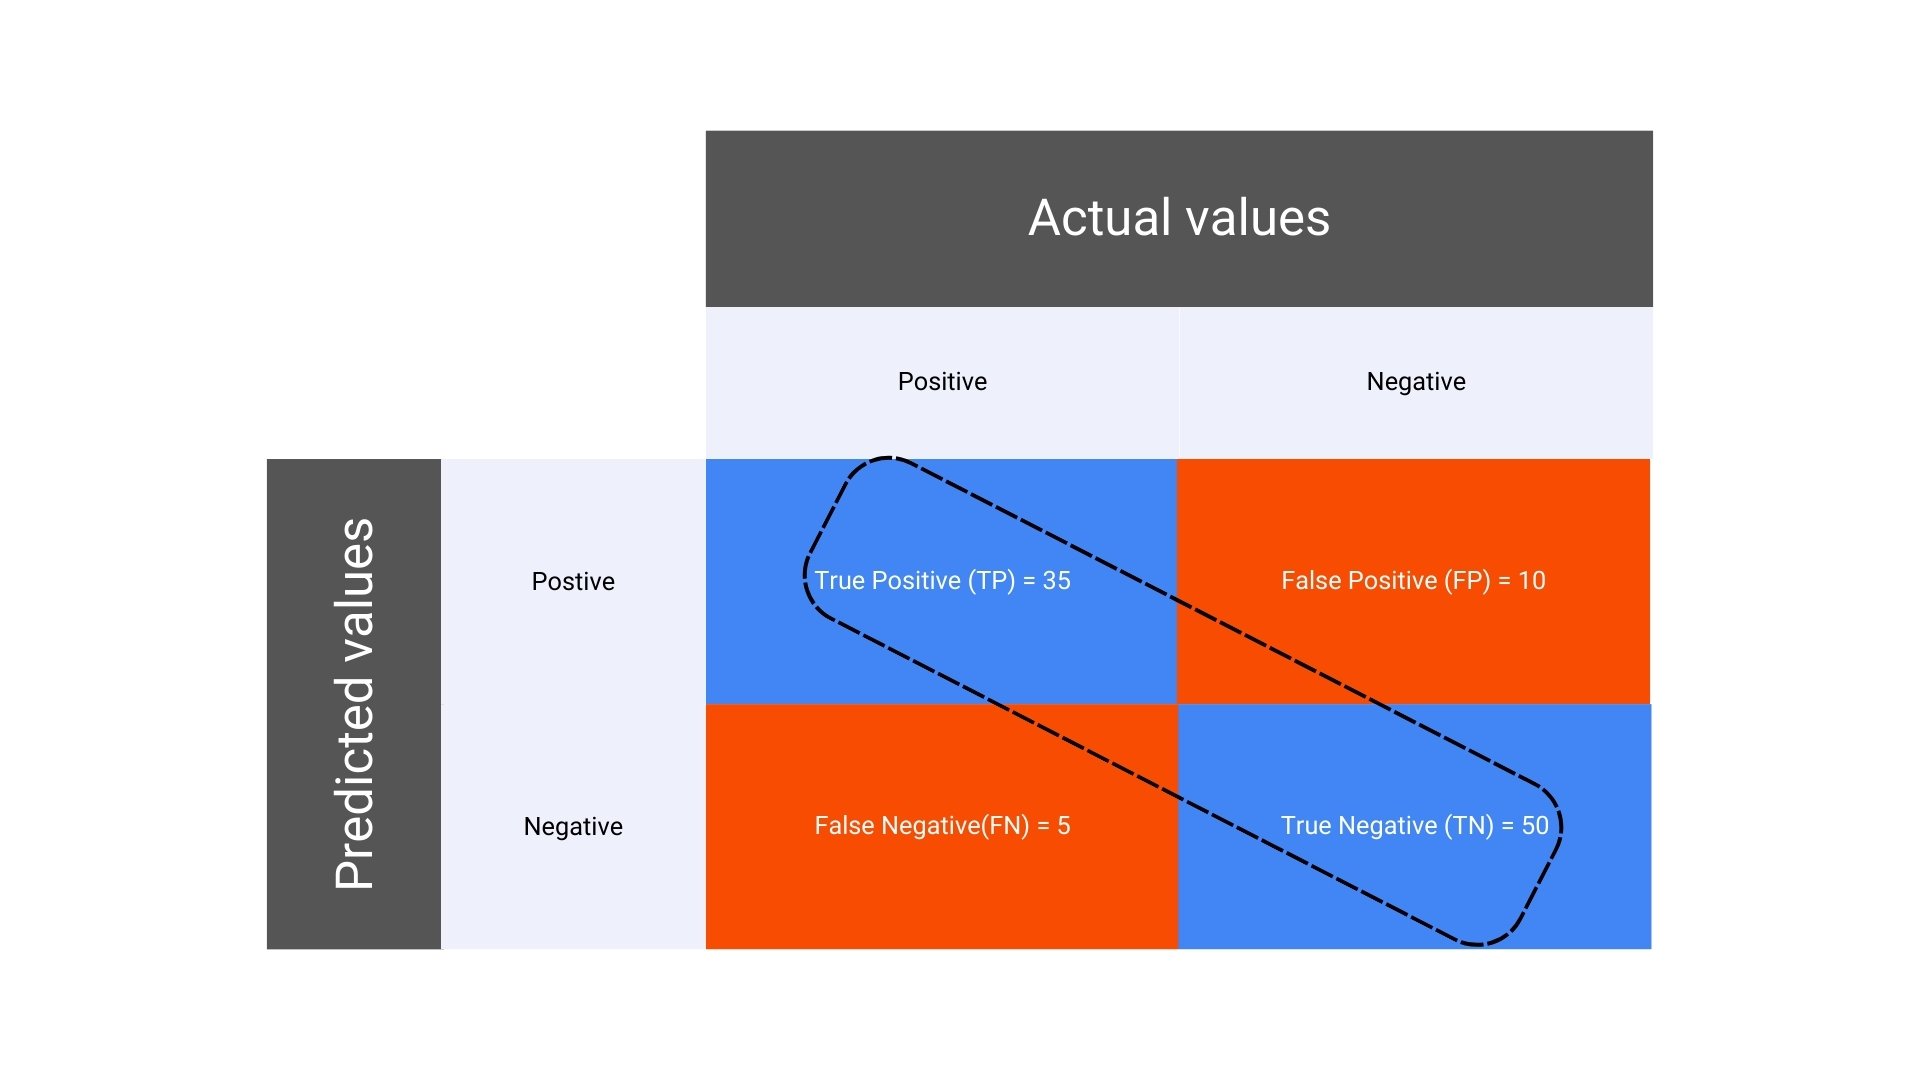
1. Accuracy
accuracy in confusion matrix

  • Formula for Accuracy in a Confusion Matrix:

Blog | Data Science Dojo

Explanation: Accuracy measures the overall correctness of the model by dividing the sum of true positives and true negatives by the total number of predictions.

  • Calculation for accuracy in the given confusion matrix:

Blog | Data Science Dojo

This equates to = 0.85 (or 85%). It means that the model correctly predicted 85% of the emails.

2. Precision
precision in confusion matrix

  • Formula for Precision in a Confusion Matrix:

Blog | Data Science Dojo

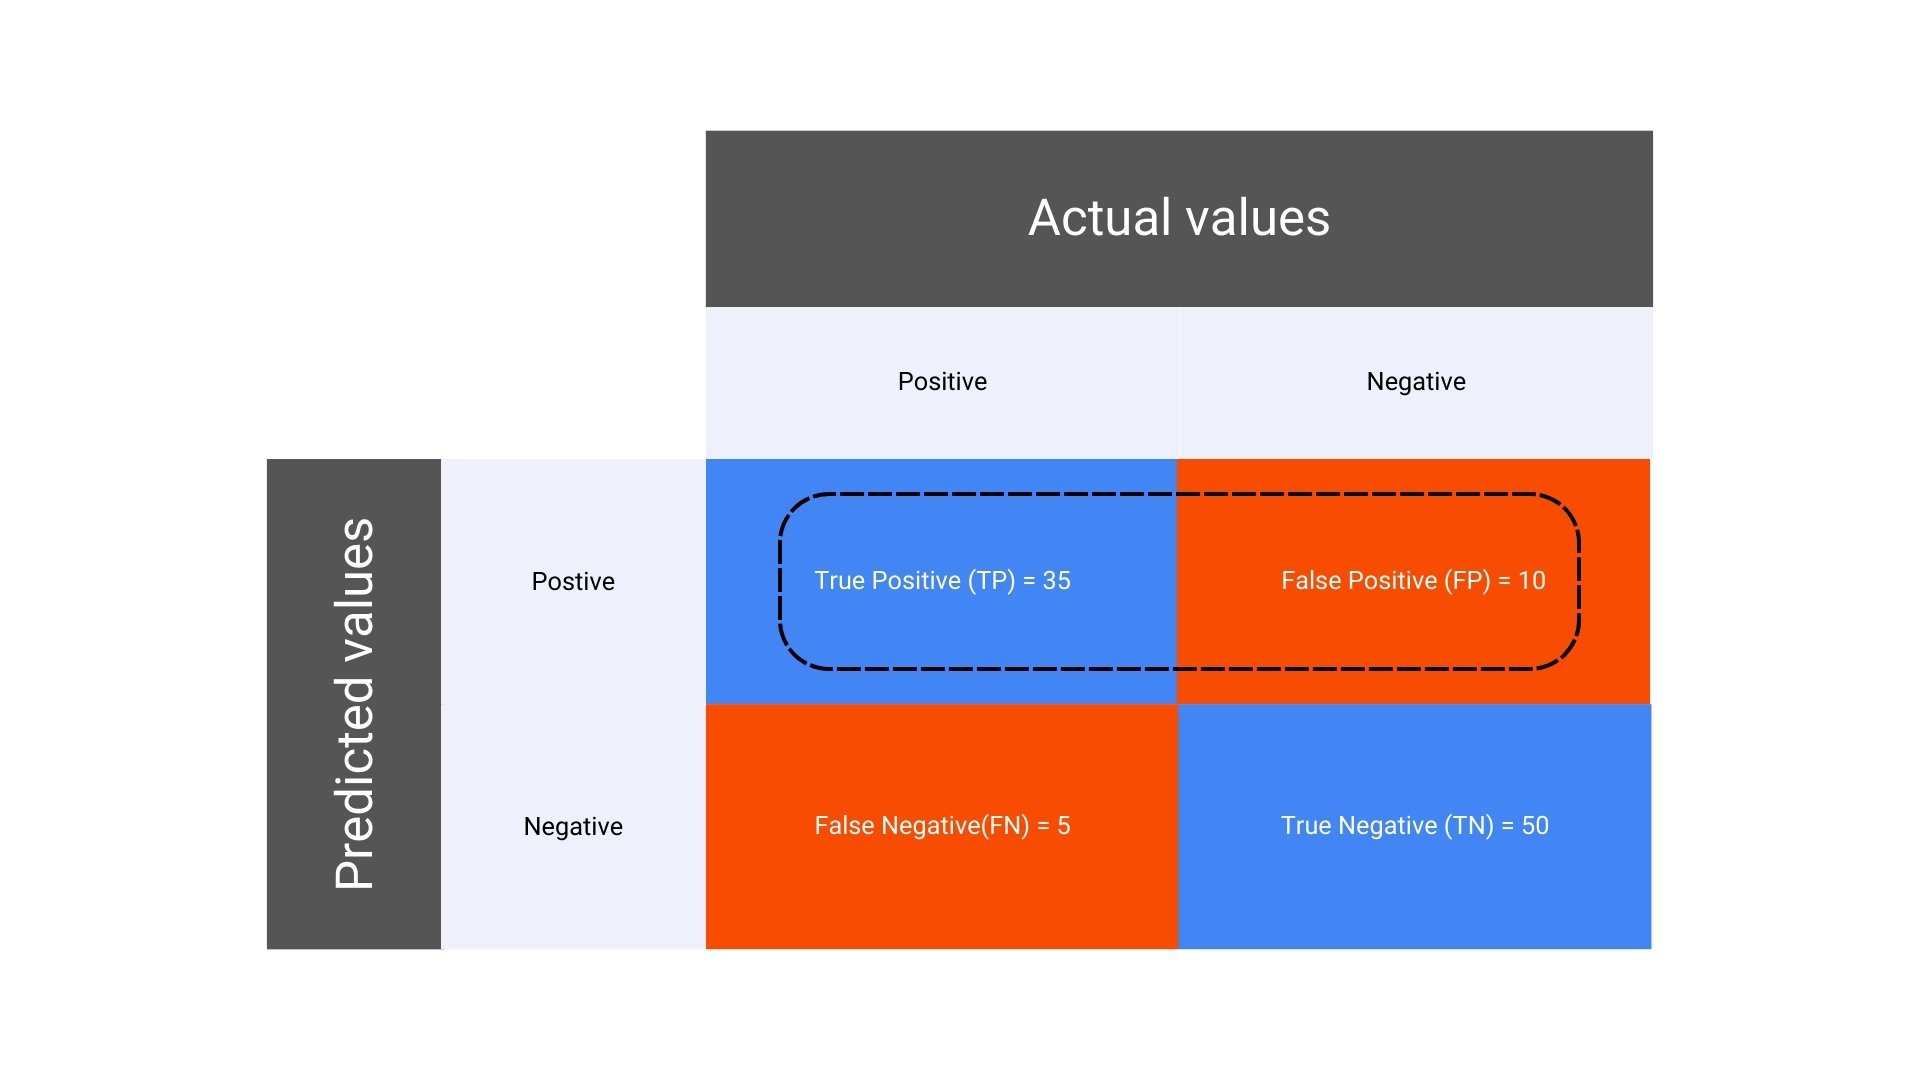
Explanation: Precision (also known as positive predictive value) is the ratio of correctly predicted positive observations to the total predicted positives.

It answers the question: Of all the positive predictions, how many were actually correct?

  • Calculation for precision of the given confusion matrix

Blog | Data Science Dojo

It equates to ≈ 0.78 (or 78%) which highlights that of all the emails predicted as Spam, 78% were actually Spam.


How generative AI and LLMs work


3. Recall (Sensitivity or True Positive Rate)
Recall in confusion matrix

  • Formula for Recall in a Confusion Matrix

Blog | Data Science Dojo

Explanation: Recall measures the model’s ability to correctly identify all positive instances. It answers the question: Of all the actual positives, how many did the model correctly predict?

  • Calculation for recall in the given confusion matrix

Blog | Data Science Dojo

It equates to = 0.875 (or 87.5%), highlighting that the model correctly identified 87.5% of the actual Spam emails.

4. F1 Score

  • F1 Score Formula:

Blog | Data Science Dojo

Explanation: The F1 score is the harmonic mean of precision and recall. It is especially useful when the class distribution is imbalanced, as it balances the two metrics.

  • F1 Calculation:

Blog | Data Science Dojo

This calculation equates to ≈ 0.82 (or 82%). It indicates that the F1 score balances Precision and Recall, providing a single metric for performance.


Understand the basics of Binomial Distribution and its importance in ML


Interpreting the Key Metrics

  • High Recall: The model is good at identifying actual Spam emails (high Recall of 87.5%). 
  • Moderate Precision: However, it also incorrectly labels some Not Spam emails as Spam (Precision of 78%). 
  • Balanced Accuracy: The overall accuracy is 85%, meaning the model performs well, but there is room for improvement in reducing false positives and false negatives. 
  • Solid F1 Score: The F1 Score of 82% reflects a good balance between Precision and Recall, meaning the model is reasonably effective at identifying true positives without generating too many false positives. This balanced metric is particularly valuable in evaluating the model’s performance in situations where both false positives and false negatives are important.


Explore a hands-on curriculum that helps you build custom LLM applications!


Conclusion

The confusion matrix is an indispensable tool in the evaluation of classification models. By breaking down the performance into detailed components, it provides a deeper understanding of how well the model is performing, highlighting both strengths and weaknesses. Whether you are a beginner or an experienced data scientist, mastering the confusion matrix is essential for building effective and reliable machine learning models.

In the world of data analysis, drawing insights from a limited dataset can often be challenging. Traditional statistical methods sometimes fall short when it comes to deriving reliable estimates, especially with small or skewed datasets. This is where bootstrap sampling, a powerful and versatile statistical technique, comes into play.

In this blog, we’ll explore what bootstrap sampling is, how it works, and its various applications in the field of data analysis.

What is Bootstrap Sampling?


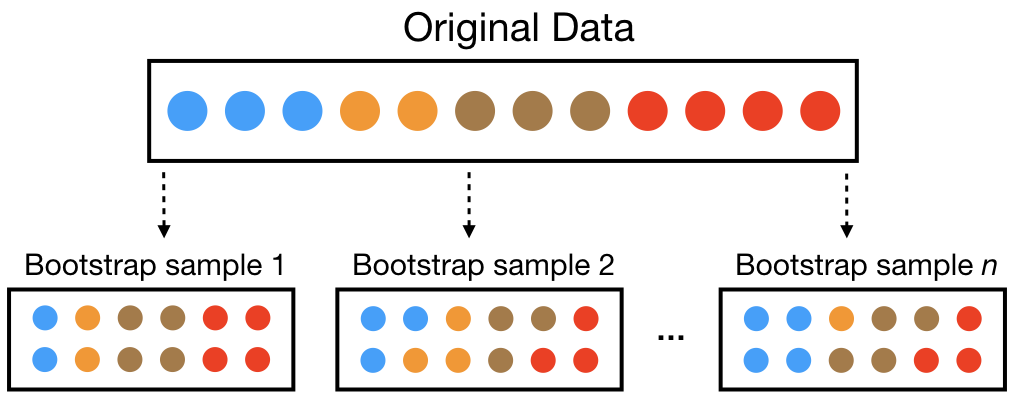
bootstrap sampling
A visual representation of the bootstrap sampling scheme


Bootstrap sampling is a resampling method that involves repeatedly drawing samples from a dataset with replacements to estimate the sampling distribution of a statistic.

Essentially, you take multiple random samples from your original data, calculate the desired statistic for each sample, and use these results to infer properties about the population from which the original data was drawn.


Learn about boosting algorithms in machine learning


Why do we Need Bootstrap Sampling?

This is a fundamental question I’ve seen machine learning enthusiasts grapple with. What is the point of bootstrap sampling? Where can you use it? Let me take an example to explain this. 

Let’s say we want to find the mean height of all the students in a school (which has a total population of 1,000). So, how can we perform this task? 

One approach is to measure the height of a random sample of students and then compute the mean height. I’ve illustrated this process below.

Traditional Approach


bootstrap sampling - traditional approach
Traditional method to sampling a distribution


  1. Draw a random sample of 30 students from the school. 
  2. Measure the heights of these 30 students. 
  3. Compute the mean height of this sample. 

However, this approach has limitations. The mean height calculated from this single sample might not be a reliable estimate of the population mean due to sampling variability. If we draw a different sample of 30 students, we might get a different mean height.

To address this, we need a way to assess the variability of our estimate and improve its accuracy. This is where bootstrap sampling comes into play.

Bootstrap Approach


bootstrap sampling
Implementing bootstrap sampling


  1. Draw a random sample of 30 students from the school and measure their heights. This is your original sample. 
  2. From this original sample, create many new samples (bootstrap samples) by randomly selecting students with replacements. For instance, generate 1,000 bootstrap samples. 
  3. For each bootstrap sample, calculate the mean height. 
  4. Use the distribution of these 1,000 bootstrap means to estimate the mean height of the population and to assess the variability of your estimate.


llm bootcamp banner


Implementation in Python

To illustrate the power of bootstrap sampling, let’s calculate a 95% confidence interval for the mean height of students in a school using Python. We will break down the process into clear steps.

Step 1: Import Necessary Libraries

First, we need to import the necessary libraries. We’ll use `numpy` for numerical operations and `matplotlib` for visualization.


Step 2: Create the Original Sample

We will create a sample dataset of heights. In a real-world scenario, this would be your collected data.


Step 3: Define the Bootstrap Function

We define a function that generates bootstrap samples and calculates the mean for each sample. 


  • data: The original sample. 
  • n_iterations: Number of bootstrap samples to generate. 
  • -bootstrap_means: List to store the mean of each bootstrap sample. 
  • -n_size: The original sample’s size will be the same for each bootstrap sample. 
  • -np.random.choice: Randomly select elements from the original sample with replacements to create a bootstrap sample. 
  • -sample_mean: Mean of the bootstrap sample.


Explore the use of Gini Index and Entropy in data analytics


Step 4: Generate Bootstrap Samples

We use the function to generate 1,000 bootstrap samples and calculate the mean for each.


Step 5: Calculate the Confidence Interval

We calculate the 95% confidence interval from the bootstrap means.


  • np.percentile: Computes the specified percentile (2.5th and 97.5th) of the bootstrap means to determine the confidence interval.

Step 6: Visualize the Bootstrap Means

Finally, we can visualize the distribution of bootstrap means and the confidence interval. 


  • plt.hist: Plots the histogram of bootstrap means. 
  • plt.axvline: Draws vertical lines for the confidence interval.

By following these steps, you can use bootstrap sampling to estimate the mean height of a population and assess the variability of your estimate. This method is simple yet powerful, making it a valuable tool in statistical analysis and data science.


Read about ensemble methods in machine learning


Applications of Bootstrap Sampling

Bootstrap sampling is widely used across various fields, including the following:

Economics

Bootstrap sampling is a versatile tool in economics. It excels in handling non-normal data, commonly found in economic datasets. Key applications include constructing confidence intervals for complex estimators, performing hypothesis tests without parametric assumptions, evaluating model performance, and assessing financial risk.

For instance, economists use bootstrap to estimate income inequality measures, analyze macroeconomic time series, and evaluate the impact of economic policies. The technique is also used to estimate economic indicators, such as inflation rates or GDP growth, where traditional methods might be inadequate.

Medicine

Bootstrap sampling is applied in medicine to analyze clinical trial data, estimate treatment effects, and assess diagnostic test accuracy. It helps in constructing confidence intervals for treatment effects, evaluating the performance of different diagnostic tests, and identifying potential confounders.

Bootstrap can be used to estimate survival probabilities in survival analysis and to assess the reliability of medical imaging techniques. It is also suitable to assess the reliability of clinical trial results, especially when sample sizes are small or the data is not normally distributed.

Machine Learning

In machine learning, bootstrap estimates model uncertainty, improves model generalization, and selects optimal hyperparameters. It aids in tasks like constructing confidence intervals for model predictions, assessing the stability of machine learning models, and performing feature selection.

Bootstrap can create multiple bootstrap samples for training and evaluating different models, helping to identify the best-performing model and prevent overfitting. For instance, it can evaluate the performance of predictive models through techniques like bootstrapped cross-validation.

Ecology

Ecologists utilize bootstrap sampling to estimate population parameters, assess species diversity, and analyze ecological relationships. It helps in constructing confidence intervals for population means, medians, or quantiles, estimating species richness, and evaluating the impact of environmental factors on ecological communities.

Bootstrap is also employed in community ecology to compare species diversity between different habitats or time periods.


How generative AI and LLMs work


Advantages and Disadvantages

Advantages 


Disadvantages 


Non-parametric Method: No assumptions about the underlying distribution of the data, making it highly versatile for various types of datasets.  Computationally Intensive: Requires many resamples, which can be computationally expensive, especially with large datasets. 


Flexibility: Can be used with a wide range of statistics and datasets, including complex measures like regression coefficients and other model parameters.  Not Always Accurate: May not perform well with very small sample sizes or highly skewed data. The quality of the bootstrap estimates depends on the original sample representative of the population. 


Simplicity: Conceptually straightforward and easy to implement with modern computational tools, making it accessible even for those with basic statistical knowledge.  Outlier Sensitivity: Bootstrap sampling can be affected by outliers in the original data. Since the method involves sampling with replacement, outliers can appear multiple times in bootstrap samples, potentially biasing the estimated statistics. 


Explore a hands-on curriculum that helps you build custom LLM applications!


To Sum it Up 

Bootstrap sampling is a powerful tool for data analysis, offering flexibility and practicality in a wide range of applications. By repeatedly resampling from your dataset and calculating the desired statistic, you can gain insights into the variability and reliability of your estimates, even when traditional methods fall short.

Whether you’re working in economics, medicine, machine learning, or ecology, understanding and utilizing bootstrap sampling can enhance your analytical capabilities and lead to more robust conclusions.

As businesses continue to generate massive volumes of data, the problem is to store this data and efficiently use it to drive decision-making and innovation. Enterprise data management is critical for ensuring that data is effectively managed, integrated, and utilized throughout the organization.

One of the most recent developments in this field is the integration of Large Language Models (LLMs) with enterprise data lakes and warehouses.

This article will look at how orchestration frameworks help develop applications on enterprise data, with a focus on LLM integration, scalable data pipelines, and critical security and governance considerations. We will also give a case study on TechCorp, a company that has effectively implemented these technologies.


LLM Bootcamp banner


LLM Integration with Enterprise Data Lakes and Warehouses

Large language models, like OpenAI’s GPT-4, have transformed natural language processing and comprehension. Integrating LLMs with company data lakes and warehouses allows for significant insights and sophisticated analytics capabilities.


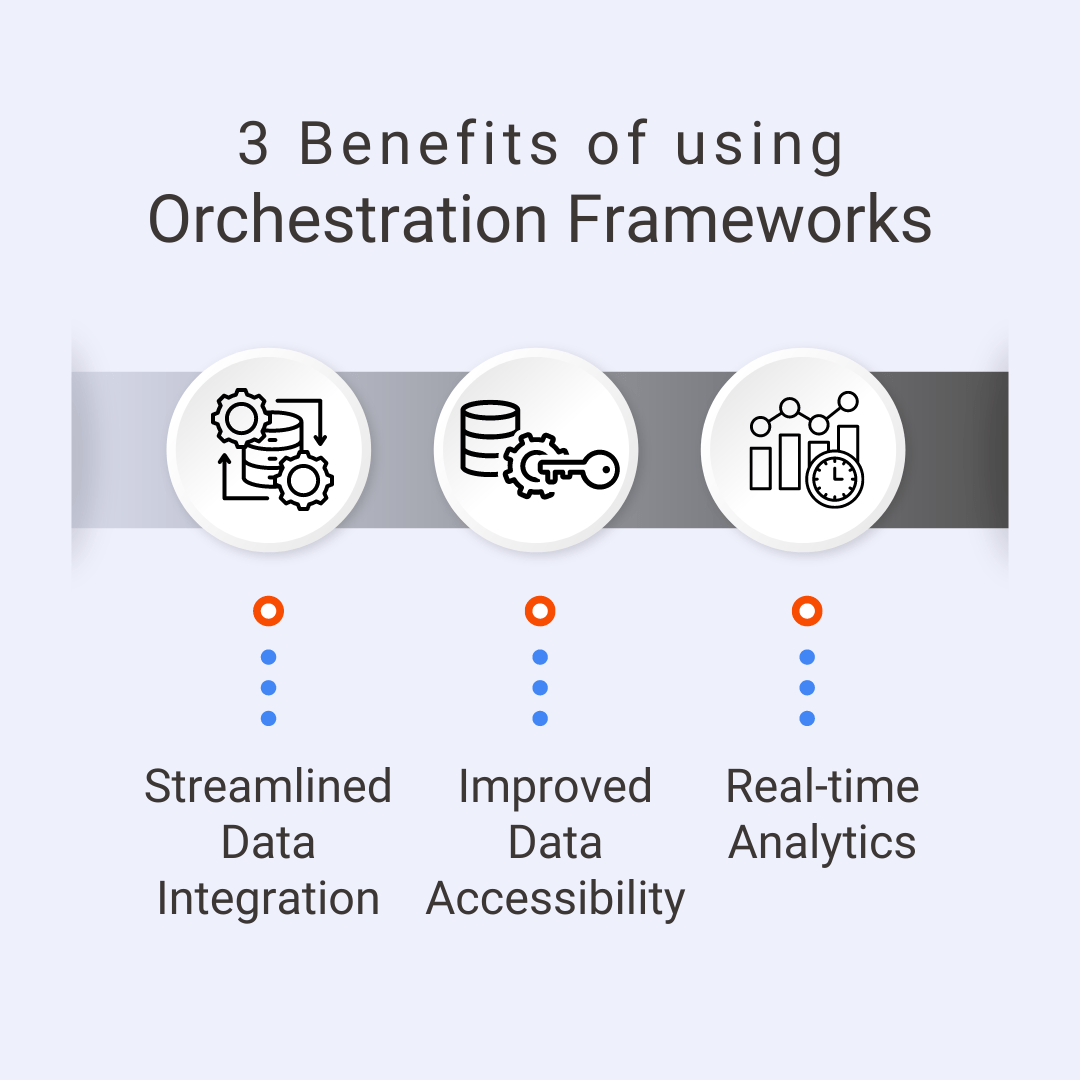
Benefits of using orchestration frameworks - enterprise data management
Benefits of using orchestration frameworks


Here’s how orchestration frameworks help with this:

Streamlined Data Integration

Use orchestration frameworks like Apache Airflow and AWS Step Functions to automate ETL processes and efficiently integrate data from several sources into LLMs. This automation decreases the need for manual intervention and hence the possibility of errors.

Improved Data Accessibility

Integrating LLMs with data lakes (e.g., AWS Lake Formation, Azure Data Lake) and warehouses (e.g., Snowflake, Google BigQuery) allows enterprises to access a centralized repository for structured and unstructured data. This architecture allows LLMs to access a variety of datasets, enhancing their training and inference capabilities.

Real-time Analytics

Orchestration frameworks enable real-time data processing. Event-driven systems can activate LLM-based analytics as soon as new data arrives, enabling organizations to make quick decisions based on the latest information.


Explore 10 ways to generate more leads with data analytics


Scalable Data Pipelines for LLM Training and Inference

Creating and maintaining scalable data pipelines is essential for training and deploying LLMs in an enterprise setting.


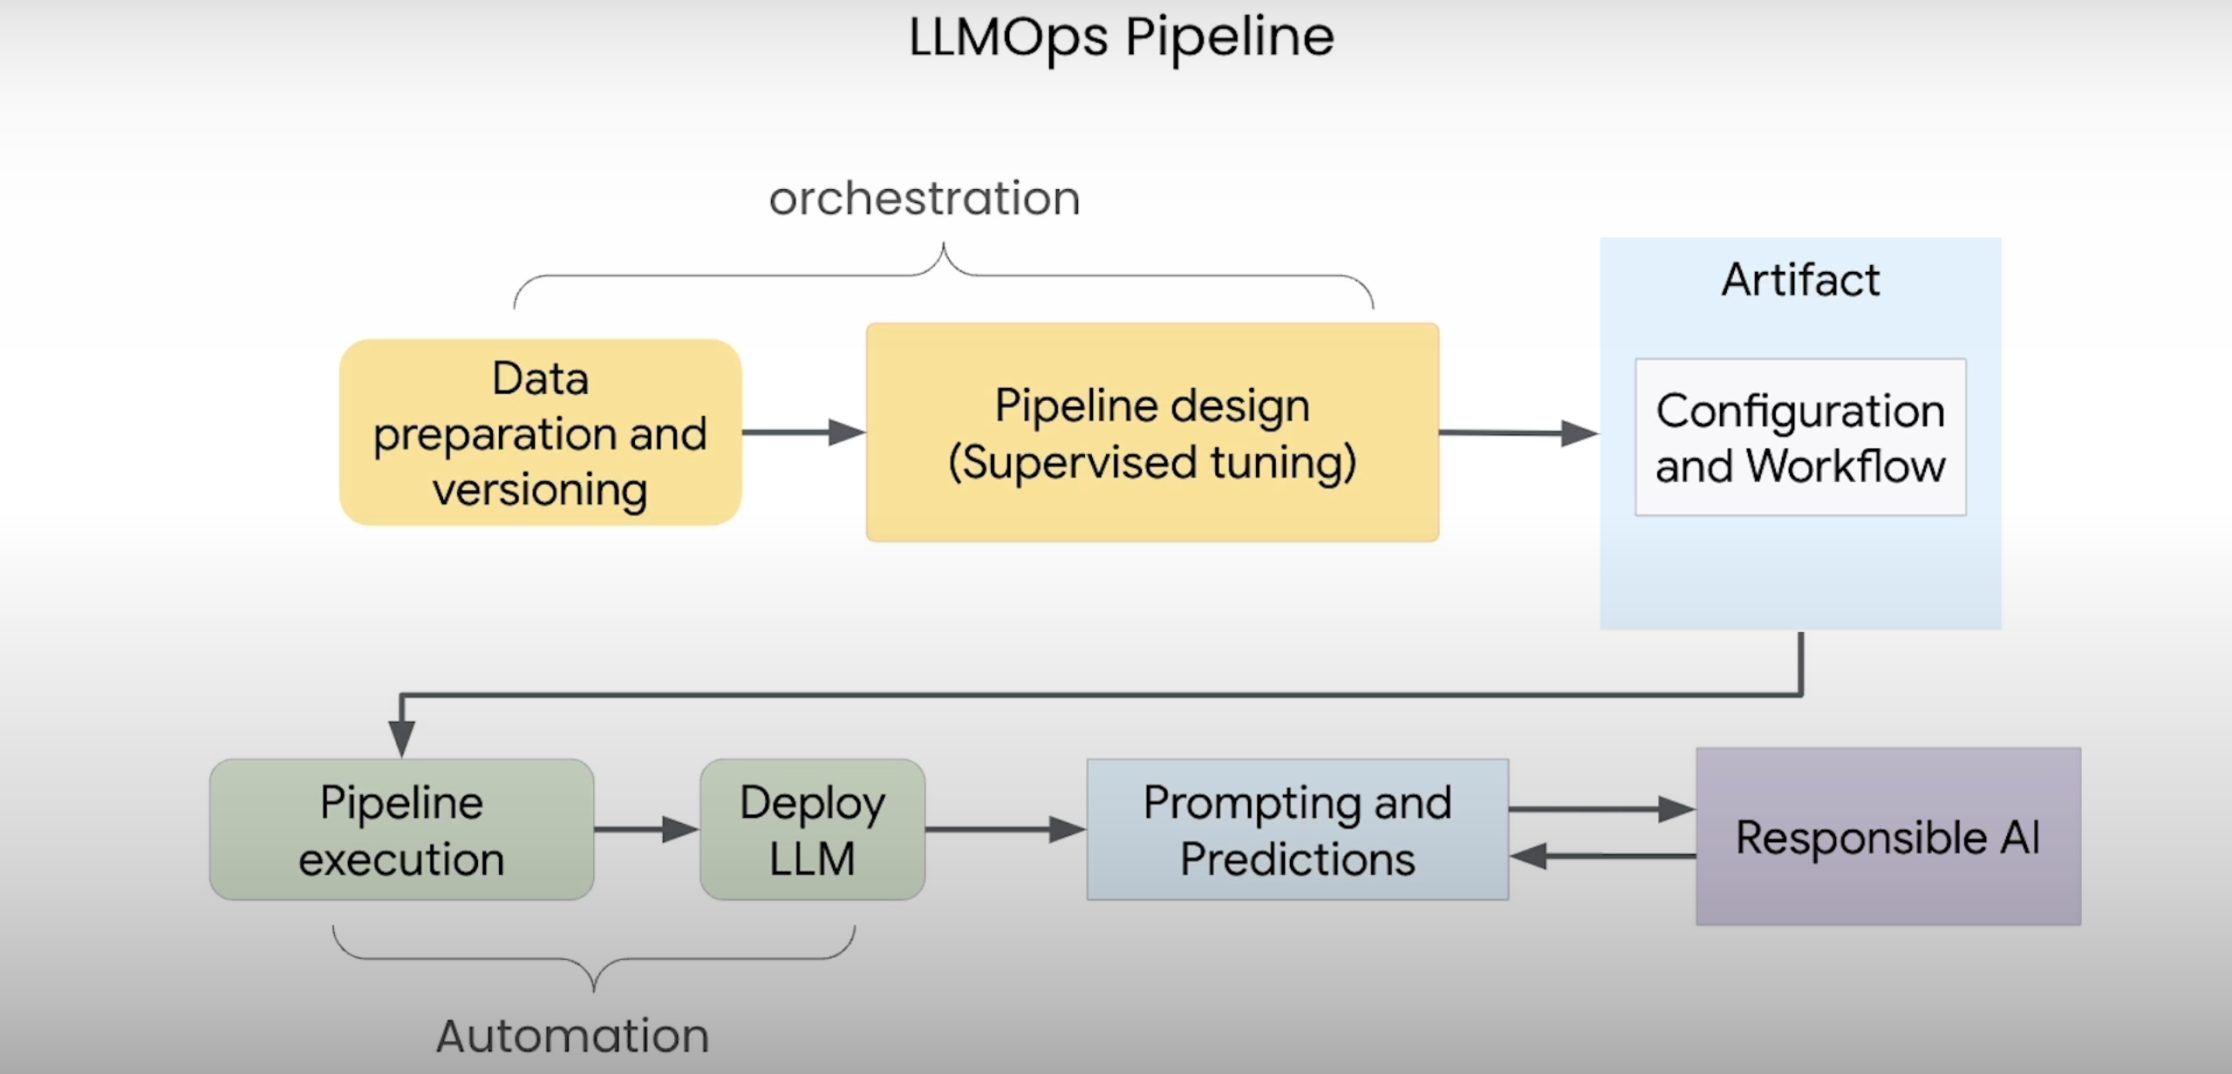
enterprise data management - LLM Ops with orchestration frameworks
An example of integrating LLM Ops with orchestration frameworks – Source: LinkedIn


Here’s how orchestration frameworks work: 

Automated Workflows

Orchestration technologies help automate complex operations for LLM training and inference. Tools like Kubeflow Pipelines and Apache NiFi, for example, can handle the entire lifecycle, from data import to model deployment, ensuring that each step is completed correctly and at scale.

Resource Management

Effectively managing computing resources is crucial for processing vast amounts of data and complex computations in LLM procedures. Kubernetes, for example, can be combined with orchestration frameworks to dynamically assign resources based on workload, resulting in optimal performance and cost-effectiveness.

Monitoring and logging

Tracking data pipelines and model performance is essential for ensuring reliability. Orchestration frameworks include built-in monitoring and logging tools, allowing teams to identify and handle issues quickly. This guarantees that the LLMs produce accurate and consistent findings. 

Security and Governance Considerations for Enterprise LLM Deployments

Deploying LLMs in an enterprise context necessitates strict security and governance procedures to secure sensitive data and meet regulatory standards.


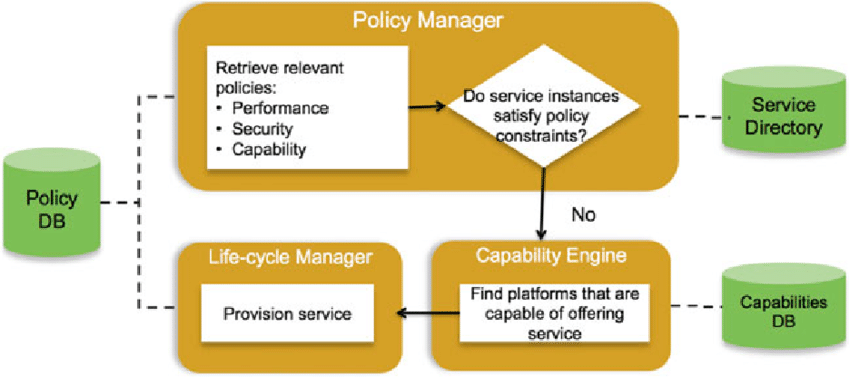
enterprise data management - policy-based orchestration framework
An example of a policy-based orchestration framework – Source: ResearchGate


Orchestration frameworks can meet these needs in a variety of ways:
 

  • Data Privacy and Compliance: Orchestration technologies automate data masking, encryption, and access control processes to implement privacy and compliance requirements, such as GDPR and CCPA. This guarantees that only authorized workers have access to sensitive information.
  • Audit Trails: Keeping accurate audit trails is crucial for tracking data history and changes. Orchestration frameworks can provide detailed audit trails, ensuring transparency and accountability in all data-related actions.
  • Access Control and Identity Management: Orchestration frameworks integrate with IAM systems to guarantee only authorized users have access to LLMs and data. This integration helps to prevent unauthorized access and potential data breaches.
  • Strong Security Protocols: Encryption at rest and in transport is essential for ensuring data integrity. Orchestration frameworks can automate the implementation of these security procedures, maintaining consistency across all data pipelines and operations.


How generative AI and LLMs work


Case Study: Implementing Orchestration Frameworks for Enterprise Data Management at TechCorp

TechCorp is a worldwide technology business focused on software solutions and cloud services. TechCorp generates and handles vast amounts of data every day for its global customer base. The corporation aimed to use its data to make better decisions, improve consumer experiences, and drive innovation.

To do this, TechCorp decided to connect Large Language Models (LLMs) with its enterprise data lakes and warehouses, leveraging orchestration frameworks to improve data management and analytics.  

Challenge

TechCorp faced a number of issues in enterprise data management:  

  • Data Integration: Difficulty in creating a coherent view due to data silos from diverse sources.
  • Scalability: The organization required efficient data handling for LLM training and inference.
  • Security and Governance: Maintaining data privacy and regulatory compliance was crucial.  
  • Resource Management: Efficiently manage computing resources for LLM procedures without overpaying.


Solution

To address these difficulties, TechCorp designed an orchestration system built on Apache Airflow and Kubernetes. The solution included the following components:

Data Integration with Apache Airflow

  • ETL Pipelines were automated using Apache Airflow. Data from multiple sources (CRM systems, transactional databases, and log files) was extracted, processed, and fed into an AWS-based centralized data lake.
  • Data Harmonization: Airflow workflows harmonized data, making it acceptable for LLM training.

Scalable Infrastructure with Kubernetes

  • Dynamic Resource Allocation: Kubernetes used dynamic resource allocation to install LLMs and scale resources based on demand. This method ensured that computational resources were used efficiently during peak periods and scaled down when not required.
  • Containerization: LLMs and other services were containerized with Docker, allowing for consistent and stable deployment across several environments.
  • Data Encryption: All data at rest and in transit was encrypted. Airflow controlled the encryption keys and verified that data protection standards were followed.
  • Access Control: The integration with AWS Identity and Access Management (IAM) ensured that only authorized users could access sensitive data and LLM models.
  • Audit Logs: Airflow’s logging capabilities were used to create comprehensive audit trails, ensuring transparency and accountability for all data processes.


Read more about simplifying LLM apps with orchestration frameworks


LLM Integration and Deployment

  • Training Pipelines: Data pipelines for LLM training were automated with Airflow. The training data was processed and supplied into the LLM, which was deployed across Kubernetes clusters. 
  • Inference Services: Real-time inference services were established to process incoming data and deliver insights. These services were provided via REST APIs, allowing TechCorp applications to take advantage of the LLM’s capabilities.

Implementation Steps

  • Planning and design
    • Identifying major data sources and defining ETL needs.
    • Developed architecture for data pipelines, LLM integration, and Kubernetes deployments.
    • Implemented security and governance policies.
  • Deployment
    • Set up Apache Airflow to orchestrate data pipelines.
    • Set up Kubernetes clusters for scalability LLM deployment.
    • Implemented security measures like data encryption and IAM policies.
  • Testing and Optimization
    • Conducted thorough testing of ETL pipelines and LLM models.
    • Improved resource allocation and pipeline efficiency.
    • Monitored data governance policies continuously to ensure compliance.
  • Monitoring and maintenance
    • Implemented tools to track data pipeline and LLM performance.
    • Updated models and pipelines often to enhance accuracy with fresh data.
    • Conducted regular security evaluations and kept audit logs updated.


Results

 TechCorp experienced substantial improvements in its data management and analytics capabilities:  

  • Improved Data Integration: A unified data perspective across the organization leads to enhanced decision-making.
  • Scalability: Efficient resource management and scalable infrastructure resulted in lower operational costs.  
  • Improved Security: Implemented strong security and governance mechanisms to maintain data privacy and regulatory compliance.
  • Advanced Analytics: Real-time insights from LLMs improved customer experiences and spurred innovation.


Explore a hands-on curriculum that helps you build custom LLM applications!


Conclusion

Orchestration frameworks are critical for developing robust enterprise data management applications, particularly when incorporating sophisticated technologies such as Large Language Models.

These frameworks enable organizations to maximize the value of their data by automating complicated procedures, managing resources efficiently, and guaranteeing strict security and control.

TechCorp’s success demonstrates how leveraging orchestration frameworks may help firms improve their data management capabilities and remain competitive in a data-driven environment.


Written by Muhammad Hamza Naviwala