

By understanding machine learning algorithms, you can appreciate the power of this technology and how it’s changing the world around you! It’s like having a super-powered tool to sort through information and make better sense of the world.
So, just like a super sorting system for your toys, machine learning algorithms can help you organize and understand massive amounts of data in many ways:
Explore Top 9 machine learning algorithms to use for SEO & marketing
- Recommend movies you might like by learning what kind of movies you watch already.
- Spot suspicious activity on your credit card by learning what your normal spending patterns look like.
- Help doctors diagnose diseases by analyzing medical scans and patient data.
- Predict traffic jams by learning patterns in historical traffic data.
Key Machine Learning Techniques
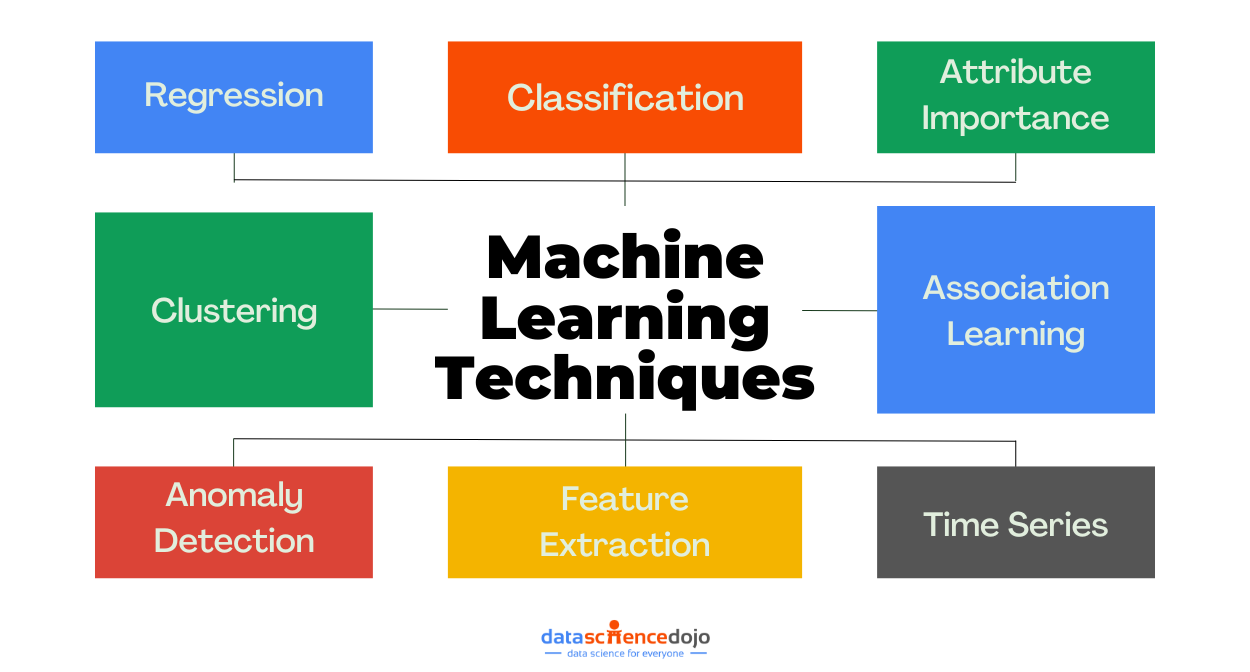
1. Regression
Regression, much like predicting how much popcorn you need for movie night, is a cornerstone of machine learning. It delves into the realm of continuous predictions, where the target variable you’re trying to estimate takes on numerical values. Let’s unravel the technicalities behind this technique:
Learn about Linear regression vs logistic regression
The Core Function:
- Regression algorithms learn from labeled data, similar to classification. However, in this case, the labels are continuous values. For example, you might have data on house size (features) and their corresponding sale prices (target variable).
- The algorithm’s goal is to uncover the underlying relationship between the features and the target variable. This relationship is often depicted by a mathematical function (like a line or curve).
- Once trained, the model can predict the target variable for new, unseen data points based on their features.
Types of Regression Problems:
- Linear Regression: This is the simplest and most common form, where the relationship between features and the target variable is modeled by a straight line.
- Polynomial Regression: When the linear relationship doesn’t suffice, polynomials (curved lines) are used to capture more complex relationships.
- Non-linear Regression: There’s a vast array of non-linear models (e.g., decision trees, support vector regression) that can model even more intricate relationships between features and the target variable.
Technical Considerations:
- Feature Engineering: As with classification, selecting and potentially transforming features significantly impacts model performance.
- Evaluating Model Fit: Metrics, like mean squared error (MSE) or R-squared, are used to assess how well the model’s predictions align with the actual target values.
Master LLM Evaluation Metrics and its Applications
- Overfitting and Underfitting: Similar to classification, achieving a balance between model complexity and generalizability is crucial. Techniques like regularization can help prevent overfitting.
- Residual Analysis: Examining the residuals (differences between predicted and actual values) can reveal underlying patterns and potential issues with the model.
Real-world Applications:
Regression finds applications in various domains:
- Weather Forecasting: Predicting future temperatures based on historical data and current conditions.
- Stock Market Analysis: Forecasting future stock prices based on historical trends and market indicators.
- Sales Prediction: Estimating future sales figures based on past sales data and marketing campaigns.
- Customer Lifetime Value (CLV) Prediction: Forecasting the total revenue a customer will generate over their relationship with a company.
Technical Nuances:
While linear regression offers a good starting point, understanding advanced regression techniques allows you to model more complex relationships and create more accurate predictions in diverse scenarios.
Additionally, addressing issues like multi-collinearity (correlated features) and hetero-scedasticity (unequal variance of errors) becomes crucial as regression models become more sophisticated.
By comprehending these technical aspects, you gain a deeper understanding of how regression algorithms unveil the hidden patterns within your data, enabling you to make informed predictions and solve real-world problems.
Learn in detail about the machine learning Roadmap
2. Classification
Classification algorithms learn from labeled data. This means each data point has a pre-defined category or class label attached to it. For example, in spam filtering, emails might be labeled as “spam” or “not-spam.”
It analyzes the features or attributes of the data (like word content in emails or image pixels in pictures).
Based on this analysis, it builds a model that can predict the class label for new, unseen data points.
Types of Classification Problems:
- Binary Classification: This is the simplest case, where there are only two possible categories (spam/not-spam, cat/dog).
- Multi-Class Classification: Here, there are more than two categories (e.g., classifying handwritten digits into 0, 1, 2, …, 9).
- Multi-Label Classification: A data point can belong to multiple classes simultaneously (e.g., an image might contain both a cat and a dog).
Common Classification Algorithms:
- Logistic Regression: A popular choice for binary classification, it uses a mathematical function to model the probability of a data point belonging to a particular class.
- Support Vector Machines (SVM): This algorithm finds a hyperplane that best separates data points of different classes in high-dimensional space.
- Decision Trees: These work by asking a series of yes/no questions based on data features to classify data points.
- K-Nearest Neighbors (KNN): This method classifies a data point based on the majority class of its K nearest neighbors in the training data.
Learn how machine learning will revolutionize demand planning
Technical aspects to consider:
- Feature Engineering: Choosing the right features and potentially transforming them (e.g., converting text to numerical features) is crucial for model performance.
- Overfitting and Underfitting: The model should neither be too specific to the training data (overfitting) nor too general (underfitting). Techniques like regularization can help balance this.
- Evaluation Metrics: Performance is measured using metrics like accuracy, precision, recall, and F1-score, depending on the specific classification task.
Real-world Applications:
Classification is used extensively across various domains:
- Image Recognition: Classifying objects in pictures (e.g., self-driving cars identifying pedestrians).
- Fraud Detection: Identifying suspicious transactions on credit cards.
- Medical Diagnosis: Classifying medical images or predicting disease risk factors.
- Sentiment Analysis: Classifying text data as positive, negative, or neutral sentiment.

3. Attribute Importance
Just like understanding which features matter most when sorting your laundry, delves into the significance of individual features within your machine-learning model. Here’s a breakdown of the technicalities.
Machine learning models utilize various features (attributes) from your data to make predictions. Not all features, however, contribute equally. Attribute importance helps you quantify the relative influence of each feature on the model’s predictions.
Technical Approaches:
There are several techniques to assess attribute importance, each with its own strengths and weaknesses:
- Feature Permutation: This method randomly shuffles the values of a single feature and observes the resulting change in model performance. A significant drop suggests that feature is important.
- Feature Impurity Measures: This approach, commonly used in decision trees, calculates the average decrease in impurity (e.g., Gini index) when a split is made on a particular feature. Higher impurity reduction indicates greater importance.
- Model-Specific Techniques: Some models have built-in methods for calculating attribute importance. For example, Random Forests track the improvement in prediction accuracy when features are included in splits.

Benefits of Understanding Attribute Importance:
- Model Interpretability: By knowing which features are most important, you gain insights into how the model arrives at its predictions. This is crucial for understanding model behavior and building trust.
- Feature Selection: Identifying irrelevant or redundant features allows you to streamline your data and potentially improve model performance by focusing on the most impactful features.
- Domain Knowledge Integration: Attribute importance can highlight features that align with your domain expertise, validating the model’s reasoning or prompting further investigation.
Technical Considerations:
- Choice of Technique: The most suitable method depends on the model you’re using and the type of data you have. Experimenting with different approaches may be necessary.
- Normalization: The importance scores might need normalization across features for better comparison, especially when features have different scales.
- Limitations: Importance scores can be influenced by interactions between features. A seemingly unimportant feature might play a crucial role in conjunction with others.
Real-world Applications:
Attribute importance finds applications in various domains:
- Fraud Detection: Identifying the financial factors (e.g., transaction amount, location) that most influence fraud prediction allows for targeted risk mitigation strategies.
- Medical Diagnosis: Understanding which symptoms are most crucial for disease prediction helps healthcare professionals prioritize tests and interventions.
- Customer Churn Prediction: Knowing which customer attributes (e.g., purchase history, demographics) are most indicative of churn allows businesses to develop targeted retention strategies.
Undertand 5 tips to enhance customer service using data science
By understanding attribute importance, you gain valuable insights into the inner workings of your machine-learning models. This empowers you to make informed decisions about feature selection, improve model interpretability, and ultimately, achieve better performance.
4. Association Learning
Akin to noticing your friend always buying peanut butter with jelly, is a technique in machine learning that uncovers hidden relationships between different features (attributes) within your data. Let’s delve into the technical aspects:
The Core Concept:
Association learning algorithms analyze large datasets to discover frequent patterns of co-occurrence between features. These patterns are often expressed as association rules, which take the form “if A, then B with confidence X%”. Here’s an example:
- Rule: If a customer buys diapers (A), then they are also likely to buy wipes (B) with 80% confidence (X%).
Technical Approaches:
- Apriori Algorithm: This is a foundational algorithm that employs a breadth-first search to identify frequent itemsets (groups of features that appear together frequently). These itemsets are then used to generate association rules with a minimum support (frequency) and confidence (correlation) threshold.
- FP-Growth Algorithm: This is an optimization over Apriori that uses a frequent pattern tree structure to efficiently mine frequent itemsets, reducing the number of candidate rules generated.
Benefits of Association Learning:
- Market Basket Analysis: Understanding buying patterns helps retailers recommend complementary products and optimize product placement in stores.
- Customer Segmentation: Identifying groups of customers with similar purchasing behavior enables targeted marketing campaigns.
- Fraud Detection: Discovering unusual co-occurrences in transactions can help identify potential fraudulent activities.
Technical Considerations:
- Minimum Support and Confidence: Setting appropriate thresholds for both is crucial. A high support ensures the rule is not based on rare occurrences, while a high confidence guarantees a strong correlation between features.
- Data Sparsity: Association learning often works best with large, dense datasets. Sparse data with many infrequent features can lead to unreliable results.
- Lift: This metric goes beyond confidence and considers the baseline probability of feature B appearing independently. A lift value greater than 1 indicates a stronger association than random chance.
Real-world Applications:
Association learning finds applications in various domains:
- Recommendation Systems: Online platforms leverage association rules to recommend products or content based on a user’s past purchases or browsing behavior.
- Clickstream Analysis: Understanding how users navigate websites through association rules helps optimize website design and user experience.
- Network Intrusion Detection: Identifying unusual patterns in network traffic can help detect potential security threats.
By understanding the technicalities of association learning, you can unlock valuable insights hidden within your data. These insights enable you to make informed decisions in areas like marketing, fraud prevention, and recommendation systems.
Learn in detail about the power of machine learning
5. Time Series
Time series data, like your daily steps or stock prices, unfolds over time. Machine learning unlocks the secrets within this data by analyzing its temporal patterns. Let’s delve into the technicalities of time series analysis:
The Core Idea:
- Time series data consists of data points collected at uniform time intervals. These data points represent the value of a variable at a specific point in time.
- Time series analysis focuses on modeling and understanding the trends, seasonality, and cyclical patterns within this data.
- Machine learning algorithms can then be used to forecast future values based on historical data and the underlying patterns.
Technical Approaches:
There are various models and techniques used for time series analysis:
- Moving Average Models: These models take the average of past data points to predict future values. They are simple but effective for capturing short-term trends.
- Exponential Smoothing: This builds on moving averages by giving more weight to recent data points, and adapting to changing trends.
- ARIMA (Autoregressive Integrated Moving Average): This is a powerful statistical model that captures autoregression (past values influencing future values) and seasonality.
- Recurrent Neural Networks (RNNs): These powerful deep learning models can learn complex patterns and long-term dependencies within time series data, making them suitable for more intricate forecasting tasks.
Explore a beginner’s guide in understanding Neural Networks
Technical Considerations:
- Stationarity: Many time series models assume the data is stationary, meaning the statistical properties (mean, variance) don’t change over time. Differencing techniques might be necessary to achieve stationarity.
- Feature Engineering: Creating new features based on existing time series data (e.g., lags, rolling averages) can improve model performance.
- Evaluation Metrics: Metrics like Mean Squared Error (MSE) or Mean Absolute Error (MAE) are used to assess the accuracy of forecasts generated by the model.
Real-world Applications:
Time series analysis finds applications in various domains:
- Financial Forecasting: Predicting future stock prices, exchange rates, or customer churn.
- Supply Chain Management: Forecasting demand for products to optimize inventory management.
- Sales Forecasting: Predicting future sales figures to plan production and marketing strategies.
- Weather Forecasting: Predicting future temperatures, precipitation, and other weather patterns.
By understanding the technicalities of time series analysis, you can unlock the power of time-based data for forecasting and making informed decisions in various domains. Machine learning offers sophisticated tools for extracting valuable insights from the ever-flowing stream of time series data.
Understand LangChain Agents for Time Series Analysis
6. Feature Extraction
Feature extraction, akin to summarizing a movie by its genre, actors, and director, plays a crucial role in machine learning. It involves transforming raw data into a more meaningful and informative representation for machine learning models to work with. Let’s delve into the technical aspects:
The Core Idea:
- Raw data can be complex and high-dimensional. Machine learning models often struggle to process and learn from this raw data directly.
- Feature extraction aims to extract a smaller set of features from the raw data that are more relevant to the machine-learning task at hand. These features capture the essential information needed for the model to make predictions.
Technical Approaches:
There are various techniques for feature extraction, depending on the type of data you’re dealing with:
- Feature Selection: This involves selecting a subset of existing features that are most informative and relevant to the prediction task. Techniques like correlation analysis and filter methods can be used for this purpose.
- Dimensionality Reduction: Techniques like Principal Component Analysis (PCA) project high-dimensional data onto a lower-dimensional space while preserving most of the information. This reduces the complexity of the data and improves model efficiency.
- Feature Engineering: This involves creating entirely new features from the existing data. This can be done through domain knowledge, mathematical transformations, or feature combinations. For example, creating new features like “day of the week” from a date column.
Benefits of Feature Extraction:
- Improved Model Performance: By focusing on relevant features, the model can learn more effectively and make better predictions.
- Reduced Training Time: Lower dimensional data allows for faster training of machine learning models.
- Reduced Overfitting: Feature extraction can help prevent overfitting by reducing the number of features the model needs to learn from.
Technical Considerations:
- Choosing the Right Technique: The best approach depends on the type of data and the machine learning task. Experimentation with different techniques might be necessary.
- Domain Knowledge: Feature engineering often relies on your domain expertise to create meaningful features from the raw data.
- Evaluation and Interpretation: It’s essential to evaluate the impact of feature extraction on model performance. Additionally, understanding the extracted features can provide insights into the model’s behavior.
Real-world Applications:
Feature extraction finds applications in various domains:
- Image Recognition: Extracting features like edges, shapes, and colors from images helps models recognize objects.
Learn how to use AI Image Generation Tools
- Text Analysis: Feature extraction might involve extracting keywords, sentiment scores, or topic information from text data for tasks like sentiment analysis or document classification.
- Sensor Data Analysis: Extracting relevant features from sensor data (e.g., temperature, pressure) helps models monitor equipment health or predict system failures.
By understanding the intricacies of feature extraction, you can transform raw data into a goldmine of information for your machine learning models. This empowers you to extract the essence of your data and unlock its full potential for accurate predictions and insightful analysis.
7. Anomaly Detection
Anomaly detection, like noticing a misspelled word in an essay, equips machine learning models to identify data points that deviate significantly from the norm. These anomalies can signal potential errors, fraud, or critical events that require attention. Let’s delve into the technical aspects:
The Core Idea:
- Machine learning models learn the typical patterns and characteristics of data during the training phase.
- Anomaly detection algorithms leverage this knowledge to identify data points that fall outside the expected range or exhibit unusual patterns.
Technical Approaches:
There are several approaches to anomaly detection, each suitable for different scenarios:
- Statistical Methods: Techniques like outlier detection using standard deviation or z-scores can identify data points that statistically differ from the majority.
Explore Top 10 statistics books for data science
- Distance-based Methods: These methods measure the distance of a data point from its nearest neighbors in the feature space. Points far away from others are considered anomalies.
- Clustering Algorithms: Clustering algorithms can group data points with similar features. Points that don’t belong to any well-defined cluster might be anomalies.
- Machine Learning Models: Techniques like One-Class Support Vector Machines (OCSVM) learn a model of “normal” data and then flag any points that deviate from this model as anomalies.
Technical Considerations:
- Defining Normality: Clearly defining what constitutes “normal” data is crucial for effective anomaly detection. This often relies on historical data and domain knowledge.
- False Positives and False Negatives: Anomaly detection algorithms can generate false positives (flagging normal data as anomalies) and false negatives (missing actual anomalies). Balancing these trade-offs is essential.
- Threshold Selection: Setting appropriate thresholds for anomaly scores determines how sensitive the system is to detecting anomalies. A high threshold might miss critical events, while a low threshold can lead to many false positives.
Real-world Applications:
Anomaly detection finds applications in various domains:
- Fraud Detection: Identifying unusual transactions in credit card usage patterns can help prevent fraudulent activities.
Learn in detail about Fraudgpt
- Network Intrusion Detection: Detecting anomalies in network traffic patterns can help identify potential cyberattacks.
- Equipment Health Monitoring: Identifying anomalies in sensor data from machines can predict equipment failures and prevent costly downtime.
- Medical Diagnosis: Detecting anomalies in medical scans or patient vitals can help diagnose potential health problems.
By understanding the technicalities of anomaly detection, you can equip your machine learning models with the ability to identify the unexpected. This proactive approach allows you to catch issues early on, improve system security, and optimize various processes across diverse domains.

8. Clustering
Clustering, much like grouping similar-colored socks together, is a powerful unsupervised machine learning technique. It delves into the world of unlabeled data, where data points lack predefined categories.
Clustering algorithms automatically group data points with similar characteristics, forming meaningful clusters. Let’s explore the technical aspects:
The Core Idea:
- Unsupervised learning means the data points don’t have pre-assigned labels (e.g., shirt, pants).
- Clustering algorithms analyze the features (attributes) of data points and group them based on their similarity.
- The similarity between data points is often measured using distance metrics like Euclidean distance (straight line distance) in a multi-dimensional feature space.
Types of Clustering Algorithms:
- K-Means Clustering: This is a popular and efficient algorithm that partitions data points into a predefined number of clusters (k). It iteratively calculates the centroid (center) of each cluster and assigns data points to the closest centroid until convergence (stable clusters).
- Hierarchical Clustering: This method builds a hierarchy of clusters, either in a top-down (divisive) fashion by splitting large clusters or a bottom-up (agglomerative) fashion by merging smaller clusters. The level of granularity in the hierarchy determines the final clustering results.
- Density-Based Spatial Clustering of Applications with Noise (DBSCAN): This approach identifies clusters based on areas of high data point density, separated by areas of low density (noise). It doesn’t require predefining the number of clusters and can handle outliers effectively.
Technical Considerations:
- Choosing the Right Algorithm: The optimal algorithm depends on the nature of your data, the desired number of clusters, and the presence of noise. Experimentation might be necessary.
Understand the top 8 machine learning algorithms explained in less than 1 minute each
- Data Preprocessing: Feature scaling and normalization might be crucial for ensuring all features contribute equally to the distance calculations used in clustering.
- Evaluating Clustering Results: Metrics like silhouette score or Calinski-Harabasz index can help assess the quality and separation between clusters, but domain knowledge is also valuable for interpreting the results.
Real-world Applications:
Clustering finds applications in various domains:
- Customer Segmentation: Grouping customers with similar purchasing behavior allows for targeted marketing campaigns and loyalty programs.
- Image Segmentation: Identifying objects or regions of interest within images by grouping pixels with similar color or texture.
- Document Clustering: Grouping documents based on topic or content for efficient information retrieval.
- Social Network Analysis: Identifying communities or groups of users with similar interests or connections.
By understanding the machine learning technique of clustering, you gain the ability to uncover hidden patterns within your unlabeled data. This allows you to segment data for further analysis, discover new customer groups, and gain valuable insights into the structure of your data.