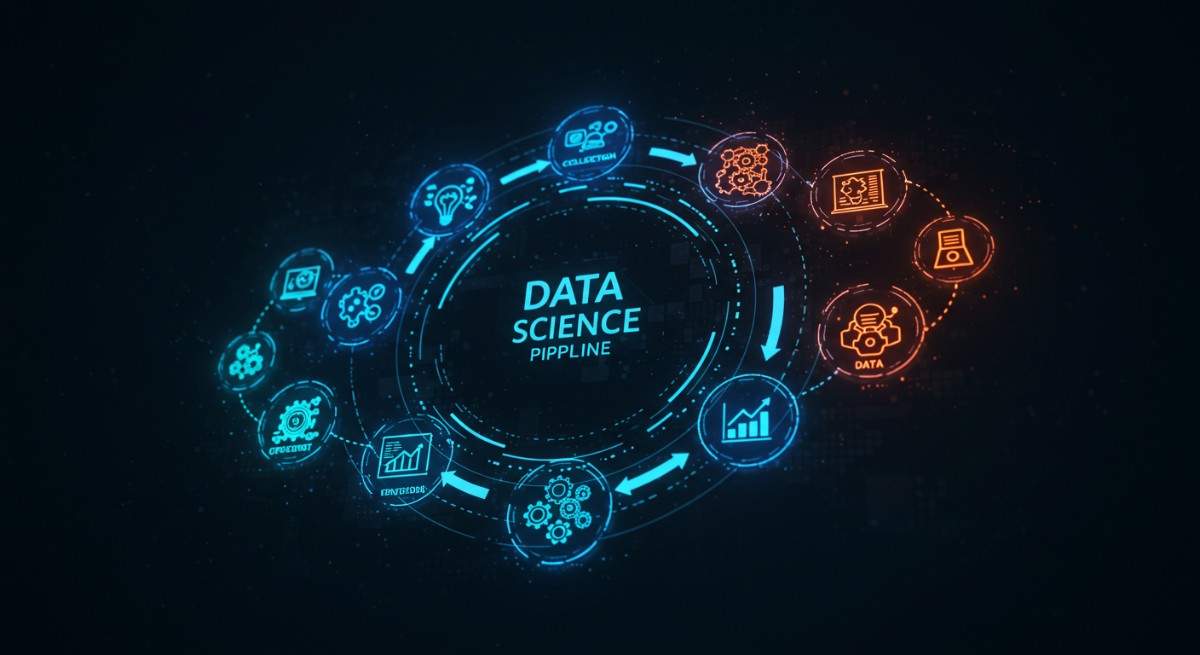

To perform a systematic study of data, we use data science life cycle to perform testable methods to make predictions.
Before you apply science to data, you must be aware of the important steps. A data science life cycle will help you get a clear understanding of the end-to-end actions of a data scientist. It provides us with a framework to fulfill business requirements using data science tools and technologies.
Follow these steps to accomplish your data science life cycle
In this blog, we will study the iterative steps used to develop, deliver, and maintain any data science product.
1. Problem identification
Let us say you are going to work on a project in the healthcare industry. Your team has identified that there is a problem of patient data management in this industry, and this is affecting the quality of healthcare services provided to patients.
Before you start your data science project, you need to identify the problem and its effects on patients. You can do this by conducting research on various sources, including:
- Online forums
- Social media (Twitter and Facebook)
- Company websites
Understanding the aim of analysis to extract data is mandatory. It sets the direction to use data science for the specific task. For instance, you need to know if the customer is willing to minimize savings loss or prefers to predict the rate of a commodity.
To be precise, in this step we answer the following questions:
- Clearly state the problem to be solved
- Reason to solve the problem
- State the potential value of the project to motivate everyone
- Identify the stakeholders and risks associated with the project
- Perform high-level research with your data science team
- Determine and communicate the project plan
Pro-tip: Enroll yourself in Data Science boot camp and become a Data Scientist today
2. Data investigation
To complete this step, you need to dive into the enterprise’s data collection methods and data repositories. It Is important to gather all the relevant and required data to maintain the quality of research. Data scientists contact the enterprise group to apprehend the available data.
In this step, we:
- Describe the data
- Define its structure
- Figure out relevance of data and
- Assess the type of data record
Here you need to intently explore the data to find any available information related to the problem. Because the historical data present in the archive contributes to better understanding of business.
In any business, data collection is a continual process. At various steps, information on key stakeholders is recorded in various software systems. To study that data to successfully conduct a data science project it is important to understand the process followed from product development to deployment and delivery.
Also, data scientists also use many statistical methods to extract critical data and derive meaningful insights from it.
3. Pre-processing of data
Organizing the scattered data of any business is a pre-requisite to data exploration. First, we gather data from multiple sources in various formats, then convert the data into a unified format for smooth data processing.
All the data processing happens in a data warehouse, in which data scientists together extract, transform and load (ETL) the data. Once the data is collected, and the ETL process is completed, data science operations are carried out.
It is important to realize the role of the ETL process in every data science project. Also, a data architect contributed widely at the stage of pre-processing data as they decide the structure of the data warehouse and perform the steps of ETL operations.
The actions to be performed at this stage of a data science project are:
- Selection of the applicable data
- Data integration by means of merging the data sets
- Data cleaning and filtration of relevant information
- Treating the lacking values through either eliminating them or imputing them
- Treating inaccurate data through eliminating them
- Additionally, test for outliers the use of box plots and cope with them
This step also emphasizes the importance of elements essential to constructing new data. Often, we are mistaken to start data research for a project from scratch. However, data pre-processing suggests us to construct new data by refining the existing information and eliminating undesirable columns and features.
Data preparation is the most time-consuming but the most essential step in the complete existence cycle. Your model will be as accurate as your data.
4. Exploratory data analysis
Applause to us! We now have the data ready to work on. At this stage make sure that you have the data in your hands in the required format. Data analysis is carried out by using various statistical tools. Support of data engineer is crucial in data analysis. They perform the following steps to conduct the Exploratory Data Analysis:
- Examine the data by formulating the various statistical functions
- Identify dependent and independent variables or features
- Analyze key features of data to work on
- Define the spread of data
Moreover, for thorough data analysis, various plots are utilized to visualize the data for better understanding for everyone. Data scientists explore the distribution of data inside distinctive variables of a character graphically by the usage of bar graphs. Not only this but relations between distinct aspects are captured via graphical representations like scatter plots and warmth maps.
The instruments like Tableau, PowerBI and so on are well known for performing Exploratory Data Analysis and Visualization. Information on Data Science with Python and R is significant for performing EDA on an information.
5. Data modeling
Data modeling refers to the process of converting raw data into a form that can be transverse into other applications as well. Mostly, this step is performed in spreadsheets, but data scientists also prefer to use statistical tools and databases for data modeling.
The following elements are required for data modeling:
Data dictionary: A list of all the properties describing your data that you want to maintain in your system, for example, spreadsheet, database, or statistical software.
Entity relationship diagram: This diagram shows the relationship between entities in your data model. It shows how each element is related to the other, as well as any constraints to that relationship.
Data model: A set of classes representing each piece of information in your system, along with its attributes and relationships with other objects in the system.
The Machine Learning engineer applies different algorithms to the information and delivers the result. While demonstrating the information numerous multiple times, the models are first tried on fake information like genuine information.
6. Model evaluation/ Monitoring
Before we learn what, model evaluation is all about, we need to know that model evaluation can be done parallel to the other stages of the data science life cycle. It helps you to know at every step if your model is working as intended or if you need to make any changes. Alongside, eradicate any error at an early stage to avoid getting false predictions at the end of the project.
In case you fail to acquire a quality result in the evaluation, we must reiterate the complete modeling procedure until the preferred stage of metrics is achieved.
As we assess the model towards the end of project, there might be changes in the information, however, the result will change contingent upon changes in information. Thus, while assessing the model the following two stages are significant
-
Data drift analysis:
Data drift refers to the changes in the input information. Data drift analysis is a feature in data science that highlights the changes in the information along with the circumstance. Examination of this change is called Data Drift Analysis. The accuracy of the model relies heavily on how well it handles this information float. The progressions in information are significantly a direct result of progress in factual properties of information.
-
Model drift analysis
We use drift machine learning techniques to find the information. Additionally, more complex techniques like Adaptive Windowing, Page Hinkley, and so on are accessible for use. Demonstrating Drift Analysis is significant as we realize change is quick. Steady advancement likewise can be utilized where the model is presented to added information gradually.
Start your data science project today

Data science life cycle is a collection of individual steps that need to be taken to prepare for and execute a data science project.
The steps include identifying the project goals, gathering relevant data, analyzing it using appropriate tools and techniques, and presenting results in a meaningful way.
It is not an effortless process, but with some planning and preparation you can make it much easier on yourself.
