

Data Analysis Expressions (DAX) is a powerful formula language designed to enable complex calculations and data analysis within Microsoft tools like Power BI, Power Pivot, and SQL Server Analysis Services (SSAS). It is widely used to work with data in tabular data models—structures where data is stored in tables, often with relationships defined between them.
DAX formulas are similar to Excel functions but are specifically tailored to handle large datasets and perform dynamic, real-time calculations in business intelligence (BI) tools. The language allows users to write expressions that perform calculations on columns and measures, enabling a deeper understanding of business data by providing real-time insights.

A DAX formula typically contains three key components:
-
Functions: These are pre-built operations that DAX performs on data, similar to Excel functions but designed for BI use cases. For example,
SUM(),AVERAGE(),COUNTROWS(), andCALCULATE()are some of the most commonly used functions in DAX. -
Operators: These are symbols that perform mathematical or logical operations within a DAX formula. Common operators include addition (
+), subtraction (-), multiplication (*), division (/), and logical operators like AND, OR, and NOT. -
Values: These are the constants or literal values used in DAX formulas. They can be numbers, strings, or even dates, and are often used in combination with functions and operators to create more complex expressions.
The Basics of DAX for Data Analysis
Data Analysis Expressions (DAX) is a powerful tool that allows you to create dynamic and insightful reports. By mastering DAX, you can enhance your ability to make data-driven decisions through advanced and interactive analysis. Here’s how:
Perform Advanced Calculations on Data
DAX allows you to go beyond basic aggregation. You can perform advanced calculations like running totals, year-over-year growth, and custom KPIs. Functions such as CALCULATE(), SUMX(), and FILTER() enable complex calculations across multiple related tables. These calculations adjust based on the data’s context, providing more accurate and relevant insights.
Create Dynamic Filters and Calculations
DAX helps you create dynamic filters that make your reports interactive. As users apply slicers or filters, DAX automatically recalculates values. For example, selecting a region can instantly update total sales or average profit for that region. Functions like ALL(), ALLEXCEPT(), and VALUES() control how calculations are filtered, offering responsive results to user inputs.
Another interesting read: Data Analytics and QR Codes
Create Measures That Can Be Used in Reports
A measure in DAX is a calculation that responds to the context of your report. Unlike calculated columns, measures are calculated dynamically based on applied filters or slicers. For example, measures like total sales, average revenue, and growth percentages are calculated in real time, offering flexible and updated insights directly in your visualizations.
Build Tabular Data Models
DAX works best with tabular data models, where tables are linked through relationships. By creating models in Power BI or Power Pivot, you can use DAX to perform calculations across multiple related tables. This enables a deeper analysis of your data, such as calculating sales across product or customer tables, while providing a more structured approach to large datasets.
Creating DAX Tables, Columns, and Measures
DAX tables are similar to Excel tables, but they can contain calculated columns and measures. Calculated columns are formulas that are applied to all rows in a column, while measures are formulas that are calculated based on data in multiple columns.
To create a DAX table, right-click on the Tables pane and select New Table. In the Create Table dialog box, enter a name for the table and select the columns that you want to include.
To create a calculated column, right-click on the Columns pane and select New Calculated Column. In the Create Calculated Column dialog box, enter a name for the column and type in the formula that you want to use.
To create a measure, right-click on the Measures pane and select New Measure. In the Create Measure dialog box, enter a name for the measure and type in the formula that you want to use.
Executing DAX Operators
In Data Analysis Expressions (DAX), operators play a key role in performing calculations and comparisons on your data. They allow you to manipulate values, perform logical operations, and even work with text. Here’s an overview of the most common types of operators used in DAX:
Arithmetic Operators
Arithmetic operators are used to perform basic mathematical operations on numerical values. These operators are similar to those you find in Excel and are essential for creating simple calculations in DAX.
-
Addition (
+): Adds two values together. -
Subtraction (
-): Subtracts one value from another. -
Multiplication (
*): Multiplies two values. -
Division (
/): Divides one value by another.
For example, you can calculate total sales by multiplying the price per item by the quantity sold (Price * Quantity), or you can calculate profit margins using subtraction (Revenue - Cost).
Comparison Operators
Comparison operators allow you to compare two values and return a Boolean result, meaning either TRUE or FALSE. These operators are often used to filter data, create conditional expressions, or control the flow of calculations.
-
Equal to (
=): Returns TRUE if two values are equal. -
Not equal to (
<>): Returns TRUE if two values are not equal. -
Greater than (
>): Returns TRUE if the first value is greater than the second. -
Less than (
<): Returns TRUE if the first value is less than the second. -
Greater than or equal to (
>=): Returns TRUE if the first value is greater than or equal to the second. -
Less than or equal to (
<=): Returns TRUE if the first value is less than or equal to the second.
These operators are useful when you need to create conditions or filters based on data. For example, you could use a comparison operator to filter for products that have sales greater than a specific threshold.
Learn about 3 proven ways for big data protection
Logical Operators
Logical operators are used to combine multiple Boolean values (TRUE/FALSE) and return a single Boolean result. These are commonly used for conditional checks in DAX formulas.
-
AND (
&&): Returns TRUE if both conditions are TRUE. -
OR (
||): Returns TRUE if either of the conditions is TRUE. -
NOT (
!): Reverses the Boolean value, i.e., it returns TRUE if the condition is FALSE and FALSE if the condition is TRUE.
Logical operators are key when building complex conditions in DAX. For example, you can use the AND operator to filter for sales where both the quantity is greater than a certain number and the profit margin is above a threshold.
Text Operators
Text operators are used to manipulate text strings. These operators allow you to combine, compare, or modify text data in your reports.
-
Concatenation (
&): Combines two or more text strings into a single string. For instance,FirstName & " " & LastNamewill create a full name from first and last names. -
Text comparison (
=): Compares two text strings to check if they are identical.
Text operators are particularly useful for combining information in reports. For example, you can create dynamic titles or labels by combining data fields, like creating a sales report title that includes the region and time period.
Read more –> Data Analysis Roadmap 101: A step-by-step guide
Discussing Basic Math & Statistical Functions
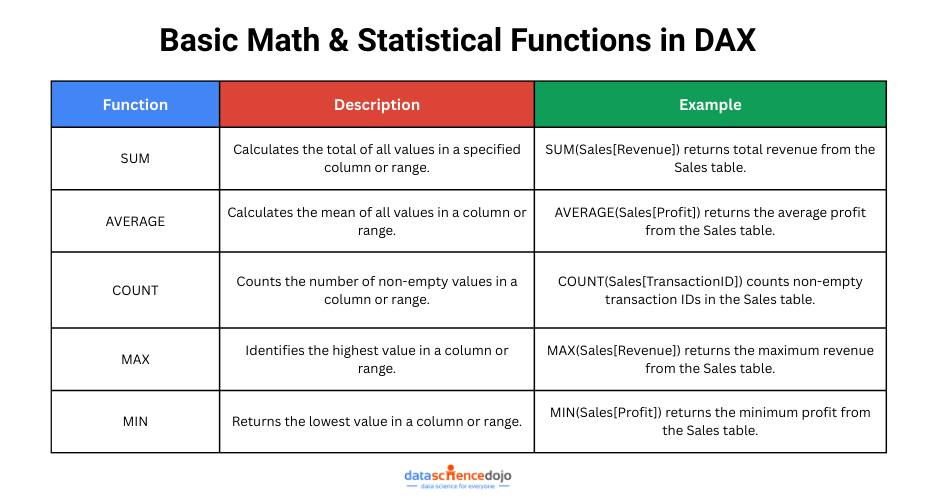
Data Analysis Expressions (DAX) offers a wide range of mathematical and statistical functions designed to simplify calculations on your data. These functions allow you to perform aggregations, comparisons, and other essential operations on columns or ranges in your dataset. Below are some common mathematical and statistical functions used in DAX:
SUM
The SUM function in DAX calculates the total of all values within a specified column or range. This function is useful when you need to aggregate numerical data, such as calculating total sales or revenue.
Example: SUM(Sales[Revenue]) returns the total revenue from the Sales table.
AVERAGE
The AVERAGE function calculates the mean of all values in a column or range. This is particularly useful for identifying trends or summarizing data over a period, such as calculating the average monthly sales or average customer satisfaction score.
Example: AVERAGE(Sales[Profit]) returns the average profit for all entries in the Sales table.
COUNT
The COUNT function counts the number of non-empty values in a column or range. It’s helpful for counting the number of records or items that contain data. For instance, you can use it to determine how many sales transactions occurred or how many customers made a purchase.
Example: COUNT(Sales[TransactionID]) counts the number of non-empty transaction IDs in the Sales table.
MAX
The MAX function identifies the highest value in a column or range. It’s often used to find maximum values, such as the highest sales amount or the largest order quantity.
Example: MAX(Sales[Revenue]) returns the maximum revenue from the Sales table.
MIN
The MIN function returns the lowest value in a column or range. It’s useful for identifying minimum values, such as the lowest order total or the least profitable product.
Example: MIN(Sales[Profit]) returns the minimum profit from the Sales table.
These Data Analysis Expressions (DAX) functions are essential for performing basic yet critical calculations that help you analyze data more effectively. By using these functions, you can quickly summarize your data and gain deeper insights into business performance. Mastering these functions is a fundamental step in utilizing DAX for data analysis.
Implementing Date & Time Functions
DAX offers a wide variety of date and time functions designed to help you manipulate and analyze time-related data efficiently. These functions are crucial when working with time-based analysis, such as tracking sales trends over time or calculating time differences. Below are some common date and time functions in DAX:
DATEADD
The DATEADD function allows you to add a specific number of days, months, years, or hours to a given date. This function is useful when you need to calculate a future or past date based on a reference point.
Example: DATEADD(Sales[OrderDate], 1, MONTH) adds one month to the OrderDate column in the Sales table.
DATEDIFF
The DATEDIFF function calculates the difference between two dates and returns the result in days, months, years, or hours. This is particularly helpful for measuring time spans, such as determining the number of days between two events or comparing sales performance over different periods.
Example: DATEDIFF(Sales[OrderDate], TODAY(), DAY) returns the number of days between the OrderDate and the current date.

TODAY
The TODAY function returns the current date, which can be used in various scenarios, such as comparing data to today’s date or filtering reports for up-to-date information. This function is often combined with other date functions to create dynamic reports that adjust to the current day.
Example: TODAY() returns today’s date based on the system’s current date.
NOW
The NOW function returns the current date and time. This function is ideal when you need to track real-time data or calculate the difference between the current moment and a specific timestamp, such as calculating the time elapsed since an event occurred.
Example: NOW() returns the exact current date and time based on the system clock.
These Data Analysis Expressions (DAX) date and time functions make it easier to perform time-based calculations and analyses. Whether you’re adding or subtracting dates, comparing time intervals, or using real-time data, DAX provides the tools necessary for sophisticated time-based analysis. Mastering these functions is a valuable step in leveraging DAX for effective data analysis and reporting.
Using Text Functions
DAX provides a variety of text functions that allow you to manipulate and analyze text data. These functions are essential for cleaning up data, extracting specific information, or creating more readable reports. Below are some common text functions used in DAX:
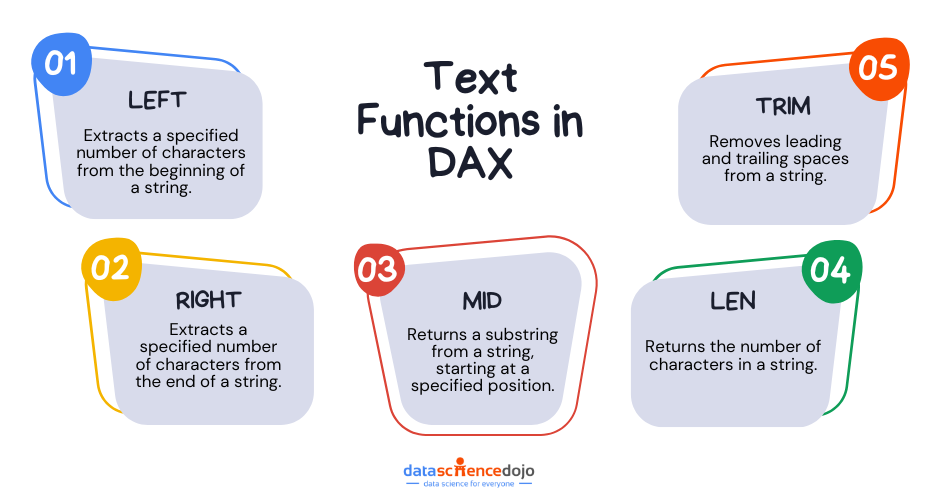
LEFT
The LEFT function returns a specified number of characters from the beginning of a string. This is useful when you need to extract the first part of a text field, such as the first few characters of a product code or customer name.
Example: LEFT(Product[ProductCode], 3) returns the first three characters of the ProductCode column in the Product table.
RIGHT
The RIGHT function returns a specified number of characters from the end of a string. It’s helpful when you want to extract information from the end of a text string, such as extracting the last digits of a serial number or the last part of an email address.
Example: RIGHT(Customer[PhoneNumber], 4) returns the last four digits of the PhoneNumber column in the Customer table.
MID
The MID function returns a substring from a string, starting at a specified position and continuing for a defined number of characters. This function is useful when you need to extract a specific part of a string, such as a middle portion of a product description or a code.
Example: MID(Product[ProductDescription], 2, 5) returns five characters from the ProductDescription column, starting at the second character.
LEN
The LEN function returns the length of a string, or the number of characters in a text field. This is useful for validating data or ensuring that text fields contain the expected number of characters.
Example: LEN(Customer[EmailAddress]) returns the number of characters in the EmailAddress column for each customer.
TRIM
The TRIM function removes any leading and trailing spaces from a string. This is particularly helpful when cleaning up data that may have extra spaces before or after the actual text, which could cause inconsistencies in analysis.
Example: TRIM(Customer[Address]) removes leading and trailing spaces from the Address column in the Customer table.
Using Calculate & Filter Functions
DAX provides powerful CALCULATE and FILTER functions that are essential for creating dynamic calculations and refining data for more specific insights. These functions allow you to adjust the context in which calculations are performed, making your analysis more flexible and tailored to your needs. Below are some common CALCULATE and FILTER functions used in DAX:
CALCULATE
The CALCULATE function is one of the most powerful and commonly used functions in DAX. It allows you to perform dynamic calculations based on the current context, modifying the filter context before executing the calculation. This means that you can adjust the calculation results based on specific conditions or filters, providing more relevant insights.
Example: CALCULATE(SUM(Sales[Revenue]), Sales[Region] = "West") calculates the total revenue for the Sales table, but only for the records where the Region is “West.”
FILTER
The FILTER function returns a table that contains only the rows that meet a specific condition. It’s commonly used to create more refined calculations, especially when you need to perform an operation on a subset of data rather than the entire dataset.
Example: FILTER(Sales, Sales[Quantity] > 10) filters the Sales table to only include rows where the Quantity is greater than 10, which can then be used in other DAX functions like SUM or AVERAGE for further analysis.
By combining CALCULATE and FILTER, you can build sophisticated, dynamic formulas that allow you to adjust your analysis based on different conditions or contexts. These functions are especially useful when you need to perform complex calculations or implement custom business logic in your reports.
Optimizing DAX Performance
As datasets grow larger, optimizing queries becomes critical to maintaining fast execution and ensuring responsive reports. Inefficient DAX queries can cause significant delays, especially with large volumes of data. Here are some tips and best practices to optimize DAX queries for better performance:
1. Use Variables to Store Intermediate Results
Using variables is one of the most effective ways to improve performance. When you store intermediate results in variables, you avoid recalculating the same values multiple times within a query. By computing a result once and referencing it throughout your expression, you reduce unnecessary processing and improve query speed.
2. Reduce Row Contexts
Row context is created when calculations are performed on each individual row in a table. While row context is necessary for certain calculations, it can slow down performance, especially with large datasets. You can improve performance by reducing the number of row context operations. Instead of relying on row context, use functions like SUMX or AVERAGEX, which allow for more optimized calculations over a table.
3. Avoid Using Complex Nested Functions
Complex nested functions, such as multiple IF statements or deeply nested FILTER functions, can degrade performance. Simplifying DAX expressions by breaking down complex logic into smaller parts can lead to more efficient calculations. This reduces the workload and speeds up execution.
4. Leverage Built-in Functions for Performance
DAX includes a variety of built-in functions, such as SUM, AVERAGE, and COUNTROWS, that are optimized for better performance. When possible, use these built-in functions instead of creating custom calculations. Built-in functions are more efficient because they are designed to work well with DAX’s in-memory processing, leading to faster results.
5. Minimize the Use of CALCULATE and FILTER
While CALCULATE and FILTER are powerful DAX functions, overusing them can slow down performance, especially with large datasets. Try to limit their use and, when necessary, combine them into a single statement. Additionally, if filtering is required, consider using pre-calculated tables or columns to reduce the need for complex filtering at runtime.
6. Use a Simplified Data Model
A well-structured data model is essential for optimizing DAX performance. Using a star schema—where fact tables contain data values, and dimension tables contain metadata—can make calculations more efficient by minimizing the need for complex joins. Avoid unnecessary relationships or redundant columns in the data model to further streamline performance.
Summing Up
In summary, DAX is an essential language for performing advanced calculations and queries in Power BI, Power Pivot, and Analysis Services. By mastering the basics of it, you can unlock the full potential of your data, creating dynamic, interactive reports that provide valuable insights. Whether you’re calculating key performance metrics, building complex business logic, or tailoring reports to specific needs, DAX helps you make more informed, data-driven decisions. Embracing DAX empowers you to transform raw data into actionable insights, supporting more strategic decision-making in any business setting.