

An overview of data analysis, the data analysis methods, its process, and implications for modern corporations.
Studies show that 73% of corporate executives believe that companies failing to use data analysis on big data lack long-term sustainability. While data analysis can guide enterprises to make smart decisions, it can also be useful for individual decision-making.
Let’s consider an example of using data analysis at an intuitive individual level. As consumers, we are always choosing between products offered by multiple companies. These decisions, in turn, are guided by individual past experiences. Every individual analysis the data obtained via their experience to generate a final decision.
Put more concretely, data analysis involves sifting through data, modeling it, and transforming it to yield information that guides strategic decision-making. For businesses, data analytics can provide highly impactful decisions with long-term yield.
So, let’s dive deep and look at how data analytics tools can help businesses make smarter decisions.
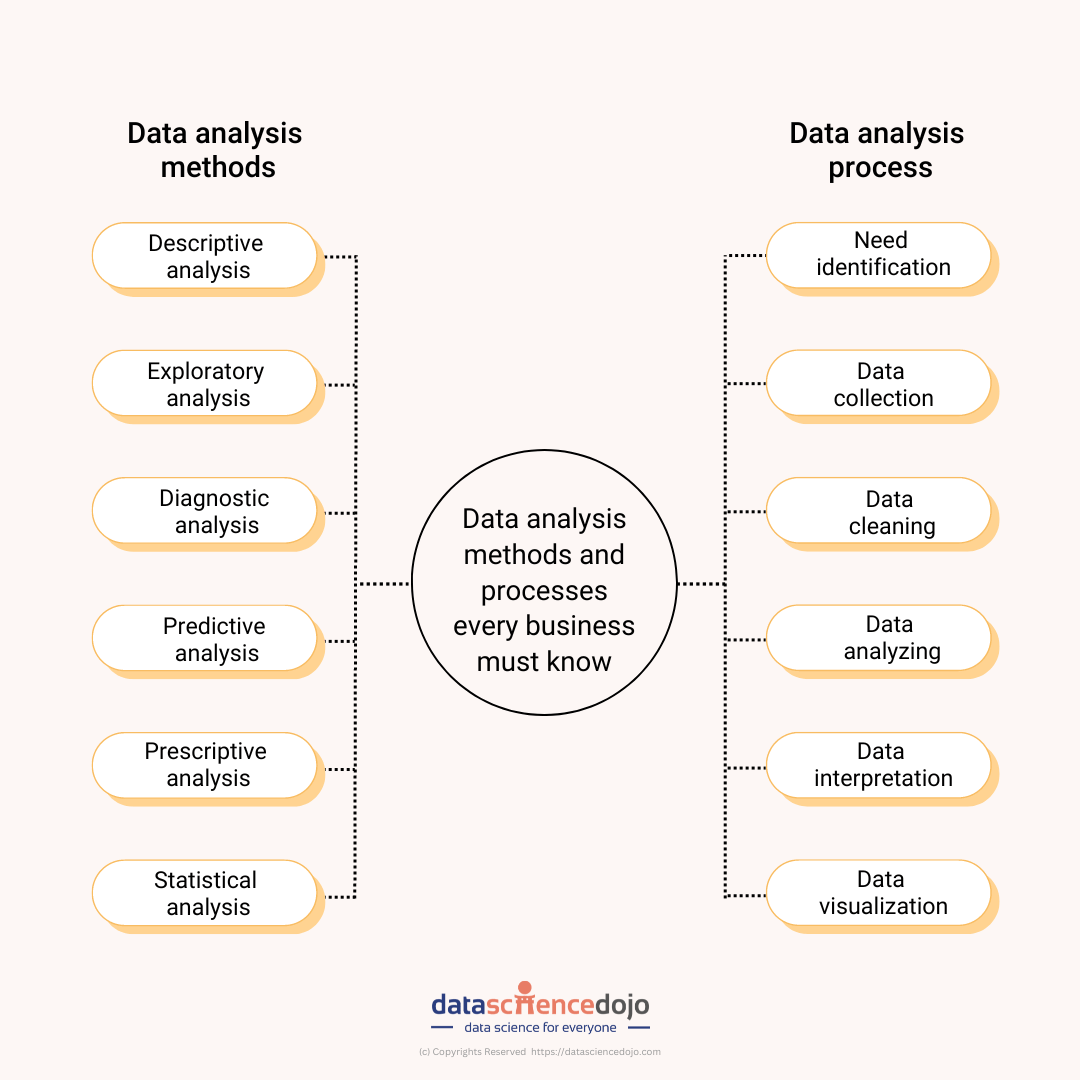
The data analysis process
The process includes five key steps:
1. Identify the need
Companies use data analytics for strategic decision-making regarding a specific issue. The first step, therefore, is to identify the particular problem. For example, a company decides it wants to reduce its production costs while maintaining product quality. To do so effectively, the company would need to identify step(s) of the workflow pipeline it should implement cost cuts.
Similarly, the company might also have a hypothetical solution to its question. Data analytics can be used to judge the falsifiability of the hypothesis, allowing the decision-maker to reach the optimized solution.
A specific question or hypothesis determines the subsequent steps of the process. Hence, this must be as clear and specific as possible.
2. Collect the data
Once the data analysis need is identified, the subsequent kind of data is also determined. Data collection can involve data entered in different types and formats. One broad classification is based on structure and includes structured and unstructured data.
Structured data, for example, is the data a company obtains from its users via internal data acquisition methods such as marketing automation tools. More importantly, it follows the usual row-column database and is suited to the company’s exact needs.
Unstructured data, on the other hand, need not follow any such formatting. It is obtained via third parties such as Google Trends, census bureaus, world health bureaus, and so on. Structured data is easier to work with as it’s already tailored to the company’s needs. However, unstructured data can provide a significantly larger data volume.
There are many other data types to consider as well. For example, metadata, big data, real-time data, and machine data.
3. Clean the data
The third step, data cleaning, ensures that error-free data is used for the data analysis. This step includes procedures such as formatting data correctly and consistently, removing any duplicate or anomalous entries, dealing with missing data, and fixing cross-set data errors.
Performing these tasks manually is tedious and hence, various tools exist to smoothen the data-cleaning process. These include open-source data tools such as OpenRefine, desktop applications like Trifacta Wrangler, cloud-based software as a service (SaaS) like TIBCO Clarity, and other data management tools such as IBM Infosphere quality stage especially used for big data.
4. Perform data analysis
Data analysis includes several methods as described earlier. The method to be implemented depends closely on the research question to be investigated. Data analysis methods are discussed in detail later in this blog.
5. Present the results
Presentation of results defines how well the results are to be communicated. Visualization tools such as charts, images, and graphs effectively convey findings, establishing visual connections in the viewer’s mind. These tools emphasize patterns discovered in existing data and shed light on predicted patterns, assisting the results’ interpretation.
Listen to the Data Analysis challenges in cybersecurity
Data analysis methods
Data analysts use a variety of approaches, methods, and tools to deal with data. Let’s sift through these methods from an approach-based perspective:
1. Descriptive analysis
Descriptive analysis involves categorizing and presenting broader datasets in a way that allows emergent patterns to be observed from them to see if there are any obvious patterns. Data aggregation techniques are one way of performing descriptive analysis. This involves first collecting the data and then sorting it to ease manageability.
This can also involve performing statistical analysis on the data to determine, say, the measures of frequency, dispersion, and central tendencies that provide a mathematical description for the data.
2. Exploratory analysis
Exploratory analysis involves consulting various data sets to see how certain variables may be related, or how certain patterns may be driving others. This analytic approach is crucial in framing potential hypotheses and research questions that can be investigated using data analytic techniques.
Data mining, for example, requires data analysts to use exploratory analysis to sift through big data and generate hypotheses to be tested.
3. Diagnostic analysis
Diagnostic analysis is used to answer why a particular pattern exists in the first place. For example, this kind of analysis can assist a company in understanding why its product is performing in a certain way in the market.
Diagnostic analytics includes methods such as hypothesis testing, determining correlations v/s causation, and diagnostic regression analysis.
4. Predictive analysis
Predictive analysis answers the question of what will happen. This type of analysis is key for companies in deciding new features or updates on existing products, and in determining what products will perform well in the market.
For predictive analysis, data analysts use existing results from the earlier described analyses while also using results from machine learning and artificial intelligence to determine precise predictions for future performance.
5. Prescriptive analysis
Prescriptive analysis involves determining the most effective strategy for implementing the decision arrived at. For example, an organization can use prescriptive analysis to sift through the best way to unroll a new feature. This component of data analytics actively deals with the consumer end, requiring one to work with marketing, human resources, and so on.
Prescriptive analysis makes use of machine learning algorithms to analyze large amounts of big data for business intelligence. These algorithms can assess large amounts of data by working through them via “if” and “else” statements and making recommendations accordingly.
6. Quantitative and qualitative analysis
Quantitative analysis computationally implements algorithms testing out a mathematical fit to describe correlation or causation observed within datasets. This includes regression analysis, null analysis, hypothesis analysis, etc.
Qualitative analysis, on the other hand, involves non-numerical data such as interviews and pertains to answering broader social questions. It involves working closely with textual data to derive explanations.
7. Statistical analysis
Statistical techniques provide answers to essential decision challenges. For example, they can accurately quantify risk probabilities, predict product performance, establish relationships between variables, and so on. These techniques are used by both qualitative and quantitative analysis methods. Some of the invaluable statistical techniques for data analysts include linear regression, classification, resampling methods, and subset selection.
Statistical analysis, more importantly, lies at the heart of data analysis, providing the essential mathematical framework via which analysis is conducted.
Data-driven businesses
Data-driven businesses use the data analysis methods described above. As a result, they offer many advantages and are particularly suited to modern needs. Their credibility relies on them being evidence-based and using precise mathematical models to determine decisions.
Some of these advantages include stronger customer needs, precise identification of business needs, devising effective strategy decisions, and performing well in a competitive market. Data-driven businesses are the way forward.