During political campaigns, political candidates not only need votes but also need financial contributions. Here’s what the campaign finance data set from 2012 looks like.
Understanding individual political contribution by the occupation of top 1% vs bottom 99% in political campaigns
A political candidate not only needs votes, but they also need money. In today’s multi-media world millions of dollars are necessary to effectively run campaign finances. To win the election battle citizens will be bombarded with ads that cost millions. Other mounting expenses include wages for staff, consultants, surveyors, grassroots activists, media experts, wonks, and policy analysts. The figures are staggering with the next presidential election year campaigns likely to cost more than ten billion dollars.
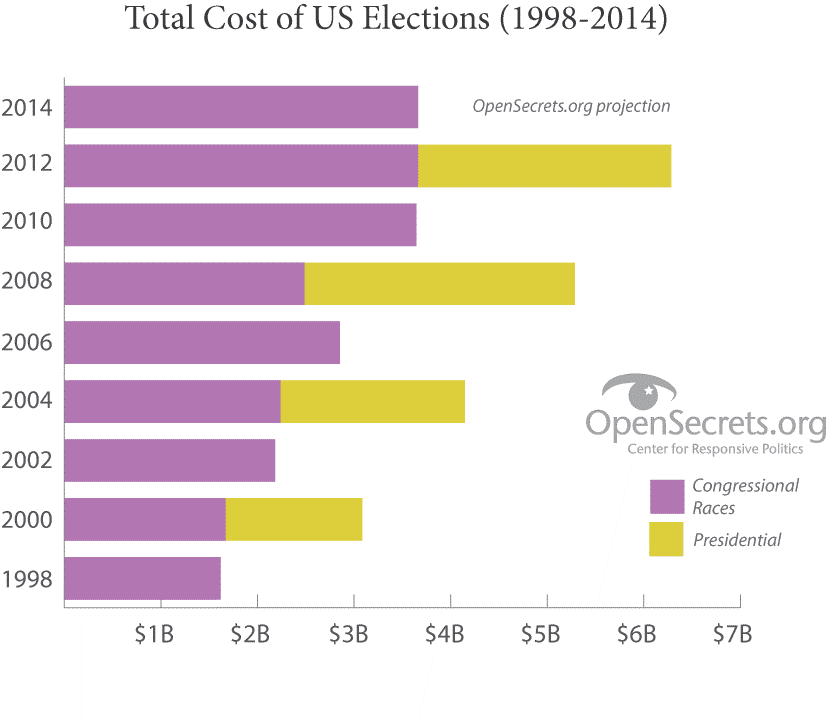
Opensecrets.org has summarized the money spent by presidential candidates, Senate and House candidates, political parties, and independent interest groups that played an influential role in the federal elections by cycle. There’s no sign of less spending in future elections.
The 2016 presidential election cycle is already underway, the fund-raising war has already begun. Koch brothers’ political organization released an $889 million budget in January 2015 supporting conservative campaigns in the 2016 presidential contest. As for primary presidential candidates, the Hillary Clinton Campaign aims to raise at least $100 million for the primary election. On the other side of the political aisle, analysts speculated primary candidate Jeb Bush will raise over $100 million when he discloses his financial position in July.
In my mind I imagine that money coming from millionaires and billionaires or mega-corporations intent on promoting candidates that favor their cause. But who are these people? And how about middle-class citizens like me? Does my paltry $200 amount to anything? Does the spending power of the 99% have any impact on the outcome of an election? Even as a novice I knew I would never understand American politics by listening to TV talking heads or the candidates and their say-nothing ads but by following the money.
By investigating real data about where the stream of money dominating our elections comes from and the role it plays in the success of an election, I hope to find some insight into all the political noise. Thanks to the Federal Election Campaign Act, which requires candidate committees, party committees, and political action committees (PACs) to disclose reports on the money they raise and spend and identify individuals who give more than $200 in an election cycle, a wealth of public data exists to explore. I choose to focus on individual contributions to federal committees greater than $200 for the election cycle 2011-2012.
The data is publicly available at http://www.fec.gov/finance/disclosure/ftpdet.shtml.
Creating the groups
In the 2012 election cycle, which includes congressional and primary elections, the total amount of individual donations collected was USD 784 million. USD 220 million came from the top 1% of donors, which made up 28% of the total contribution. These elites’ wealthy donors were 7119 individuals, each having donated at least USD 10,000 to federal committees. So, who are the top 1%? What do they do for a living that gave them such financial power to support political committees?
The unique occupation titles from the dataset are simply overwhelming and difficult to construct appropriate analysis. Thus, these occupations were classified into twenty-two occupation groups according to the employment definition from the Bureau of Statistics. Additional categories were created due to a lack of definition to classify them into appropriate groups. Among them are “Retired,” “Unemployed,” “Homemaker,” and “Politicians.”
Immediately from Figure 1, we observe the “Management” occupation group contributed the highest total amount in the 2012 cycle for Democrats, Republicans, and Other parties, respectively. Other top donors by occupation groups are “Business and Financial Operations,” “Retired,” “Homemaker,” “Politicians,” and “Legal.” Overall, the Republicans Parties received a more individual contribution from most of the occupation groups, with noticeable exception from “Legal” and “Arts, Design, Entertainment, Sports and Media.” The total contribution given to “Other” non-Democratic/Republican was abysmal in comparison.
Figure 1: Total contribution of top 1% by occupation group
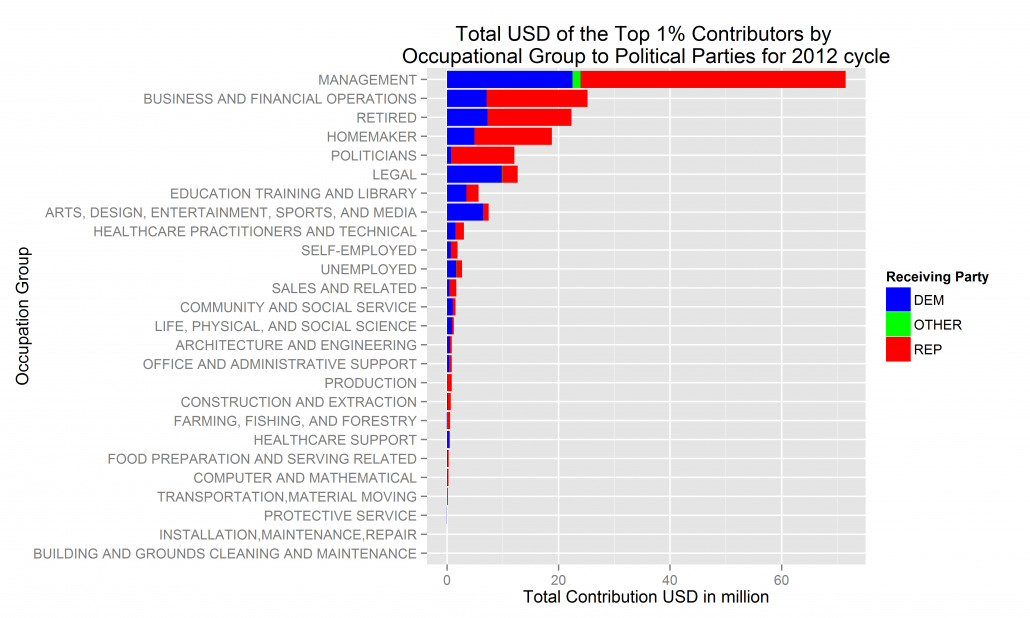
One might conclude that the reason for the “Management” group being the top donor is obvious given these people are CEOs, CFOs, Presidents, Directors, Managers, and many other management titles in a company. According to the Bureau of Statistics, the “Management” group earned the highest median wages among all other occupation groups. They simply had more to give. The same argument could be applied to the “Business and Financial Operations” group, which is comprised of people who held jobs as investors, business owners, real estate developers, bankers, etc.
Perhaps we could look at the individual contribution by occupation group from another angle. When analyzing the average contribution by occupation group, the “Politicians” group became top of the chart. Individuals belonging to this category are either currently holding public office or they had declared candidacy for office with no other occupation reported. Since there is no limit on how much candidates may contribute to their committee, this group represents rich individuals funding their campaigns.
Figure 2: Average contribution of Top 1% by occupation groups
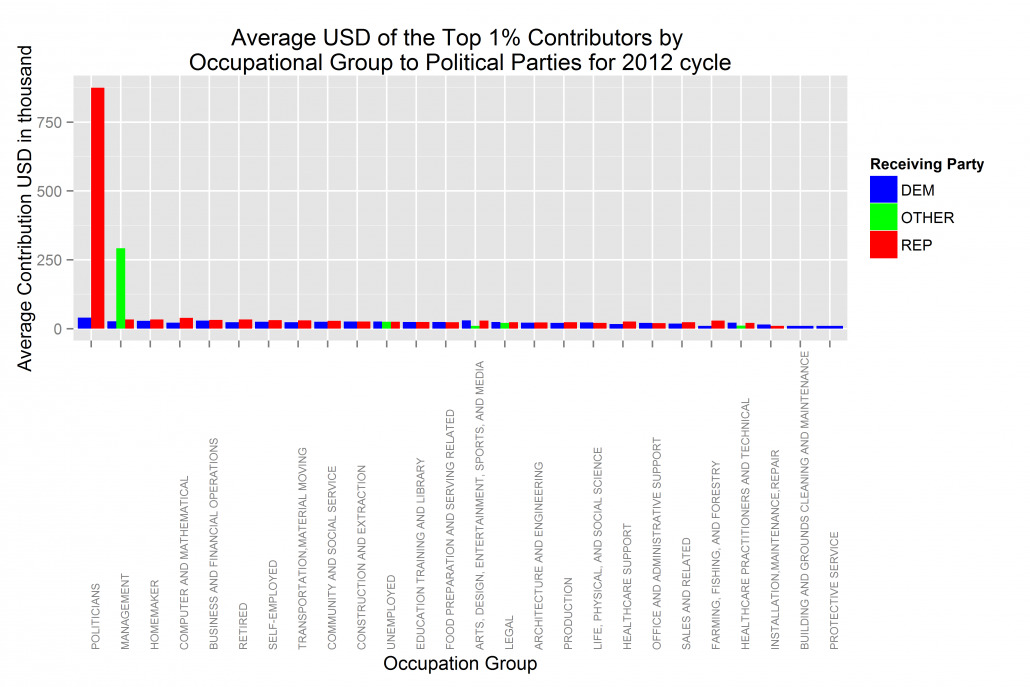
Suspiciously, the average amount per politician given to Republican committees is dramatically higher than other parties. Further analysis indicated that the outlier is candidate John Huntsman, who donated about USD 5 million to his committee, “Jon Huntsman for President Inc.” This has inflated the average contribution dramatically. The same phenomenon was also observed among the “Management” group, where the average contribution to the “Other” party was significantly higher compared to traditional parties.
Out of the five donors who contributed to an independent party from the “Management” group, William Bloomfield alone donated USD 1.3 million (out of the USD 1.45 million total amount collected) to his “Bloomfield for Congress” committee. According to the data, he was the Chairman of Baron Real Estate. This is an example of a wealthy elite spending a hefty sum of money to buy his way into the election race.
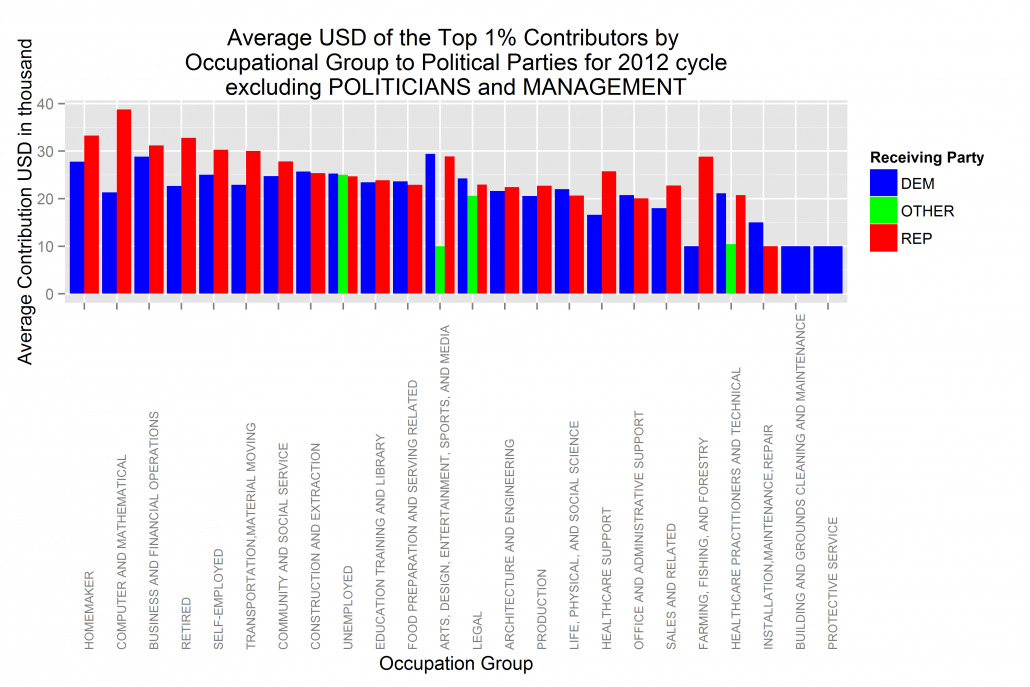
Donald Trump, a billionaire business mogul made headlines recently by declaring his intention to run for presidency 2016 election. He certainly has no trouble paying for his campaign. After excluding the occupation groups “Politicians” and “Management,” with the intention to visualize the comparison among groups more clearly, the contrast became less dramatic. No doubt, the average contribution to Republicans Committees is consistently higher than other parties in most of the occupation groups.
Figure 3: Average contribution of Top 1% by occupation group excluding politicians and management group
Could a similar story of the top 1% be told for the bottom 99%? Overall, the top 5 contributors by occupation group are quite similar between the top 1% and bottom 99%. Once again “Management” group collectively raised the most amount of donations to the Democrats and Republicans Parties. The biggest difference here is that “Politicians” is no longer the top contributor in the bottom 99% demographic.
Figure 4: Total contribution of bottom 99% by Occupation Group
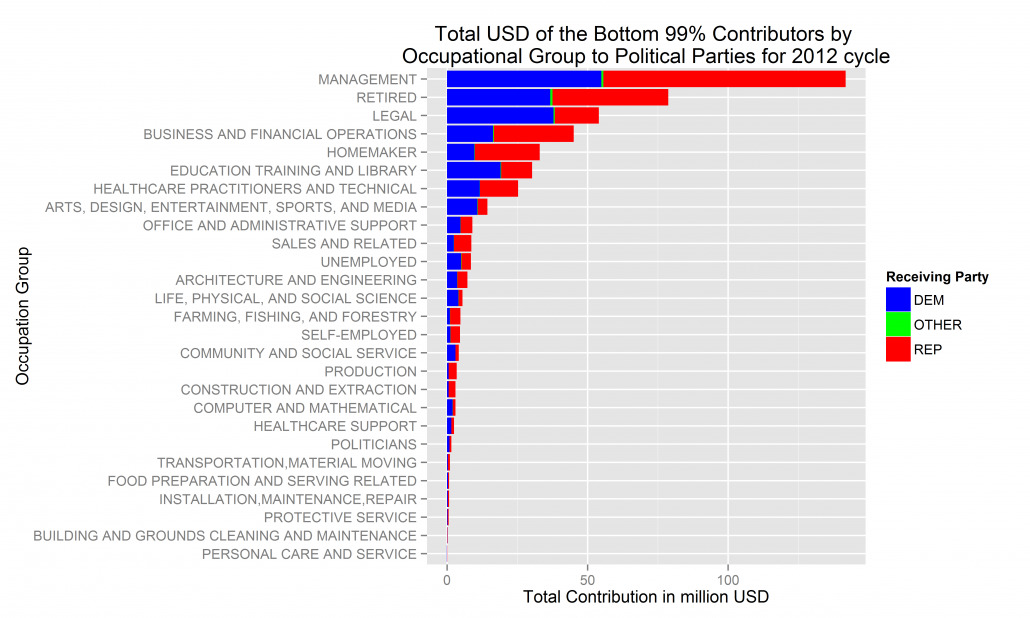
Homemakers consistently rank high in both total contributions as well as average contribution, in both the top 1% and bottom 99%. On average, homemakers from the bottom 99% donated about $1500 meanwhile homemakers from the top 1% donated about $30,000 to their chosen political committees. Clearly across all levels of socioeconomic status spouses and stay-at-home parents play a key role in the fundraising war. Since the term “Homemaker” is not well-defined, I can only assume their source of money comes from a spouse, inherited wealth, or personal savings.
Figure 5: Average contribution of bottom 99% by occupation group
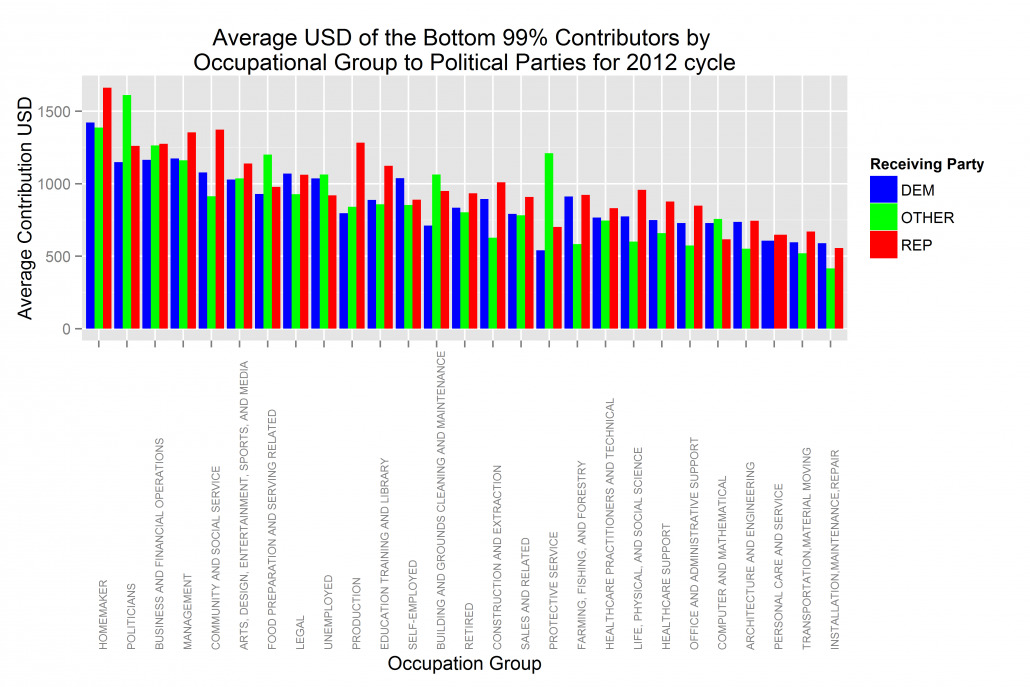
Another observation we could draw from the average contribution from the 99% plot is that “Other” non-Democrats/Republicans Parties depend heavily on the 99% as a source of funding for their political campaigns. Third-party candidates appear to be drawing most of their support from the little guy.
Figure 6: Median wages and median contribution by occupation group
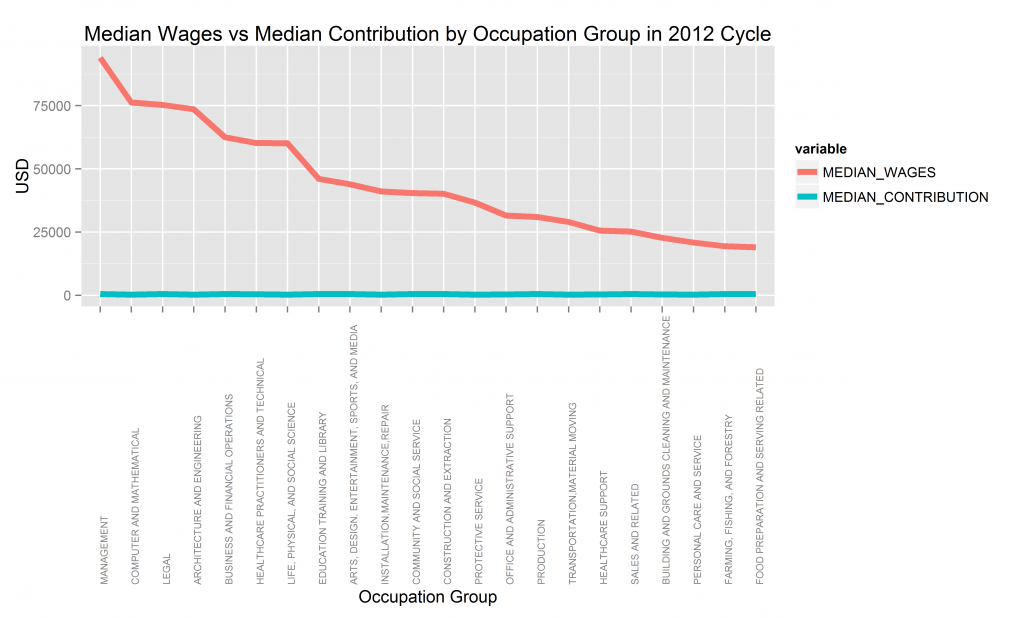
Median wages and median contribution
Another interesting question warranting further investigation is how the amount individuals contributed to political committees is proportionately consistent across occupation groups. When we plotted median wages per occupation group side by side with median political contribution, the median of donation per group is rather constant while the median income varies significantly across groups. This implies that despite contributing the most overall, as a percentage of their income the wealthiest donors contributed the least.
Campaign finance data: The takeaway
The take-home message from this analysis is that the top 1% wealthy elite seems to be driving the momentum of fundraising for the election campaign. I suspect most of them have full intention to support candidates who would look out for their interest if indeed they got elected. We middle-class citizens may not have the ability to compete financially with these millionaires and billionaires, but our single vote is as powerful as their vote. The best thing we could do as citizens is to educate ourselves on issues that matter to the future of our country.
Learn more about data science here
Written by Jasmine Wilkerson


