Price as low as $4499 | Learn to build custom large language model applications

This RHadoop tutorial resamples from a large data set in parallel. This blog is designed for beginners.

How-to: RHadoop (with R on Hadoop) to resample from a large data set 

Reposted from Cloudera blog.

Internet-scale datasets present a unique challenge to traditional machine-learning techniques, such as fitting random forests or “bagging.” To fit a classifier to a large data set, it’s common to generate many smaller data sets derived from the initial large data set (i.e. resampling). There are two reasons for this:

  1. Large data sets typically live in a cluster, so any operations should have some level of parallelism. Separate models fit on separate nodes that contain different subsets of the initial data.
  2. Even if you could use the entire initial data set to fit a single model, it turns out that ensemble methods, where you fit multiple smaller models using subsets of the data, generally outperform single models. Indeed, fitting a single model with 100M data points can perform worse than fitting just a few models with 10M data points each (so less total data outperforms more total data; e.g. see this paper).

Furthermore, bootstrapping is another popular method that randomly chops up an initial data set to characterize distributions of statistics and also to build ensembles of classifiers (e.g., bagging). Parallelizing bootstrap sampling or ensemble learning can provide significant performance gains even when your data set is not so large that it must live in a cluster. The gains from purely parallelizing the random number generation are still significant.

Sampling with replacement

Sampling-with-replacement is the most popular method for sampling from the initial data set to produce a collection of samples for model fitting. This method is equivalent to sampling from a multinomial distribution where the probability of selecting any individual input data point is uniform over the entire data set.

Unfortunately, it is not possible to sample from a multinomial distribution across a cluster without using some kind of communication between the nodes (i.e., sampling from a multinomial is not embarrassingly parallel). But do not despair: we can approximate a multinomial distribution by sampling from an identical Poisson distribution on each input data point independently, lending itself to an embarrassingly parallel implementation.

Below, we will show you how to implement such a Poisson approximation to enable you to train a random forest on an enormous data set. As a bonus, we’ll be implementing it in R and RHadoop, as R is many people’s statistical tool of choice. Because this technique is broadly applicable to any situation involving resampling a large data set, we begin with a full general description of the problem and solution.

Formal problem statement for RHadoop

Our situation is as follows:

  • We have N data points in our initial training set {xi}, where N is very large (106-109) and the data is distributed over a cluster.
  • We want to train a set of M different models for an ensemble classifier, where M is anywhere from a handful to thousands.
  • We want each model to be trained with K data points, where typically K << N. (For example, K may be 1–10% of.)

The number of training data points available to us, N, is fixed and generally outside of our control. However, K and M are both parameters that we can set and their product KM determines the total number of input vectors that will be consumed in the model fitting process. There are three cases to consider:

  • KM < N, in which case we are not using the full amount of data available to us.
  • KM = N, in which case we can exactly partition our data set to produce independent samples.
  • KM > N, in which case we must resample some of our data with replacement.

The Poisson sampling method described below handles all three cases in the same framework. (However, note that for the case KM = N, it does not partition the data, but simply resamples it as well.)

(Note: The case where K = N corresponds exactly to bootstrapping the full initial data set, but this is often not desired for very large data sets. Nor is it practical from a computational perspective: performing a bootstrap of the full data set would require the generation of MN data points and M scans of an N-sized data set. However, in cases where this computation is desired, there exists an approximation called a “Bag of Little Bootstraps.”)

The goal

So our goal is to generate M data sets of size K from the original N data points where N can be very large and the data is sitting in a distributed environment. The two challenges we want to overcome are:

  • Many resampling implementations perform M passes through the initial data set. which is highly undesirable in our case because the initial data set is so large.
  • Sampling-with-replacement involves sampling from a multinomial distribution over the N input data points. However, sampling from a multinomial distribution requires message passing across the entire data set, so it is not possible to do so in a distributed environment in an embarrassingly parallel fashion (i.e., as a map-only MapReduce job).

Poisson-approximation resampling

Our solution to these issues is to approximate the multinomial sampling by sampling from a Poisson distribution for each input data point separately. For each input point xi, we sample M times from a Poisson(K / N) distribution to produce M values {mj}, one for each model j. For each data point xi and each model j, we emit the key-value pair *<j, xi>*a total of MJ times (where MJ can be zero). Because the sum of multiple Poisson variables is Poisson, the number of times a data point is emitted is distributed as Poisson(KM / N), and the size of each generated sample is distributed as Poisson(K), as desired. Because the Poisson sampling occurs for each input point independently, this sampling method can be parallelized in the map portion of a MapReduce job.

(Note that our approximation never guarantees that every single input data point is assigned to at least one of the models, but this is no worse than multinomial resampling of the full data set. However, in the case where KM = N, this is particularly bad in contrast to the alternative of partitioning the data, as partitioning will guarantee independent samples using all N training points, while resampling can only generate (hopefully) uncorrelated samples with a fraction of the data.)

Ultimately, each generated sample will have a size K on average, and so this method will approximate the exact multinomial sampling method with a single pass through the data in an embarrassingly parallel fashion, addressing both of the big data limitations described above. Because we are randomly sampling from the initial data set, and similarly to the “exact” method of multinomial sampling, some of the initial input vectors may never be chosen for any of the samples. We expect that approximately exp{–KM / N} of the initial data will be entirely missing from any of the samples (see figure below).

Poisson Approximation

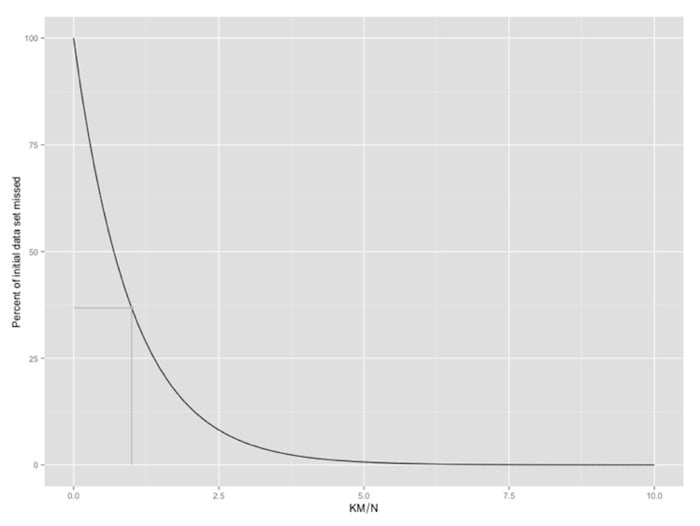
Amount of missed data as a function of KM / N. The value for KM = N is marked in gray.

Finally, the MapReduce shuffle distributes all the samples to the reducers and the model fitting or statistic computation is performed on the reduce side of the computation.

The algorithm for performing the sampling is presented below in pseudocode. Recall that there are three parameters —NM, and K — where one is fixed; we choose to specify T = K / N as one of the parameters as it eliminates the need to determine the value of N in advance.

/# example sampling parameters

T = 0.1 # param 1: K / N; average fraction of input data in each model; 10%

M = 50 # param 2: number of models

def map(k, v): // for each input data point

for i in 1:M // for each model

m = Poisson(T) // num times curr point should appear in this sample 

if m > 0 

 for j in 1:m // emit current input point proper num of times 

    emit (i, v)

def reduce(k, v): 

fit model or calculate statistic with the sample in v

Note that even more significant performance enhancements can be achieved if it is possible to use a combiner, but this is highly statistic/model-dependent.

Example: Kaggle Data Set on Bulldozer Sale Prices
We will apply this method to test out the training of a random forest regression model on a Kaggle data set found here. The data set comprises ~400k training data points. Each data point represents a sale of a particular bulldozer at an auction, for which we have the sale price along with a set of other features about the sale and the bulldozer. (This data set is not especially large, but will illustrate our method nicely.) The goal will be to build a regression model using an ensemble method (specifically, a random forest) to predict the sale price of a bulldozer from the available features.

Bulldozer
A bulldozer

Could be yours for $141,999.99

The data are supplied as two tables: a transaction table that includes the sale price (target variable) and some other features, including a reference to a specific bulldozer; and a bulldozer table, that contains additional features for each bulldozer. As this post does not concern itself with data munging, we will assume that the data come pre-joined. But in a real-life situation, we’d incorporate the join as part of the workflow by, for example, processing it with a Hive query or a Pig script. Since in this case, the data are relatively small, we simply use some R commands. The code to prepare the data can be found here.

Quick note on R and RHadoop

As so much statistical work is performed in R, it is highly valuable to have an interface to use R over large data sets in a Hadoop cluster. This can be performed with RHadoop, which is developed with the support of Revolution Analytics. (Another option for R and Hadoop is the RHIPE project.)

One of the nice things about RHadoop is that R environments can be serialized and shuttled around, so there is never any reason to explicitly move any side data through Hadoop’s configuration or distributed cache. All environment variables are distributed around transparently to the user. Another nice property is that Hadoop is used quite transparently to the user, and the semantics allow for easily composing MapReduce jobs into pipelines by writing modular/reusable parts.

The only thing that might be unusual for the “traditional” Hadoop user (but natural to the R user) is that the mapper function should be written to be fully vectorized (i.e., keyval() should be called once per mapper as the last statement). This is to maximize the performance of the mapper (since R’s interpreted REPL is quite slow), but it means that mappers receive multiple input records at a time and everything the mappers emit must be grouped into a single object.

Finally, I did not find the RHadoop installation instructions (or the documentation in general) to be in a very mature state, so here are the commands I used to install RHadoop on my small cluster.

Fitting an ensemble of Random forests with poisson sampling on RHadoop

We implement our Poisson sampling strategy with RHadoop. We start by setting global values for our parameters:

frac.per.model <- 0.1 # 10% of input data to each sample on avg num.models <- 50

As mentioned previously, the mapper must deal with multiple input records at once, so there needs to be a bit of data wrangling before emitting the keys and values:

#MAPPER

poisson.subsample <- function(k, v) {

#parse data chunk into data frame 

#raw is basically a chunk of a csv file 

raw <- paste(v, sep="\n") 

#convert to data.frame using read.table() in parse.raw()

input <- parse.raw(raw)


#this function is used to generate a sample from

#the current block of data

generate.sample <- function(i) {

#generate N Poisson variables

draws <- rpois(n=nrow(input), lambda=frac.per.model)

#compute the index vector for the corresponding rows,

#weighted by the number of Poisson draws

indices <- rep((1:nrow(input))[draws > 0], draws[draws > 0])

#emit the rows; RHadoop takes care of replicating the key appropriately 

#and rbinding the data frames from different mappers together for the

#reducer 

keyval(rep(i, length(indices)), input[indices, ])

}

#here is where we generate the actual sampled data

raw.output <- lapply(1:num.models, generate.sample)


#and now we must reshape it into something RHadoop expects

output.keys <- do.call(c, lapply(raw.output, function(x) {x$key}))

output.vals <- do.call(rbind, lapply(raw.output, function(x) {x$val}))

keyval(output.keys, output.vals)

}

Because we are using R, the reducer can be incredibly simple: it takes the sample as an argument and simply feeds it to our model-fitting function, randomForest():

#REDUCE function 

fit.trees <- function(k, v) {

#rmr rbinds the emited values, so v is a dataframe 

#note that do.trace=T is used to produce output to stderr to keep

#the reduce task from timing out

rf <- randomForest(formula=model.formula,

    data=v,

    na.action=na.roughfix,

    ntree=10, do.trace=TRUE)

#rf is a list so wrap it in another list to ensure that only

#one object gets emitted. this is because keyval is vectorized

keyval(k, list(forest=rf))

 }

Keep in mind that in our case, we are actually fitting 10 trees per sample, but we could easily only fit a single tree per “forest”, and merge the results from each sample into a single real forest.

Note that the choice of predictors has specified in the variable model. formula. R’s random forest implementation does not support factors that have more than 32 levels, as the optimization problem grows too fast. To illustrate the Poisson sampling method, we chose to simply ignore those features, even though they probably contain useful information for regression. In a future blog post, we will address various ways that we can get around this limitation.

The MapReduce job itself is initiated like so:

mapreduce(input="/poisson/training.csv",

input.format="text", map=poisson.subsample,

reduce=fit.trees,

output="/poisson/output")

The resulting trees are dumped in HDFS at Poisson/output.

Finally, we can load the trees, merge them, and use them to classify new test points:

raw.forests <- from.dfs("/poisson/output")[["val"]]

forest <- do.call(combine, raw.forests)

Conclusion

Each of the 50 samples produced a random forest with 10 trees, so the final random forest is an ensemble of 500 trees, fitted in a distributed fashion over a Hadoop cluster. The full set of source files is available here.

Hopefully, you have now learned a scalable approach for training ensemble classifiers or bootstrapping in a parallel fashion by using a Poisson approximation to multinomial sampling.

Every cook knows how to avoid Type I Error: just remove the batteries. Let’s also learn how to reduce the chances of Type II errors. 

Why type I and type II errors matter

A/B testing is an essential component of large-scale online services today. So essential, that every online business worth mentioning has been doing it for the last 10 years.

A/B testing is also used in email marketing by all major online retailers. The Obama for America data science team received a lot of press coverage for leveraging data science, especially A/B testing during the presidential campaign.

Hypothesis Testing Outcomes - type I and Type II errors
Hypothesis testing outcome – Data Science Dojo

Here is an interesting article on this topic along with a data science bootcamp that teaches a/b testing and statistical analysis.

If you have been involved in anything related to A/B testing (online experimentation) on UI, relevance or email marketing, chances are that you have heard of Type i and Type ii error. The usage of these terms is common but a good understanding of them is not.

I have seen illustrations as simple as this.

Examples of type I and type II errors

I intend to share two great examples I recently read that will help you remember this especially important concept in hypothesis testing.

Type I error: An alarm without a fire.

Type II error: A fire without an alarm.

Every cook knows how to avoid Type I Error – just remove the batteries. Unfortunately, this increases the incidences of Type II error.

Reducing the chances of Type II error would mean making the alarm hypersensitive, which in turn would increase the chances of Type I error.

Another way to remember this is by recalling the story of the Boy Who Cried Wolf.

Boy Who Cried Wolf


Null hypothesis testing: There is no wolf.

Alternative hypothesis testing: There is a wolf.

Villagers believing the boy when there was no wolf (Reject the null hypothesis incorrectly): Type 1 Error. Villagers not believing the boy when there was a wolf (Rejecting alternative hypothesis incorrectly): Type 2 Error

Tailpiece

The purpose of the post is not to explain type 1 and type 2 error. If this is the first time you are hearing about these terms, here is the Wikipedia entry: Type I and Type II Error.

Ethics in research and A/B testing is essential. A/B testing might not be as simple and harmless as it looks. Learn how to take care of ethical concerns in A/B tests.

The ethical way to A/B testing

We have come a long way since the days of horrific human experiments during World Wars, the Stanford prison experiment, the Guatemalan STD Study, and many more where inhumane treatments were all in the name of science.

However, we still have much to learn, with incidents like the clinical trial disaster in France and Facebook’s emotional and psychological experiments of recent years violating the rights of persons and serving as a clear reminder to constantly keep our ethics in research sharply upfront.

As data scientists, we are always experimenting – not only with our models or formulas but also with the responses from our customers. A/B tests or randomized experiments may require human subjects, who are willing to undertake a trial or treatment such as seeing certain content when using a Web app, or undergoing a certain exercise regime.

A/B Testing
Performing A/B test on a website

Facebook example

What may initially seem like a harmless experiment, might cause harm or distress. For example, Facebook’s experiment of provoking negative emotions from some users and positive emotions from others could have grave consequences. If a user, who was experiencing emotional distress happened to have seen content that provoked negative feelings, it could spur on a tragic event such as physical harm.

Careful understanding of our experiments and our test subjects may prevent inappropriate testing required prior to implementing our research, or products and services. Consent is the best tool to assist data scientists working with data generated by people. Similarly, to guidelines for clinical trials, it’s informed consent specifically that is needed to avoid potential unintended consequences of experiments.

If an organization specializing in exercise science accepted participation from a person who has a high risk of heart failure and did not ask for a medical examination before experimenting, then the organization is potentially liable for the consequences.

Often a simple, harmless A/B test might not be as simple and harmless as it looks. So how do we ensure we are not putting our human subjects’ well-being and safety in danger when we conduct our research and experiments?

First steps in research

The first port of call is using informed user consent. This doesn’t mean pages and pages of legal jargon on sign-up or being vague in an email when reaching out for volunteers for your study. This could rather be a popup window or email that is clear on the purpose of the experiment and any warnings or potential risks the person needs to be aware of.

Depending on how intense the treatment is, a medical or psychological examination is a good idea to ensure that the participant can cope with the given treatment. Being unaware of people’s vulnerabilities can lead to unintended consequences. This can be avoided through clearer warnings or the next level up which may be online assessments or even expert examinations.

The next step in ensuring your A/B test or experiment runs smoothly and ethically is making sure you understand local and federal regulations around conducting research experiments on humans. In the US, these regulations have been outlined above. The regulations mainly look at:


  • Informed consent, with a full explanation of any potential risks to the subject.
  • Providing additional safeguards for vulnerable populations such as children, mentally disabled people, mentally ill people, economically disadvantaged people, pregnant women, and so on.
  • Government-funded experiments need the approval of an Institutional Review Board or an independent ethics committee before conducting experiments.

During the A/B test or experiment, it’s also a good idea to regularly check in and see how your subjects are responding to the treatments, not only for scientific research but also to quickly solve any health or well-being issues.

This could be in the form of a short popup survey or email to check if the user is safe and well, or face-to-face consulting. Also, having an opt-out option allows the subject to take control if they feel their health or well-being is at risk. Having some people opt out might seem inconvenient for your study, but a serious or tragic incident as a result of a participant having to go through the full course of the treatment is a far worse outcome.

Observational studies might be a good alternative if the above steps are in no way feasible for your experiment. Observational studies are limited when making conclusions, and only real experiments allow you to make confident conclusions from the data. However, in some situations, it is not possible nor ethical to force treatments onto subjects.

For example, it’s not ethical to inject cancer cells into random subjects, but you can study cancer patients with the inherited attributes you are looking for to help with your research.

The ethical takeaway

It is understood that there can be some overhead in carefully preparing, setting up, and following ethical guidelines for an experiment or A/B test. However, the serious consequences of not doing it properly, as well as public distrust, will only lead to a reluctance to share data, hindering our ability to effectively do our work.

If you’re curious to learn more about A/B testing, watch the short video below.

What do you think about your privacy? Do you wonder why data privacy and data anonymization are important? Read along to find all the answers. 

Internet companies of the world have the resources and power to be able to collect a microscopic level of detail on each and every one of its users and build their user profiles. In this day and age, it’s almost delusional to think that we still operate in a world that sticks by the good, old ideals of data privacy.

You have experienced, at some point in your life, a well-targeted email, phone call, letter, or advertisement.

Why should we care?

“If someone had nothing to hide, why should she/he care?” You have heard this argument before. Let’s use an analogy that explains why some people *do *care about privacy, despite having “nothing to hide”:

You just came home from a date. You are excited and can’t believe how awesome the person you are dating is. In fact, it feels too good to be true how this person just “gets you,” and it feels like he/she has known you for an exceptionally long time. However, as time goes by, the person you are dating starts to change and the romance wears off.

You notice from unintentionally glimpsing at your date’s work desk that there is a folder stuffed with your personal information. From your place of birth to your book membership status and somehow even your parents’ contact information! You realize this data was used to relate to you on a personal level.

The folder doesn’t contain anything that shows you are of bad character, but you still feel betrayed and hurt that the person you are dating disingenuously tried to create feelings of romance. As data scientists, we don’t want to be the date who lost another person’s trust, but we also don’t want to have zero understanding of the other person. How can we work around this challenge?

Learn more about data science for business leaders

Simple techniques to anonymize Data

A simple approach to maintaining personal data privacy when using data for predictive modeling or to glean insightful information is to scrub the data.

Scrubbing is simply removing personally identifiable information such as name, address, and date of birth. However, cross-referencing this with public data or other databases you may have access to could be used to fill in the “missing gaps” in the scrubbed dataset.

The classic example of this was when then MIT student Latanya Sweeny was able to identify an individual using a scrubbed health records and cross-referencing it with voter-registration records.

Tokenization is another commonly used technique to anonymize sensitive data by replacing personally identifiable information such as a name with a token such as a numerical representation of that name. However, the token could be used as a reference to the original data.

Sophisticated techniques to anonymize data

More sophisticated workarounds that help overcome the de-anonymization of data are differential privacy and k-anonymity.

data Privacy
Importance of privacy

Differential privacy

Differential privacy uses mathematical mechanisms to add random noise to the original dataset to mask personally identifiable information, while making it possible to probabilistically return similar search results if you were to run the same query over the original dataset. An analogy is trying to disguise a toy panda with a horse head, creating just enough of a disguise to not recognize it’s a panda.

When queried, it returns the counts of toys, which the disguised panda belongs to, without recognizing an individual panda toy.

Apple, for example, has started using differential data privacy with its iOS 10 devices to uncover patterns in user behavior and activity without having to identify individual users. This allows Apple to analyze purchases, web browsing history, and health data while maintaining your privacy.

K-anonymity

K-anonymity also aggregates data. It takes the approach of looking for k specified number of people that contain the same identifiable combination of attributes so that an individual is hidden within that group. Identifiable information such as age can be generalized so that age is replaced with an approximation such as less than 25 years of age or greater than 50 years of age.

However, lack of randomization to mask sensitive data means k-anonymity can be vulnerable to being hacked.

Remember: It’s your data privacy, too

As data scientists, it can be easy to disassociate ourselves from data, which is not personally our own, but other people’s. It can be easy to forget that the data we hold in our hands are not just endless records but are the lives of the people who kindly gave up some of their data privacy so that we could go about understanding the world better.

Besides the serious legal consequences of breaching data privacy, remember that it could be your personal life records in a stranger’s hands.

What are Data Scientists? What job skills should they possess? Learn about the essential data scientist skills and their roles.

How do we distinguish a genuine data scientist from a dressed-up business analyst, BI, or other related roles?

Truth be told, the industry does not have a standard definition of a data scientist. You have probably heard jokes like “A data scientist is a data analyst living in Silicon Valley”. Just for fun, take a look at the below cartoon that demonstrates this.

Finding an “effective” data scientist is difficult. Finding people to play the role of a data scientist can be equally difficult. Note the use of “effective” here. I use this word to highlight the fact that there could be people who possess some of these data science skills yet may not be the best fit for a data science role. The irony is that even people looking to hire data scientists might not fully understand data science. There are still some job advertisements in the market that describe traditional data analyst and business analyst roles while labeling it a “Data Scientist” position.

Instead of giving a list of data science skills with bullet points, I will highlight the differences between some of the data-related roles.

Consider the following scenario:

Shop-Mart and Bulk-Mart are two competitors in the retail setting. Someone high up in the management chain asks this question: “How many Shop-Mart customers also go to Bulk-Mart?” Replace Shop-Mart and Bulk-Mart with Walmart, Target, Safeway, or any retail outlets that you know of. The question might be of interest to the management of one of these stores or even a third party. The third party could possibly be a market research or consumer behavior company interested in gathering actionable insights about consumer behavior.

How professionals in different data-related roles will approach the problem:

Traditional BI/Reporting professional:

The BI professional generates reports from structured data using SQL and some kind of reporting services (SSRS for example) and sends the data back to management. Management asks more questions based on the data that was sent, and the cycle continues. Insights about the data are most likely not included in the reports. A person in this role will be experienced mostly in database-related skills.

Data analyst:

data_analyst
Data analyst working on data sheets


In addition to doing what a BI professional does, a data analyst will also keep other factors like seasonality, segmentation, and visualization in mind. What if certain trends in shopping behavior are tied to seasonality?

What if the trends are different across gender, demographics, geography, or product category? A data analyst will slice and dice the data to understand and annotate the report. Aside from database skills, a data analyst will have an understanding of some of the common visualization tools.

Business analyst:

A business analyst possesses the skills of a BI professional and a data analyst, plus they have domain knowledge and an understanding of the business. A business analyst may also have some basic skills in forecasting.

Data mining or big data engineer:

mining
Mining work depicting data mining

A data miner does the job of the data analyst, possibly from unstructured data if needed, plus possesses MapReduce and other big data skills. An understanding of common issues in running jobs on large-scale data and debugging of MapReduce jobs is needed.

Statistician (a traditional one):

A statistician pulls data from a database or obtains it from any of the roles mentioned above and performs statistical analysis. This person ensures the quality of data and correctness of the conclusions by using standard practices like choosing the right sample size, confidence level, level of significance, type of test, and so on.

In the past, statisticians did not traditionally come from a computer science background, needed for writing code to implement statistical models. The situation has changed, Stat students now graduating with strong programming skills and decent foundation skills in CS. This enables them to perform the tasks that previous statisticians were not trained for traditionally.

Program/Project manager:

meeting
Project managers working together

The program or project manager looks at all the data provided by the professionals mentioned so far, aligns these findings with the business, and influences the leadership to take appropriate action. This person possesses communication and presentation skills that can influence others without authority.

Ironically a PM is influencing business decisions using the data and insights provided by others. If the person does not have a knack for understanding data, chances are that they will not be able to influence others to make the best decisions.

Now, putting it all together

The rise of online services has brought a paradigm shift in the software development life cycle and business iteration over successive features and products. Having a different data puller, analyst, statistician, and project manager is just not possible anymore. Now the mantra is: ship, experiment, and learn; adapt; ship, experiment, and learn. This situation has resulted in the birth of a new role: a data scientist.

The mentioned qualities make up the needed data scientist skills. In addition to the skills mentioned above, a data scientist should have rapid prototyping and programming, machine learning, visualization, and hacking skills.

Domain knowledge and soft skills are equally important as technical skills

The importance of domain knowledge and soft skills, like communication and influencing without authority, are severely underestimated both by hiring managers and aspiring data scientists. Insights without domain knowledge can potentially mislead the consumers of these insights. Correct insights without the ability to influence decision-making are just as bad as having no insights.

All of what I have said above is based on my own tenure as a data scientist at a major search engine and later with the advertising platform within the same company. I learned that sometimes people asking the question may not understand what they want to know. This sounds preposterous yet it happens way too often.

Very often a bozo will start digging into something that is not related to the issue at hand just to prove that he/she is relevant. A data scientist encounters such HIPPOs (Highly Paid Person’s Opinions) that are somewhat unrelated to the problem and are very often a big distraction from the problem at hand.

Data scientist skills must include the ability to manage situations such as people asking irrelevant, distracting questions that are outside the scope of the task at hand. This is hard, especially in situations where the person asking the question is several levels up the corporate ladder and is known to have an ego. It is a data scientist’s responsibility to manage up and around while presenting and communicating insights.

Suggested skills a data science expert should possess

Curiosity about data and passion for the domain

If you are not passionate about the domain or business, and if you are not curious about data, then it is unlikely that you will succeed in a data scientist role. If you are working with an online retailer, your data scientist skills should be hungry to crunch and munch from the smorgasbord (of data, of course) to know more. If your curiosity does not keep you awake, no skill in the world can help you succeed.

Soft skills:

hello

Communication and influencing without authority are necessary skills. Understand the minimum action that has the maximum impact. Too many findings are as bad as no findings at all.  The ability to scoop information out of partners and customers, even from the unwilling ones, is extremely important. The data you are looking for may not be sitting in one single place. You may have to beg, borrow, steal, and do whatever it takes to get the data.

Being a good storyteller is also something that helps. Sometimes the insights obtained from data are counter-intuitive. If you’re not a good storyteller, it will be difficult to convince your audience.

Math/Theory

Machine Learning algorithms, statistics, and probability 101 are fundamental to data science. This includes understanding probability distributions, linear regression, statistical inference, hypothesis testing, and confidence intervals. Learning optimization, such as gradient descent, would be the icing on the cake.

Computer science/programming

clutter
Programming language

You should know at least one scripting language (I prefer Python), or a statistical tool such as R. There are plenty of resources to get started. Data Science Dojo provides numerous, free tutorials on getting started with Python and R. You can also learn the basics of programming from sites like CodeAcademy and LearnPython.

It is necessary to possess decent algorithms and DS skills in order to write code that can analyze a lot of data efficiently. You may not be a production code developer, but you should be able to write decent code.

Database management and SQL skills are also helpful, as this is where you will be fetching your data to build models. It also doesn’t hurt to understand Microsoft Excel or another spreadsheet software.

Big data and distributed systems

distribution
Distributed systems showing the distribution of data

You need to understand basic MapReduce concepts, the Hadoop and Hadoop file systems, and at least one language like Hive/Pig. Some companies have their own proprietary implementations of these languages.
Knowledge of tools like Mahout and any of the XaaS, like Azure and AWS, would be helpful. Once again, big companies have their own XaaS, so you may be working on variants of any of these.

Visualization

Possess the ability to create simple yet elegant and meaningful visualizations. Personally, R packages like ggplot, lattice, and others have helped me in most cases, but there are other packages that you can use. In some cases, you might want to use D3.

A visualization of data scientist skills:

How to become a data scientist
Data scientist skills

Where are data scientists in the big data pipeline?

Below is a visualization of the big data pipeline, the associated technologies, and the regions of operation. In general, the depiction of where the data scientist belongs in this pipeline is largely correct, but there is one caveat. Data scientist skills must include being comfortable about diving into the “Collect” and “Store” territories if needed. Usually, data scientists are working on transformed data and beyond. However, in scenarios where the business cannot afford to wait for the transformation process to finish, data scientist skills enable them to work on raw data to gather insights.

Big-Data-Technologies-Platforms-and-Products_vn2bcg


Are you ready to become a data scientist? Are you interested in possessing the data scientist skills? Learn the foundation of data science and start implementing your models in our time convenient, 5-day bootcamp. Check it out here!