For a hands-on learning experience to develop Agentic AI applications, join our Agentic AI Bootcamp today. Early Bird Discount
Explore, analyze, and visualize data using Power BI Desktop to make data-driven business decisions


The Power BI Bootcamp is built for professionals who want to turn raw data into interactive dashboards and business-ready insights—no coding required.
Learn how to build dashboards, track KPIs, and make data-driven decisions using real business datasets and Power BI’s advanced features.
If you work with reports, metrics, or performance dashboards, Power BI helps you automate reporting and uncover trends faster than Excel ever could.
Master Power BI to offer analytics services, streamline business reporting, and position yourself as the go-to data storyteller in your space.
Learn from though leaders at the forefront of building power BI applications
Overview of the topics and practical exercises.
Microsoft Power BI is a business intelligence tool that connects to various data sources and creates interactive visualizations to help you uncover insights.
Whether your data comes from Excel, CSV files, or cloud and on-premises databases, Power BI lets you connect, transform, model, and visualize data easily.
In this module, you will:
Power BI Desktop connects to multiple data sources through built-in connectors. Power Query, its data transformation engine, enables you to clean, reshape, and prepare data using an intuitive interface.
In this module, you will:
Data modeling involves organizing data from multiple sources and defining relationships between tables to create a unified model. In Power BI Desktop, this allows you to build dynamic visuals and reports.
A well-designed model simplifies data and improves report performance. You will also learn how to use the star schema and create calculated columns and measures using DAX (Data Analysis Expressions).
In this module, you will:
Data Analysis Expressions (DAX) is the formula language in Power BI, used for calculations and data analysis. It helps you create measures, columns, and tables for advanced reporting.
In this module, you will:
Power BI makes it easy to create insightful reports with rich visualizations that help you explore data and make informed decisions.
In this module, you will:
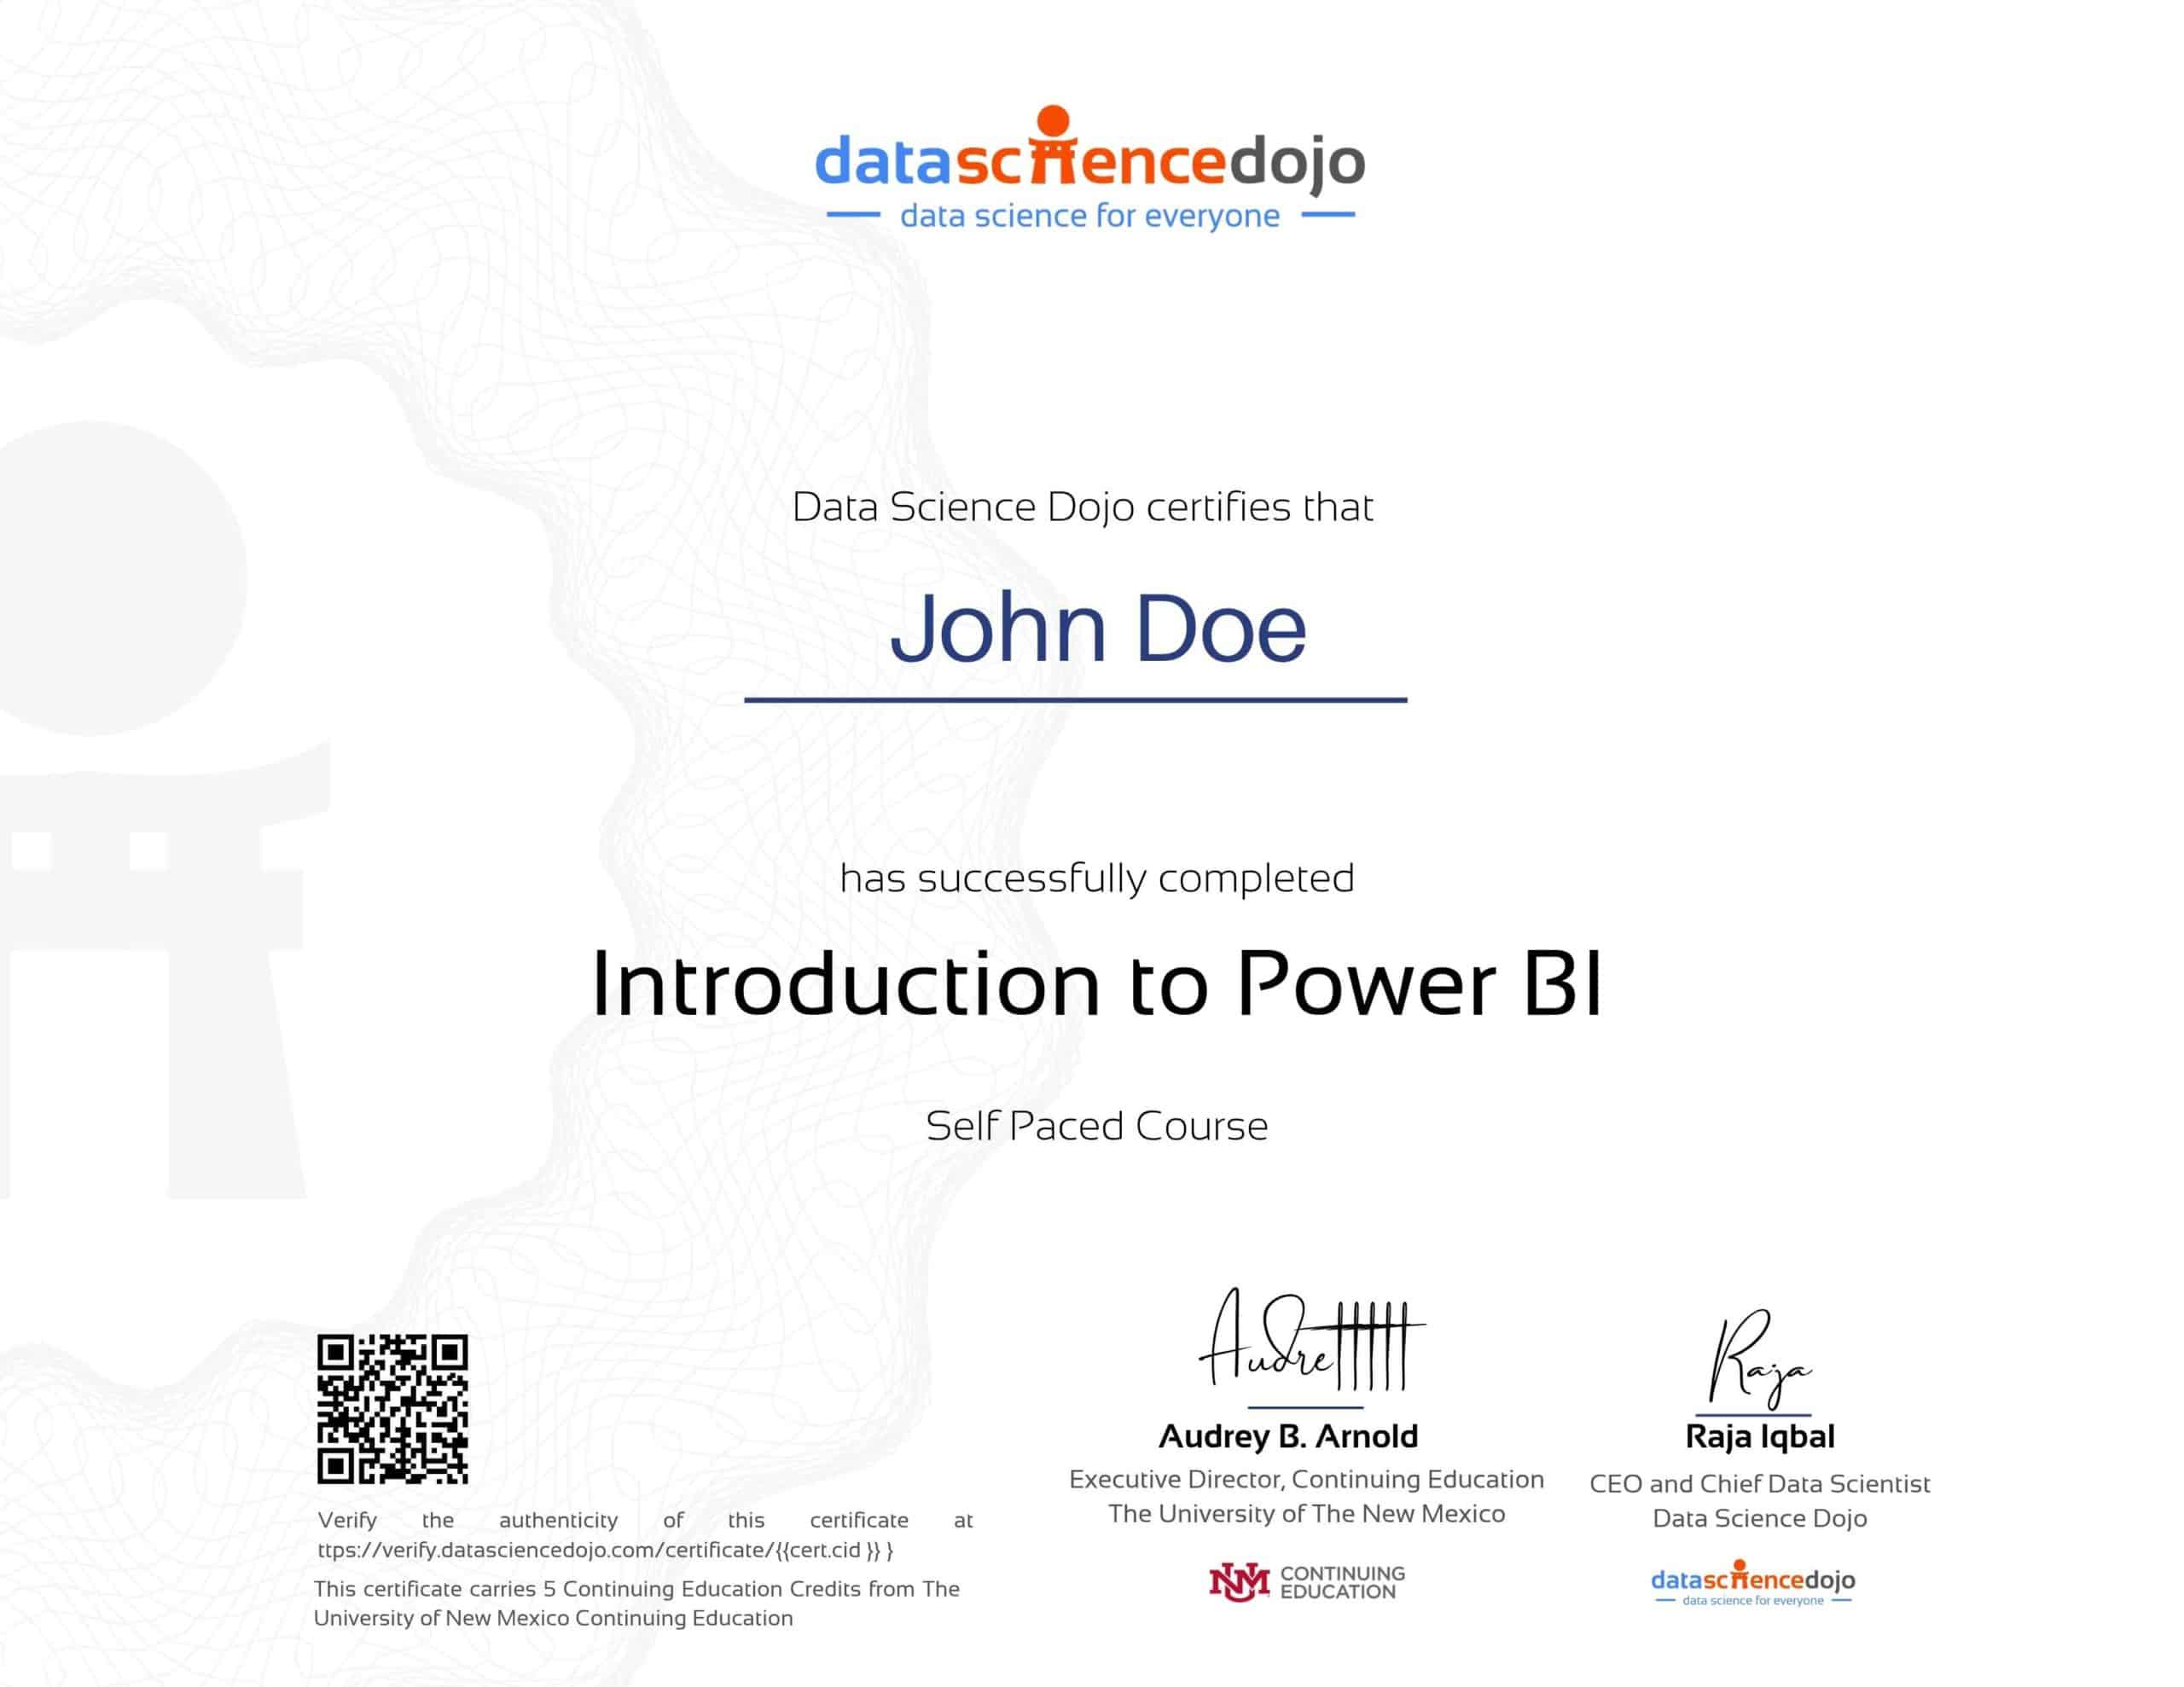
Earn a verified certificate from The University of New Mexico Continuing Education:

All of our programs are backed by a certificate from The University of New Mexico, Continuing Education. This means that you may be eligible to attend the bootcamp for FREE.


Explore, analyze, and visualize data using Power BI Desktop to make data-driven business decisions
Access to the program content depends on the plan you choose at the time of registration. Learn more about different plans here.
Introduction to Power BI is a 5 day long, 3 hours per day, for a total of 15 hours of training.
Classes are live and instructor-led. Office hours will be available for 5 days of the training in case students need assistance. Lectures will also be recorded to give students the option to go back and review.
The cost will depend on the plan purchased by the students and the discounts available at the time. Please contact us at [email protected] for updated information on discount availability and payment plans.
Yes, our live instructor-led sessions are interactive. During these sessions, students are encouraged to ask questions, and our instructors respond without rushing. Additionally, discussions within the scope of the topic being taught are actively encouraged. We understand that questions may arise during homework, and to assist with that, we offer office hours to help unblock students between sessions. Rest assured, you won’t have to figure everything out by yourself – we are committed to providing the support you need for a successful learning experience.
We offer a learning plan with an optional add-on for this training.
Training Plan. With this plan, you will get 15 hours of live training, pre-training material, downloadable Power BI file, learning platform access for 6 months and daily office hours during the training period.
Certification Add-on. With this add-on, you will get one Microsoft PL-300 exam coupon and a verified certificate from The University of New Mexico worth 2 Continuing Education credits.
* The add-on can only be purchased with the Training Plan
Yes, we are offering an early-bird discount on the Training Plan
To register for the program, simply view our packages and register for the upcoming cohort. The payment can be made online on our website, via invoice, or wire transfer.
Once you are registered for the program, you will receive a few emails from us. One of those emails will contain steps to create your learning portal account and access the program content. Please follow the steps in the email to create your account. If you’re facing any difficulty please email us at [email protected] for assistance.
Transfers are allowed once with no penalty. Transfers requested more than once will incur a $200 processing fee.
If for any reason, you decide to cancel, we will gladly refund your registration fee in full if notified the Monday prior to the start of the training. We would also be happy to transfer your registration to another bootcamp or workshop. Refunds cannot be processed if you have transferred to a different bootcamp after registration.